

Australian Dollar, AUD/USD, GDP, RBA, Commodities, Russia, Ukraine
- The Australian Dollar holds the high ground after strong GDP numbers
- AUD opened the week lower but has recovered as commodities soar
- The uncertainty in Ukraine is underpinning AUD/USD. Will it make new highs?
The Australian Dollar remains elevated amid 4Q quarter-on-quarter GDP coming in at 3.4% against forecasts of 3.5% and a previous 1.9%.
This made annual GDP to the end of 2021 4.2% instead of 4.1% anticipated and 3.9% prior. It reveals some upward revisions to previous quarters.
Today’s data comes hot on the heels of robust retail sales data on Monday and the RBA leaving monetary policy and the official cash rate unchanged yesterday (Tuesday) at 0.10%.
AUD/USD SHORT TERM CHART
Additionally, the RBA released the latest reading for their Index of Commodity Prices for February. It highlights the robustness of Australia’s commodity exports, as shown in the 4th quarter current account surplus of AU$ 12.1 billion, both were also released yesterday.
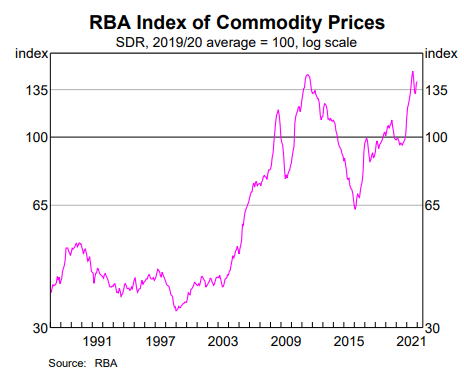
The index was compiled before the extra boost higher in commodities overnight, which could add further upward pressure on AUD/USD.
The bigger picture remains unclear with the war in the Ukraine continuing to provide markets with wild moves. Risk rotation continues to be a theme, but this environment would normally work against AUD/USD.
It would seem that the squeeze in commodities prices, and the lack of exposure of the Australian economy to Russia is the focus for FX markets for now.
AUD/USD Technical Analysis
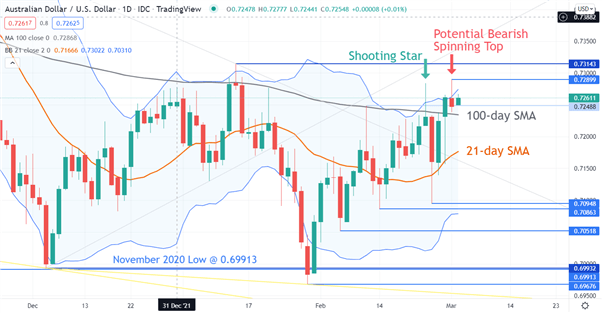
AUD/USD has been in a broad range of 0.69676 – 0.73143 since November last year.
Yesterday it attempt to test the upper bound of this range but pulled back and revealed a potential bearish Spinning Top Candlestick pattern.
The body of the candlestick is possibly slightly larger than would normally be the case, but the price slid a few ticks just before the close. It may still be in play.
A similar shooting star candlestick pattern emerged last week just before a sell-off. It should be noted though that past performance is not indicative of future results.
Another potential reversal indicator could be the close back inside the upper band of the 21-day simple moving average (SMA) based Bollinger Band after previously closing outside the band.
Conflicting with these bearish indicators is the price sitting above the 21 and 100-day SMAs, which might indicate bullish momentum is intact.
Additionally, since making the low at 0.69676 in January, the price has made higher highs and higher lows, which may lead to an ascending trend.
Resistance might be offered at the previous highs of 0.72899 and 0.73143.
On the downside, support may lie below the 21 and 100-day SMAs at the previous lows of 0.70948 and 0.70863.
— Written by Daniel McCarthy, Strategist for DailyFX.com
To contact Daniel, use the comments section below or @DanMcCathyFX on Twitter
Be the first to comment