

PonyWang/E+ via Getty Images
(This article was co-produced with Hoya Capital Real Estate.)
In my last article, I recommended that investors bookmark BLV as we approach 2023.
In short, the underlying thesis was this. Recently, the Federal Reserve has repeatedly reiterated its determination to bring inflation under control. Following a strong market rebound in July and early August that suggested investors might have believed the Fed was “bluffing” with respect to the path of interest rates, first Neel Kashkari and then Jerome Powell made unequivocal public statements disabusing any such notions.
This was followed, in turn, by the Fed’s 3rd consecutive .75% rate increase in September along with expectations of a terminal rate of 4.6% in 2023.
Suddenly, it appeared the markets got the message. In all honesty, the reaction since that time has been about what I would have expected if the Fed had truly shocked everyone with a full 1% increase in September.
Take a look at the below graphic, which documents the price action of ETFs which serve as proxies for the S&P 500 index as well as intermediate- and long-term bonds.
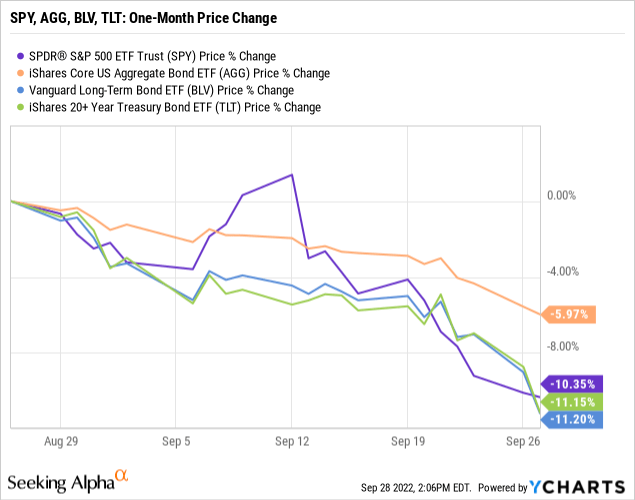
As can be seen, stocks fell off a cliff once it became clear what the Fed action would likely be, and have continued downward since that time. However, long term bonds fell to an even greater extent.
And thus the idea to at least start “dipping one’s toe” in the long-term bond segment. Yields are up substantially, offering current income. On top of that, if the expected recession materializes, the possibility for capital gains exists as the Fed eases at some future point.
But now, let’s turn to stocks. Thinking through the same possibilities led me to take my first look at SPDR Portfolio S&P 500 Growth ETF (NYSEARCA:SPYG). Might this ETF be a good investment at this particular point in time?
SPDR Portfolio S&P 500 Growth ETF – Digging In
First of all, SPYG checks all the boxes in terms of being a solid addition to your portfolio. With an inception date of 9/25/2000, it goes back to the very early days of ETF development. It carries an extremely low expense ratio of .04% and a small trading spread of .02%.
Here is how the fund’s fact sheet describes the index on which it is based.
The S&P 500 Growth Index measures the performance of the large-capitalization growth segment of the U.S. equity market. The Index consists of those stocks in the S&P 500 Index exhibiting the strongest growth characteristics based on: (i) sales growth; (ii) earnings change to price; and (iii) momentum. The Index is float- adjusted market capitalization weighted.
The first thing to focus on is that, while this fund seeks growth, it sticks to large-capitalization stocks, those within the S&P 500 index.
To get an idea of what this means, from SPYG’s webpage, let’s take a look at the fund’s Top 10 holdings.
SPYG: Top 10 Holdings (State Street Advisors)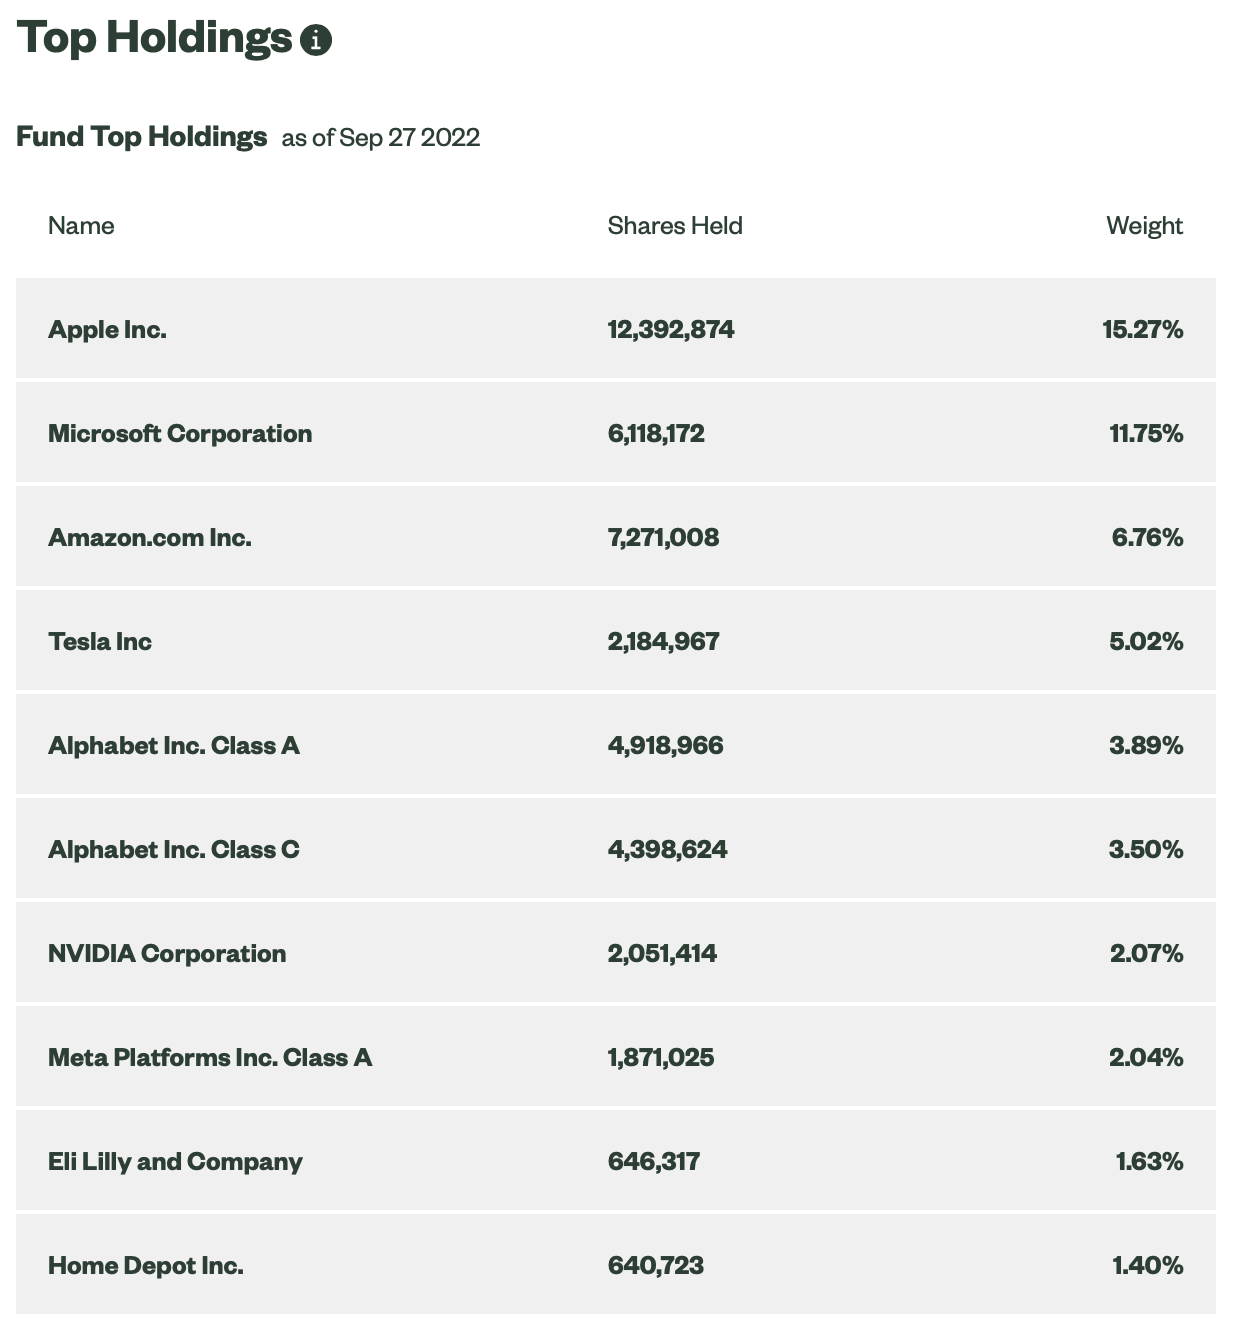
As can quickly be seen, SPYG presents a bit of a double-edged sword. On the one hand, companies such as Apple (AAPL), Microsoft (MSFT) and Amazon (AMZN) are the sorts of companies I think most of us would like to have in our portfolios. These firms tend to be profitable industry leaders, with durable competitive advantages. As a result, they tend to attract lofty valuations.
On the other hand, if they do not perform up to those steep expectations, those valuations can be cut just as quickly as they were raised.
In the title of my article, I asked how much you liked the three companies mentioned above. I asked that question because of the concentrated nature of SPYG. Together, as of September 27, they form no less than a third (33.78% to be exact) of the entire fund. Expand out to the Top 10 holdings and we are up to 53.33% of the fund.
As a quick comparison, Apple, Microsoft, and Amazon also happen to be the 3 largest holdings in Vanguard Total Stock Market ETF (VTI). However, their collective weight in VTI is 13.73%.
Again, that double-edged sword. On the one hand, SPYG’s firm-specific risk warrants attention. On the other hand, the fund’s heaviest holdings tend to be some of the market’s safer bets.
Next, let’s dig just a little deeper, into the sector breakdown.
SPYG: Sector Breakdown (State Street Advisors)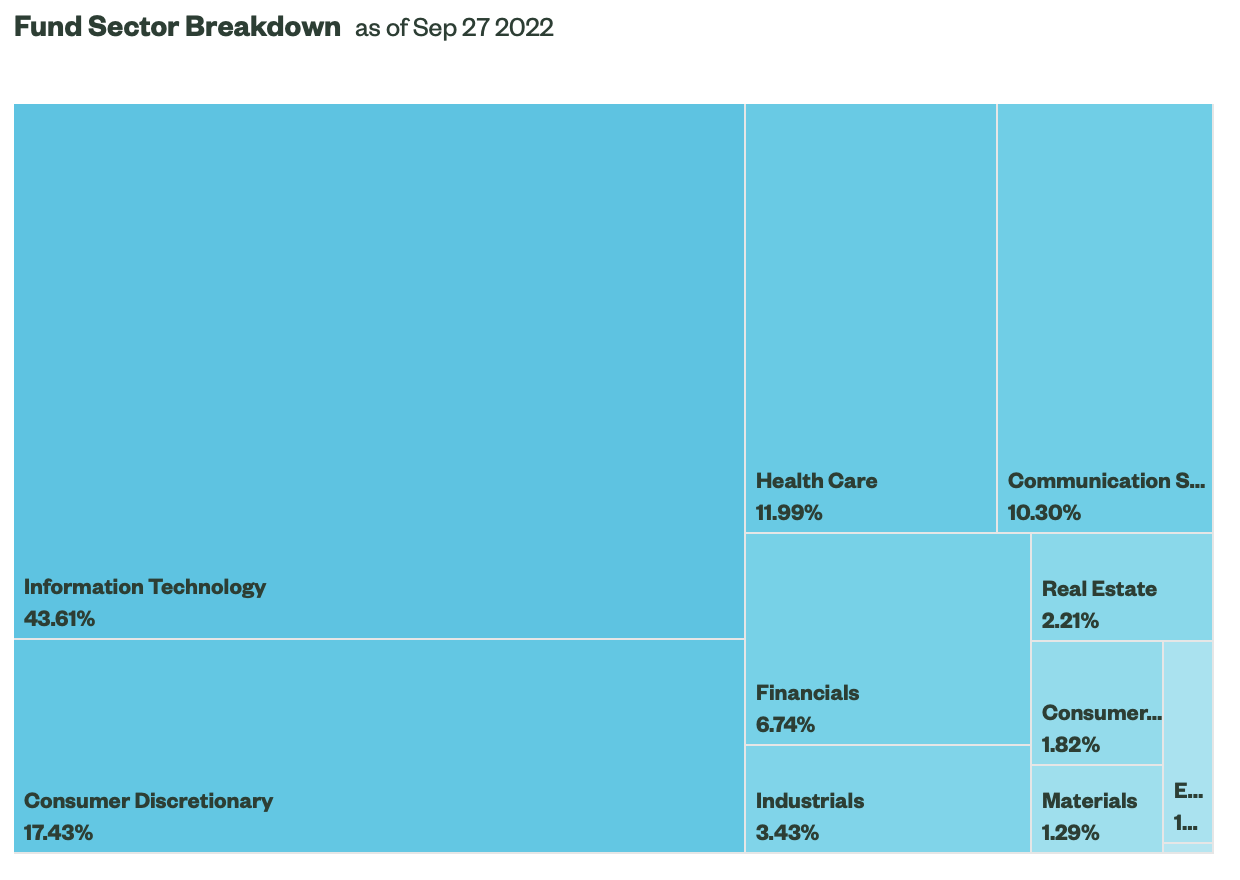
Here again, SPYG lays very heavy bets, so to speak. You likely note that a full 61% of its holdings are in two sectors; Information Technology and Consumer Discretionary. As a comparison, VTI’s weightings in those two sectors are 25.80% and 14.80% respectively, for a total of roughly 41%. In contrast, defensive sectors are almost nonexistent in SPYG, while these same sectors are at least moderately represented in VTI.
Examining Recent and Longer-Term Performance
In the above section, I introduced VTI as perhaps an interesting alternative to SPYG. As you likely are aware, VTI is a top quality proxy for the total U.S. stock market. In addition to large-cap stocks, VTI gives on exposure to mid- and even small-cap stocks, typically segments of the markets offering greater growth.
With that thought in mind, have a look at the YTD price performance of SPYG as compared to VTI.
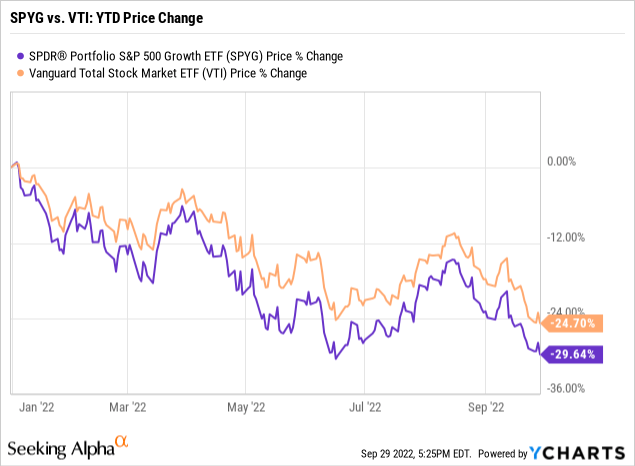
Quickly, it becomes clear that SPYG has significantly underperformed VTI in terms of price thus far in 2022. On top of that, SPYG offers a lower level of dividend income, compounding its recent underperformance.
Have SPYG’s three largest holdings played a part in this? Take a look for yourself.
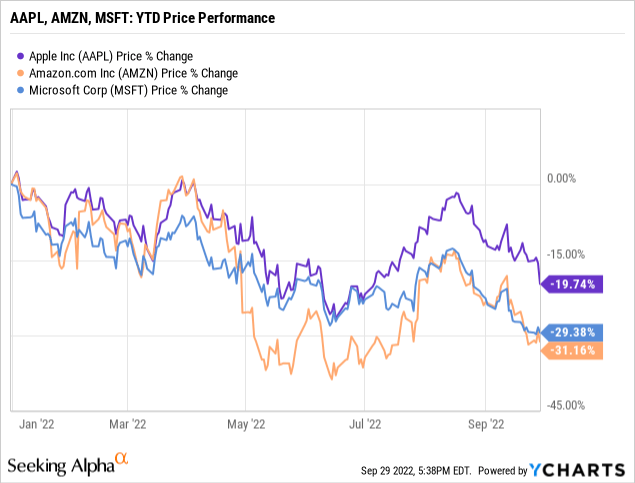
Here, then, is a most interesting dilemma for you to ponder at this particular point in time. It would appear that a nice opportunity is presenting itself to purchase an ETF heavily weighted in these 3 market leaders at a very attractive price.
On the other hand, let’s take a step back and look at a much bigger picture.
In this backtest, I was able to compare SPYG against VTI for a period of over 20 years. In the backtest, all dividends are shown, and were reinvested.
First, the historical returns.
SPYG vs. VTI: Historical Performance (PortfolioVisualizer.com)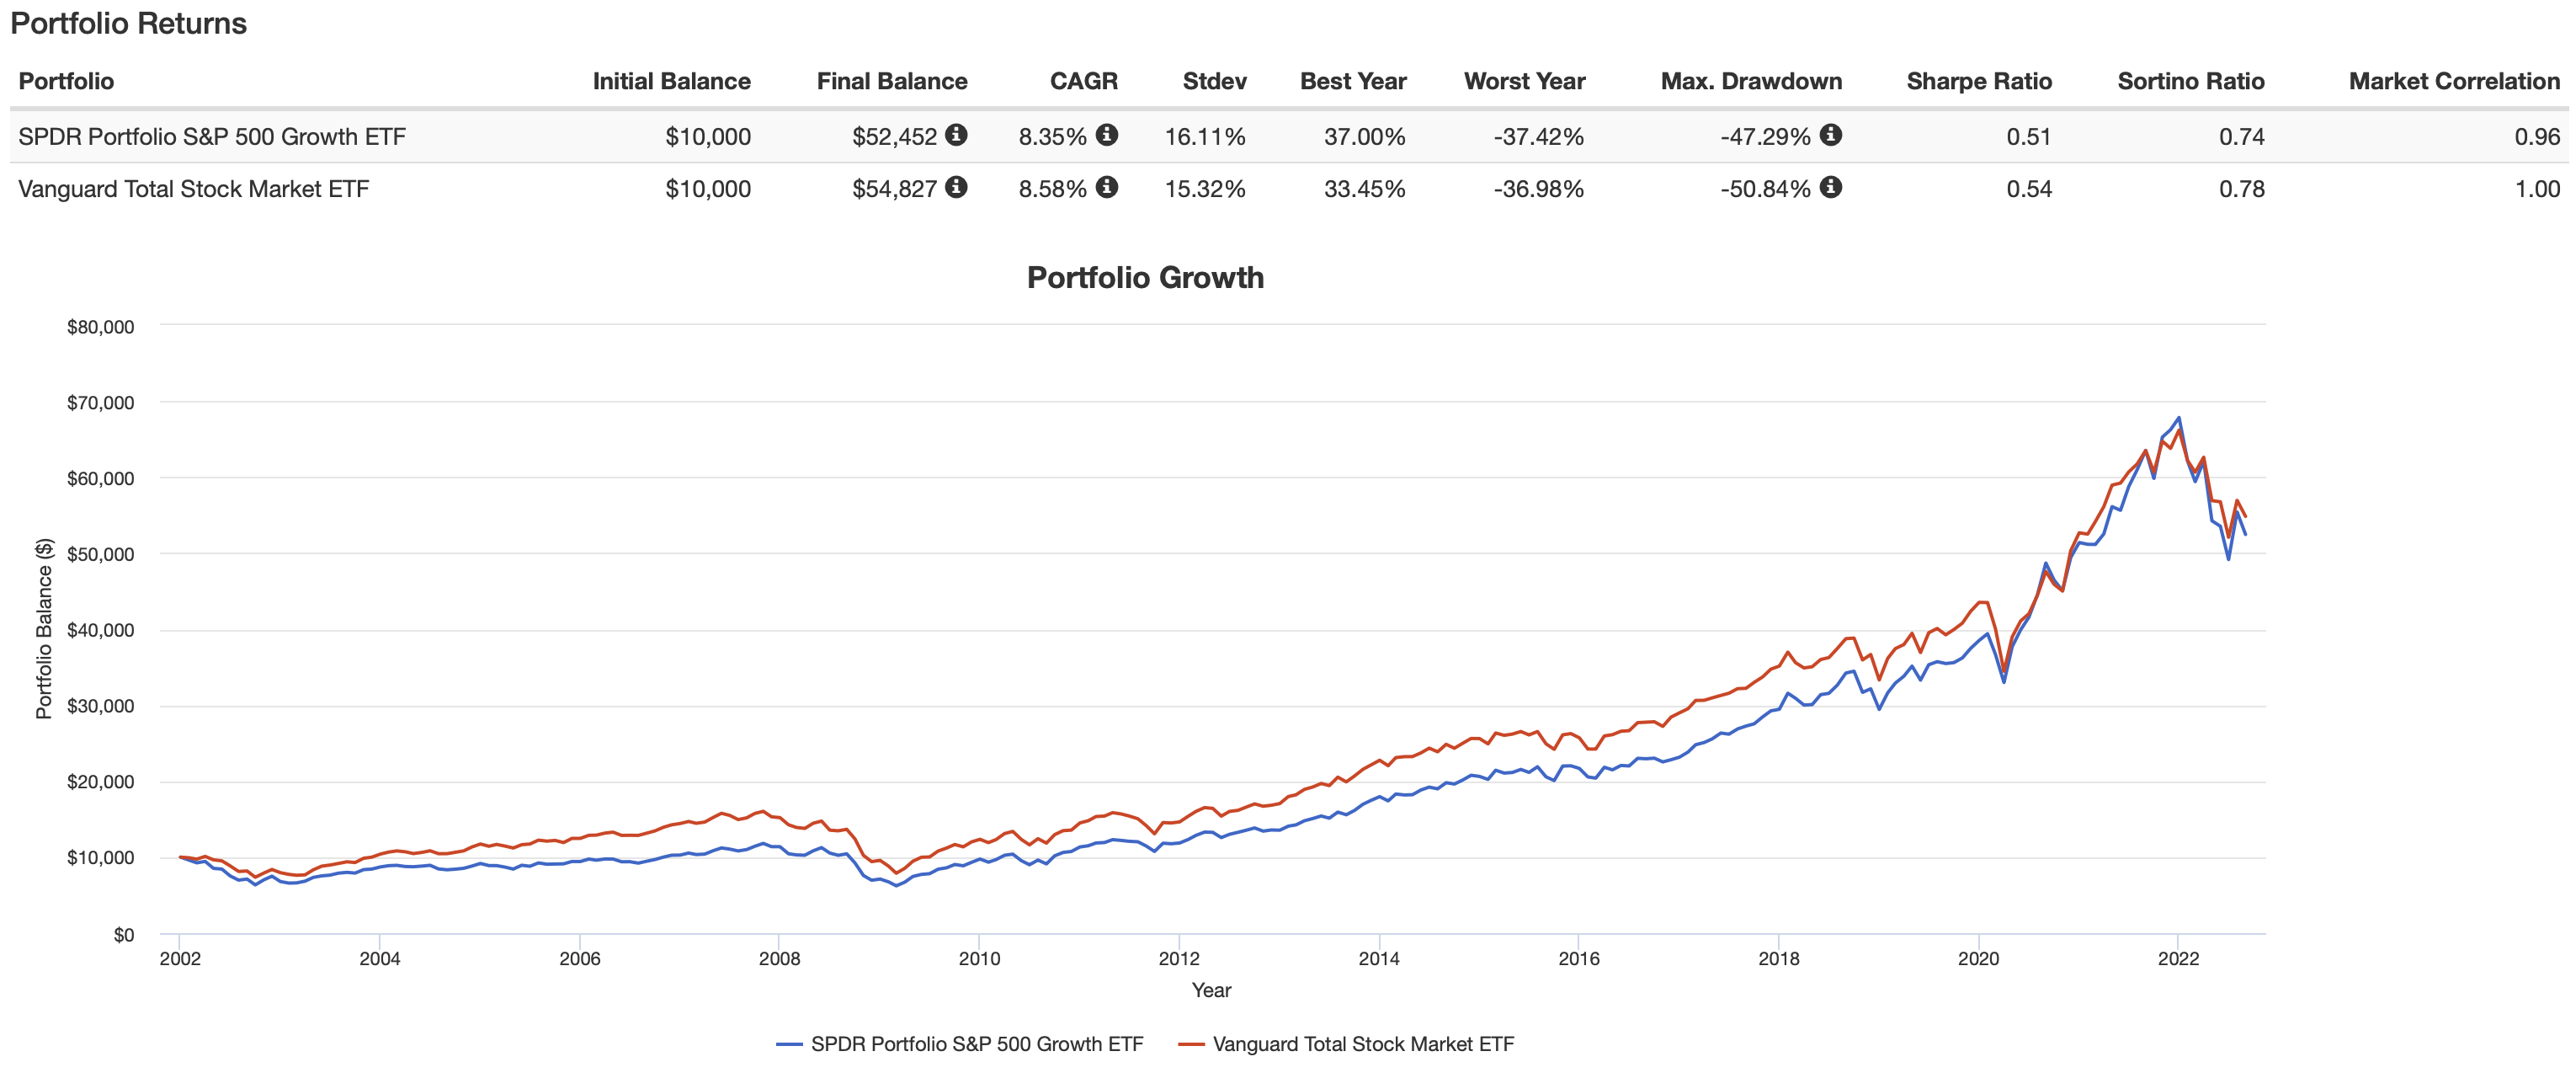
Here are the key items I noted. Over this extended period, VTI returned the better overall risk/reward performance. This is reflected by the lower standard deviation of returns, as well as higher Sharpe and Sortino ratios. VTI did experience a slightly larger drawdown during the Global Financial Crisis of 2007-2009, but that is the only metric in which it underperformed SPYG.
In terms of an income stream, if that is of interest to you, VTI does better here as well.
SPYG vs. VTI: Historical Income (PortfolioVisualizer.com)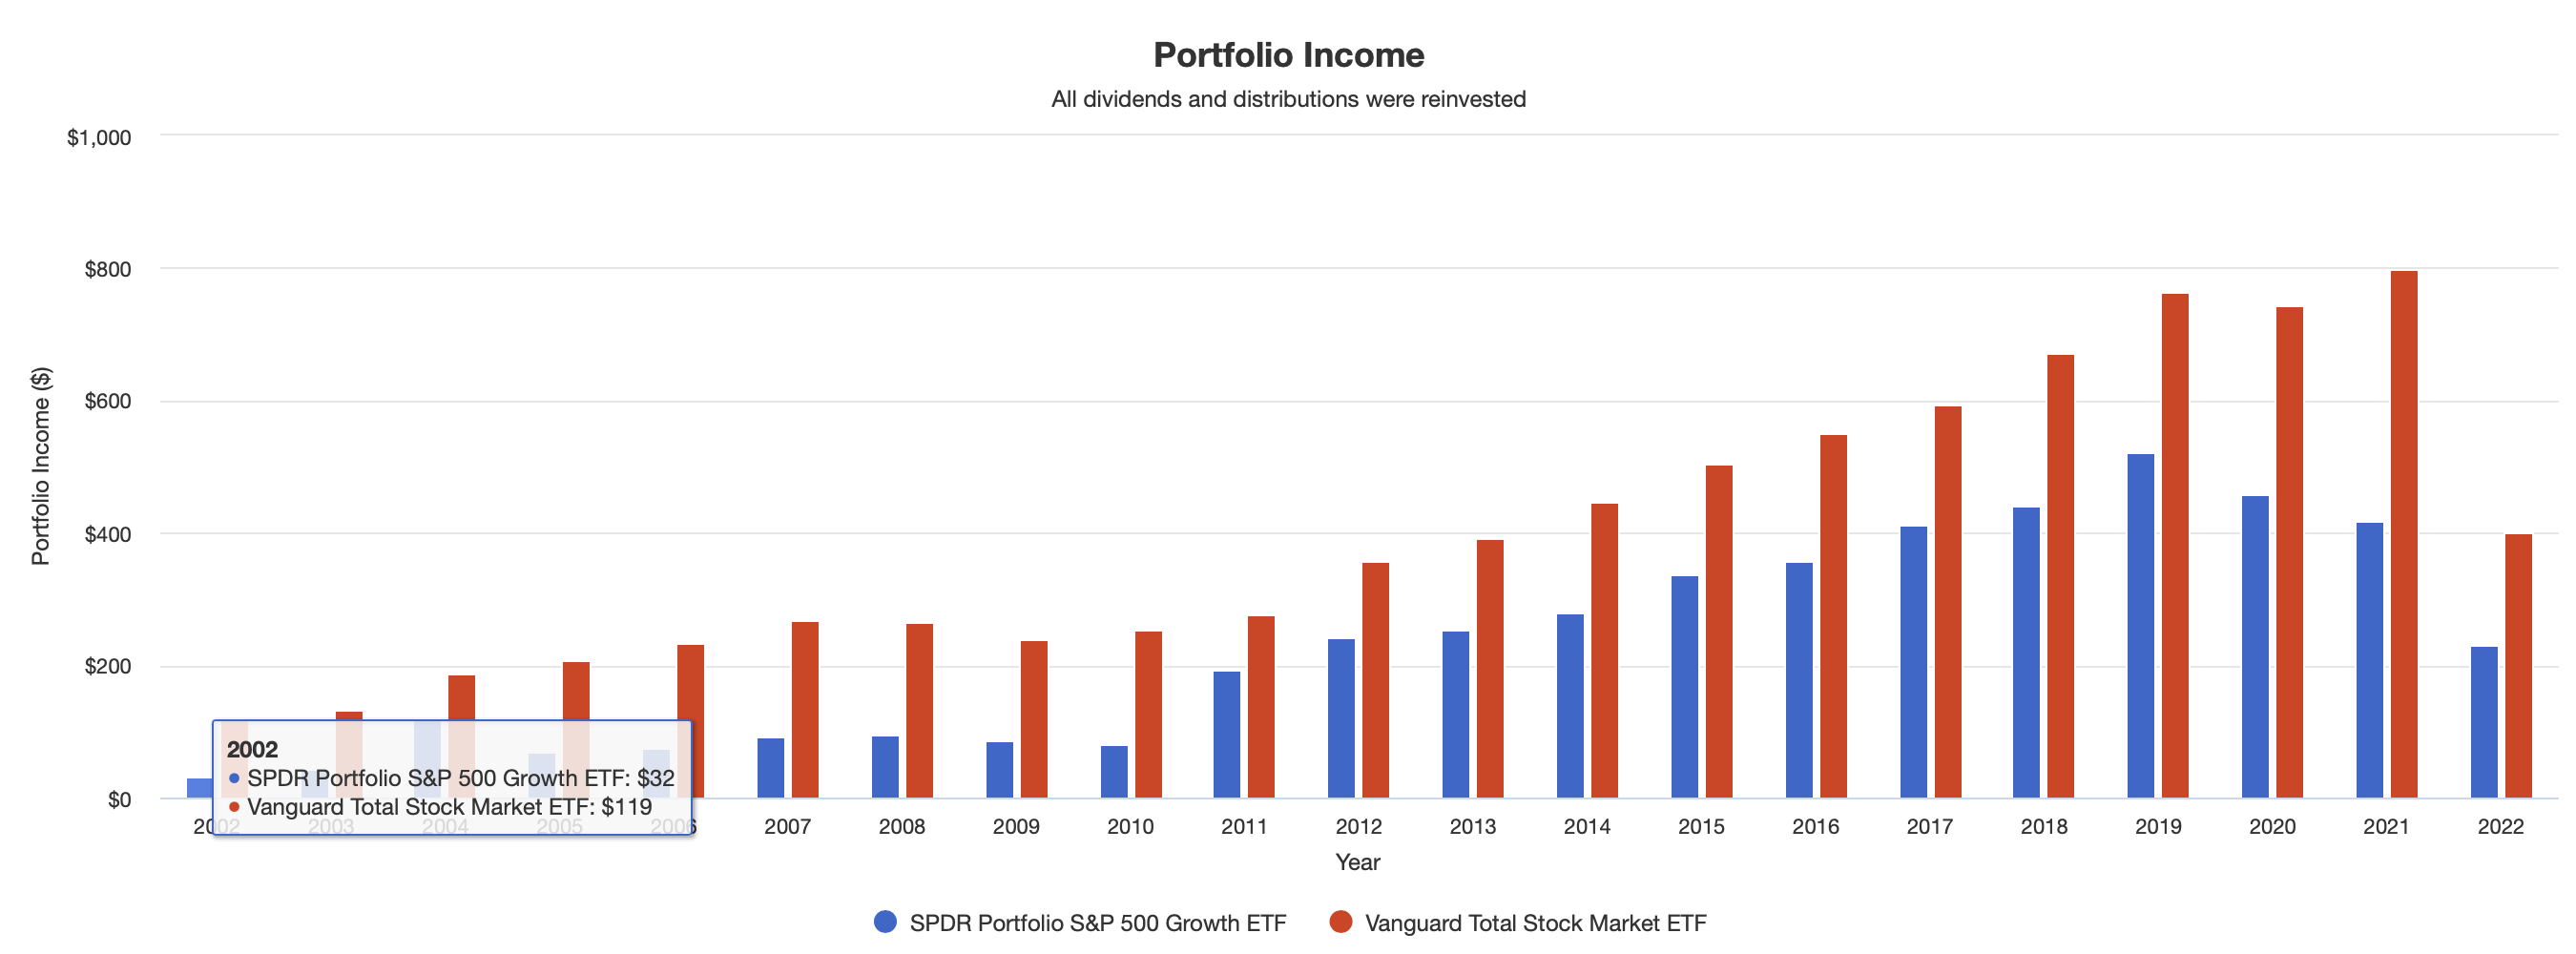
Summary and Conclusion
And with that, we come back to my title. Let’s assume you currently hold VTI in your portfolio. Might there be a play here, in terms of selling some or all of your VTI in favor of SPYG, at least for some period of time?
I might suggest that it comes down to your outlook for SPYG’s three top-weighted holdings. If you believe that they have been unfairly punished in this latest downturn, and you like the idea of an ETF to play that hunch for at least a little short term outperformance, SPYG might be for you.
Me? While I find it intriguing, I’m not so sure I would make any changes in my portfolio. I think I prefer to stand pat with VTI.
Be the first to comment