


Alistair Berg/DigitalVision via Getty Images
Thesis
The Gabelli Dividend & Income Trust (NYSE:GDV) is a closed end fund focused on U.S. equities. The fund has total returns as a primary investment objective and currently offers a 5.31% yield. The fund benchmarks itself versus the S&P 500 (SPY) in its 2021 annual report. GDV does indeed exhibit remarkably robust long term results, which on a total return trailing basis sit at 10.1% and 11.4% for 5- and 10-year lookback periods. Although it has a low dividend yield, unlike other CEFs which overdistribute, GDV exhibits an accretive NAV which has grown at a 5% CAGR in the past decade. The dividend yield and annual NAV CAGR form the ultimate total return that as described above is 10%+, thus bringing this fund closer to an equity ETF rather than a typical very high yielding CEF structure.
The fund has achieved its returns with a good Sharpe ratio of 0.55 on a 5-year lookback and a standard deviation of 19.3. These levels are indeed robust but they are below what we see for the S&P 500, which exhibits a 0.95 Sharpe ratio and a 15.73 standard deviation for the same lookback period. The fund tends to have a discount to NAV that historically fluctuates in the -9% to -11% range, and currently sits at -10.47%.
GDV is a robust long term buy-and-hold vehicle which does not overdistribute. While the fund’s performance is solid, it does not overperform its chosen benchmark, namely the S&P 500 (+194% for GDV vs +293% for the S&P 500). The fund has a hybrid structure for a CEF, namely it looks for total returns through both dividend yield and NAV accretion. We feel this is a good name if you already are a holder and thus rate it a Hold, but for new money in the space we would look for a strong buy signal via a larger than normal discount to NAV to enter the name versus just buying the S&P 500 outright via an ETF.
Debt Structure
The fund has a modest 15.24% leverage ratio which is achieved via preferred share issuance:
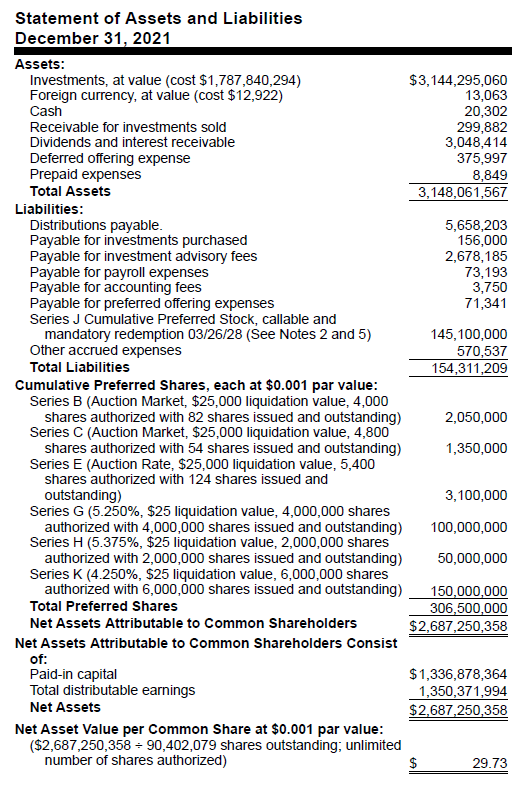
Balance Sheet (Annual Report 2021)
The fund recently re-structured its cost basis via the redemption of the Series G preferred shares which had become callable:

SEC Filing (SEC)
Holdings
The CEF is an equities focused vehicle that falls in the Large Cap / Blended category:
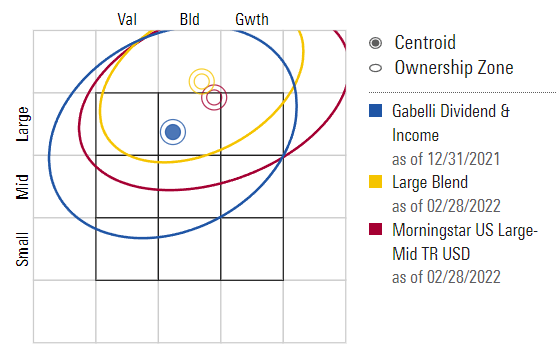
Category (Morningstar)
The fund is very granular with over 500 holdings and is overweight financials:
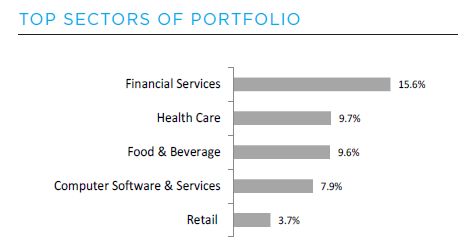
Sectors (Fund Fact Sheet)
The fund’s management team tends to compare the vehicle’s performance versus the S&P 500 in their annual report:
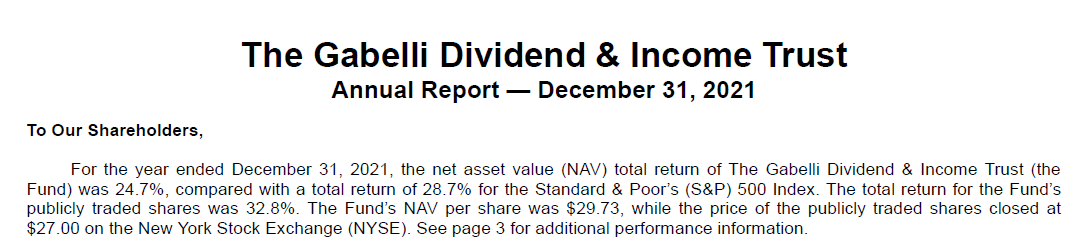
Fund Annual Report Summary (Annual Report)
But the S&P 500 index has a composition which is tilted towards technology:
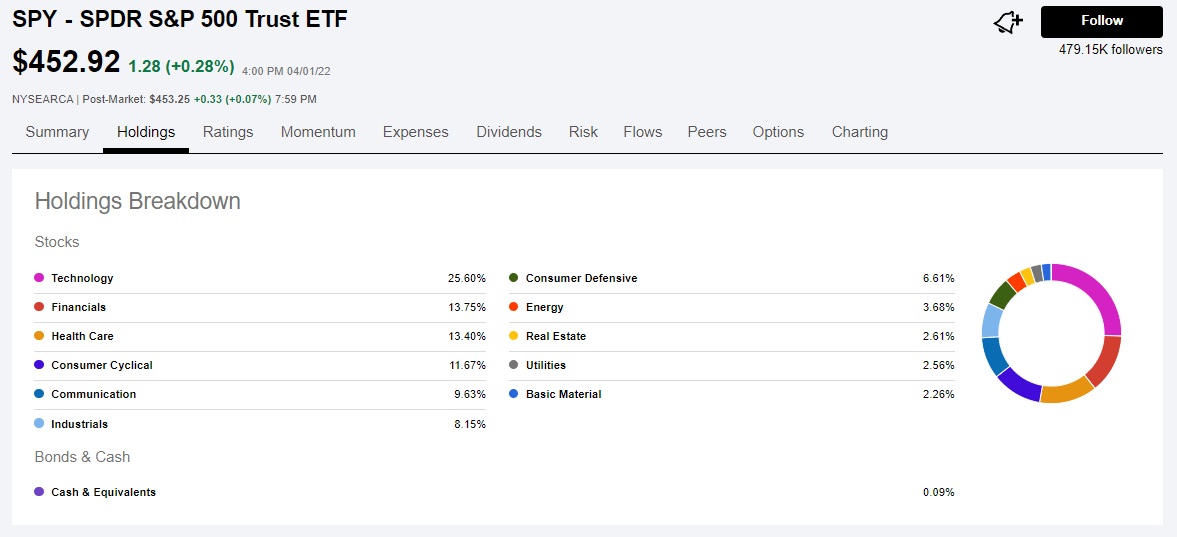
S&P 500 Holdings (Se)
The top ten holdings are a blend of large financial services companies and a few well known tech names:
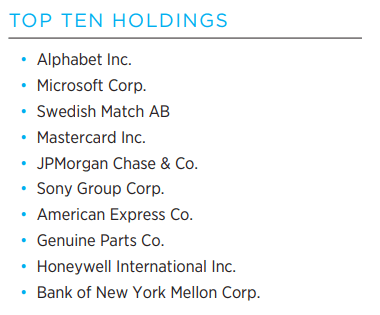
Top 10 Holdings (Fund Fact Sheet)
The fund has a low turnover ratio of 6% which speaks well regarding the management’s team ability to identify undervalued companies and employ a buy-and-hold strategy.
Performance
The fund has a similar performance to the S&P 500 on a year to date basis being modestly down:
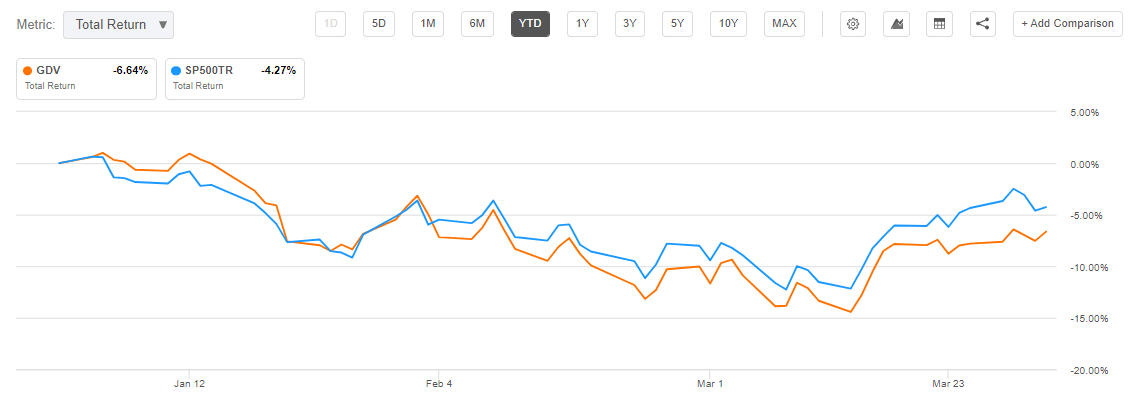
YTD Performance (Seeking Alpha)
On a longer term basis we can see the true buy-and-hold nature of the vehicle through robust upward sloping total returns:
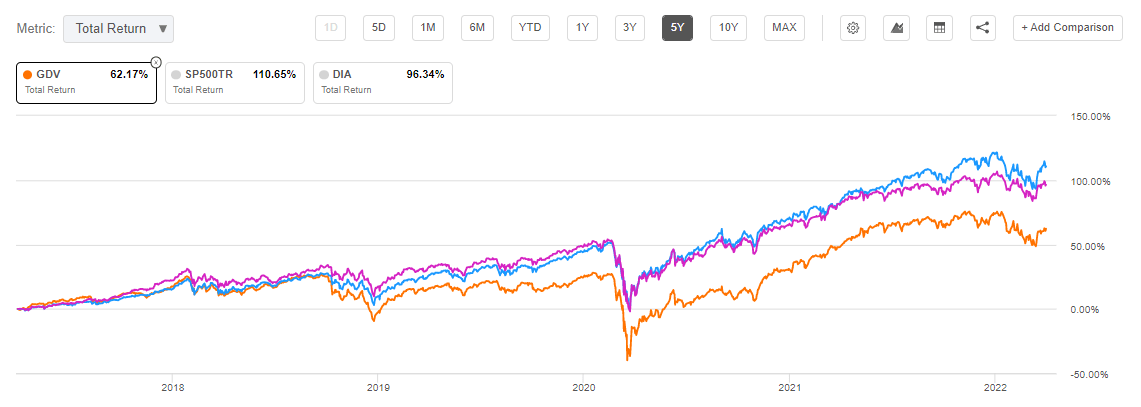
5-Year Total Return (Seeking Alpha)
While the fund has managed to clock impressive long term returns we can see from the above 5-year chart that it nevertheless lags both the S&P 500 and the Dow Jones index on a total return basis. When looking at equity CEFs we would like to see an outperformance of a benchmark index in order to justify the management fees that a vehicle charges.
The 10-year chart paints a similar picture, although the fund had a very similar performance to the indices up to 2018:

10-Year Total Return (Seeking Alpha)
The takeaway here is that the fund is a bit of a hybrid – compared to “typical” CEFs it does not distribute an eye popping dividend and exhibit a constant NAV, while compared to pure equity indices it tends to lag in performance. Ultimately an investor in this vehicle gets equity exposure with an above average (but not aggressive) dividend yield.
Premium / Discount to NAV
The fund tends to have a discount to NAV that historically fluctuates in the -9% to -11% range, and currently sits at -10.47%:
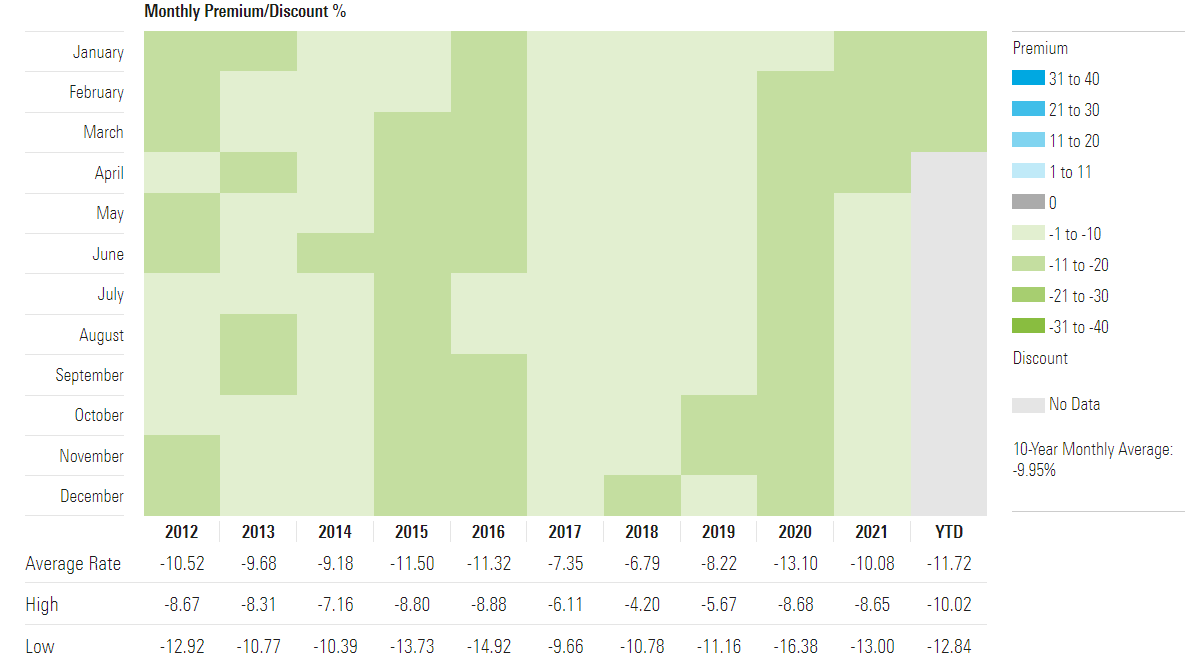
Premium / Discount to NAV (Morningstar)
We can see that in the past decade the fund has always traded at a discount to NAV. Our best guess here is that the market does not see a clear-cut outperformance of an outright index ETF hence the discount it assigns to the fund. As with any other CEF structure the discount fluctuates within a range and distressed periods with a prevailing risk-off sentiment result in higher discounts to NAV. Share repurchases or a fund liquidation are the only ways for the management team to monetize this feature.
Distributions
We like the fact that this fund does not over-distribute and in fact has an accreting NAV. We prefer to see management teams attract AUM via robust long term performances rather than marketing gimmicks that are composed of showing 9%+ unsupported yields via CEF vehicles.
The fund has had a constant $0.11 monthly distribution with a special capital gains distribution that was paid in January 2022:
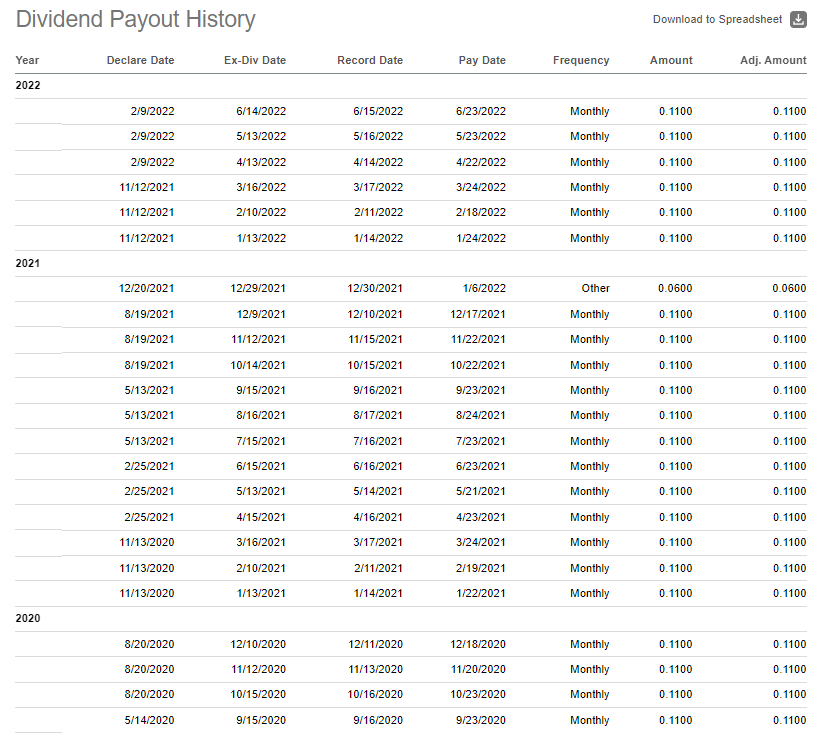
Distribution History (Seeking Alpha)
We expect more of the same from this fund – higher than an outright equity index dividend yields but not a very aggressive stance on distributing capital gains via dividends. Expect a growing NAV as the underlying equities continue to perform.
Conclusion
GDV is an equities focused closed end fund. The vehicle is very granular with over 500 names in the portfolio. The fund has robust trailing total returns which sit at 10.1% and 11.4% respectively for 5- and 10-year lookback periods and are achieved via both dividend yield and NAV growth. The fund has achieved its returns with a good Sharpe ratio of 0.55 and a standard deviation of 19.3 on a 5-year lookback period, but the analytics are below those exhibited by the S&P 500 ETF SPY. We feel this is a good name if you already are a holder and thus rate it a Hold, but for new money in the space we would look for a strong buy signal via a larger than normal discount to NAV to enter the name versus just buying the S&P 500 outright via an ETF.
Be the first to comment