

ConceptCafe
Investment Summary
Having incurred a loss on our original NeoGenomics, Inc (NASDAQ:NEO) position in FY20, I’ve revisited the investment thesis a number of times since [see previous analyses: here, also here, and in addition here] and found there’s still a lack of flesh to put on the skeleton in the company’s case. Initially I was admittedly enticed by NEO’s growth vision of consolidating a number of oncology diagnostics services under the one roof. NEO had hoped to integrate a suite of clinical and pharmaceutical services into one business model, a move that, if successful, would have seen shares worth ~$67 in my original modelling.
However, since then, the company failed to deliver on a number of measures and from there the headwinds began to pile up [systemic, macro, etc.]. In the last 2 rounds of analysis on the company, I noted the following data points:
- NEO continues to be plagued by profitability headwinds, namely free cash flow (“FCF”) and return on capital.
- The company has yet to convert on its ambition to become a “one-stop shop” for oncology services [key to the original investment thesis].
- A trio of structural, systemic and macroeconomic headwinds have plagued the NEO share price, including the resignation of NEO’s CEO, broad equity selloff and rising benchmark rates.
- The fundamental outlook for NEO currently looks weak in view of the three key risk factors above.
- Discounted valuation multiples are therefore justified.
I’ve revisited the NEO investment thesis once more and found a similar set of characteristics that quash any alpha opportunity. Primarily, corporate value – measured in terms of earnings [historical, expected] and return on capital [ongoing, current] – is difficult to ascertain for NEO given the lack of growth at both levels. Technicals are also unsupportive of any near-term reversal in price action. The following set of charts outline additional dampeners to the NEO investment debate.
Weak earnings growth for NEO
As seen in Exhibit 1, NEO struggled through the pandemic and hasn’t delivered any quarterly growth at the bottom line since FY18. The absolute level of EPS rests at its lowest mark since FY15, with a series of operating losses over the past 2–3 years. In addition, operating income and free cash flow have dwindled with investments in growth initiatives that haven’t pulled through to earnings or cash flows.
Investors are done with rewarding unprofitable names in medtech and diagnostics, and have flocked to positioning against strong bottom-line fundamentals instead. NEO doesn’t hit the mark on this test, instead earnings are weakening into an already weakening economic outlook. Moreover, with yields on long-dated treasuries at multi-year highs, both the cost of capital and the discount rate affecting any of NEO’s future cash flows is now higher and therefore compresses the company’s earnings outlook further.
Exhibit 1. Weakening bottom-line fundamentals into a weakening economic growth outlook with little evidence of a turnaround
Note: All figures in $mm except per share. All calculations made from GAAP earnings with no reconciliations. (Data: HB Insights, NEO SEC Filings)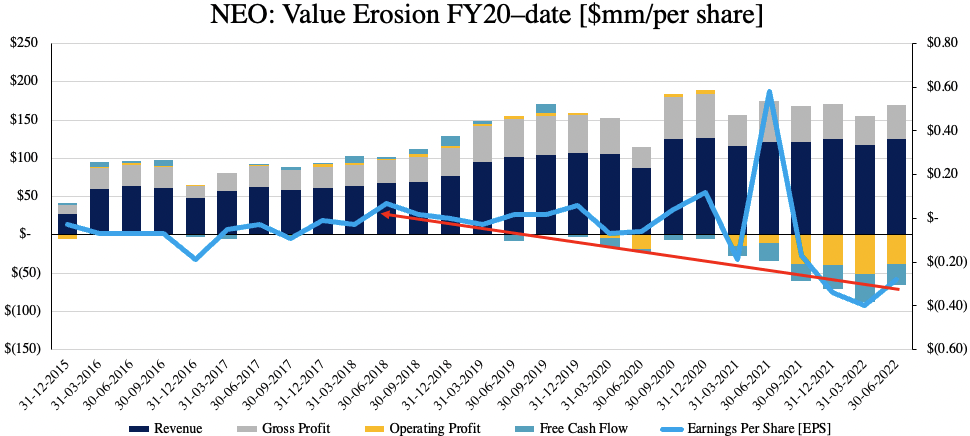
NEO return on capital equally as unsupportive
The second segment of corporate value is the return a company makes on its investments [ongoing, current]. Here I benchmarked NEO’s return on invested capital (“ROIC”), return on assets (“ROA”) and asset turnover to understand its ability to generate and compound cash. Not only does this serve as a good insight into the company’s capital budgeting ability, but I want to see a company generating high return on its investments as a measure of valuation. Specifically, I checked how much NOPAT the company generated on the previous period’s invested capital, and performed similar tests on its asset base.
Moreover, I wanted to see if the company’s declining and negative FCF was actually justified by a high return on investments – this is a preferable setup. As seen in Exhibit 2, there’s been a high correlation in the distribution of NEO’s FCF to its ROIC, ROA asset turnover. Both ROIC and ROA remain at a loss whereas asset turnover has tightened in substantially from 0.52–0.27 in the 12 months to date. Added to this, NEO has printed a cumulative $180mm in quarterly FCF losses from Q1 FY19 to date, and has not seen the return on this ‘spend’ to compensate.
Exhibit 2. Correlation in the distribution of FCF to return on capital, suggesting the FCF wasn’t “spent” adequately, and that there’s no compounding of capital from NEO’s investments.
Note: All figures $mm of [%]. All calculations made from GAAP earnings with no reconciliations. (Data: HB Insights, NEO SEC Filings )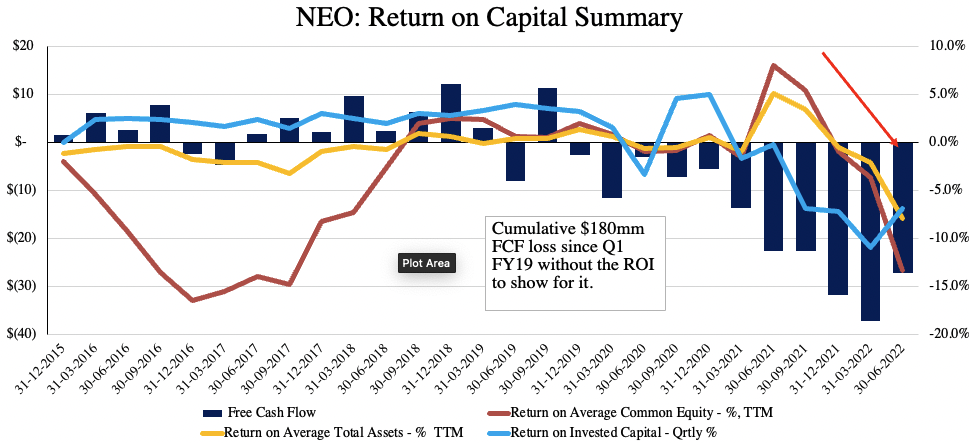
Technical studies unsupportive
I wanted to gauge where the market is at with NEO and what its next moves might be with the stock. As seen in the chart below, price evolution of the NEO share price has skewed to the downside across FY22 following the double top back in January. Drawing the fibs down from this high to the May/June lows shows that NEO has already retraced around 23.6% of the downside move. It drifted back to ~$12.80, where it faced heavy resistance and failed to break through this key zone. Price action has since reverted back to the downside and shares are heading to test the 52-week lows listed above.
In the meantime, long-term trend indicators have seen a gradual uplift following the June bounce in equities. Momentum and on-balance volume in particular have shifted upwards over a longer-time frame, although have plateaued from August–September. With the corresponding downturn in distribution I believe that price action is currently neutral for the NEO share price.
Exhibit 3. Tested and failed 23.5% of the downside move with rejection sending shares back to the downside
Data: HB Insights, Refinitiv Eikon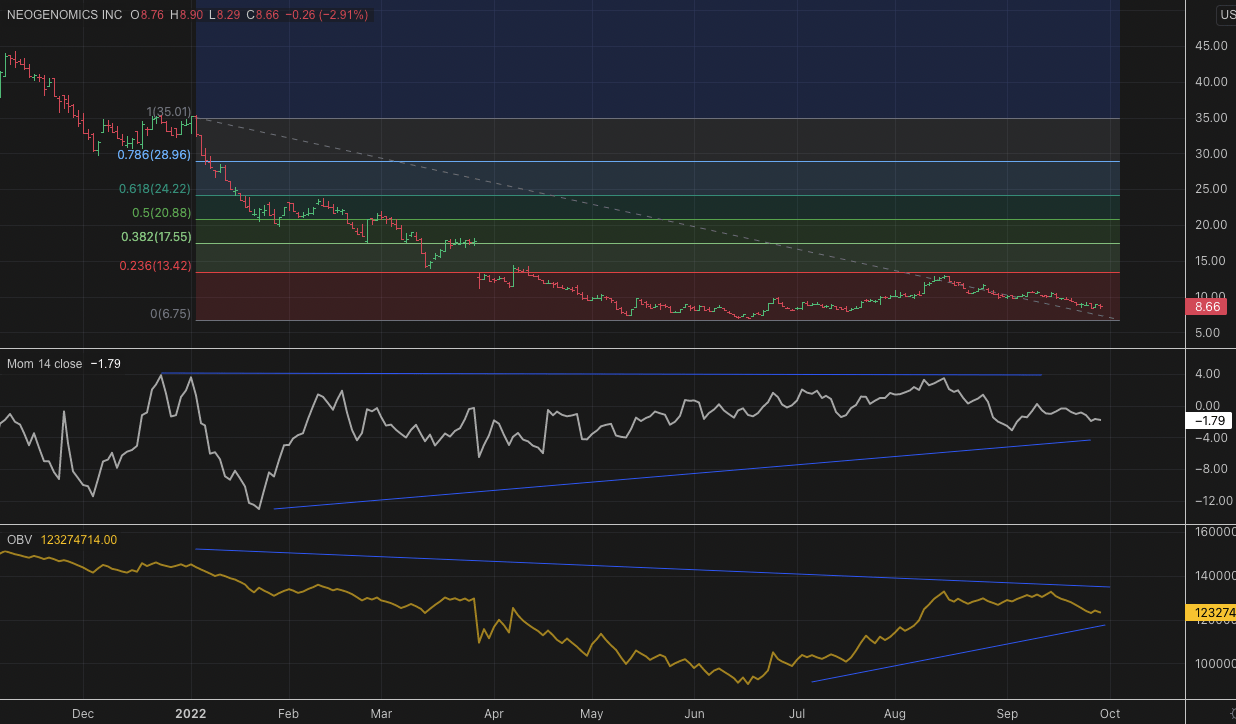
Meanwhile, on a 6-month daily cloud chart, shares are currently trading below cloud support having faced resistance on 3 occasions from July-date. The lag line is currently testing support of the cloud however is trending south, with prices now continuing the latest downtrend. With the above data, this further corroborates neutral price action in the NEO share price by my estimate.
Exhibit 4. Trading below cloud support
Data: HB Insights, Refinitiv Eikon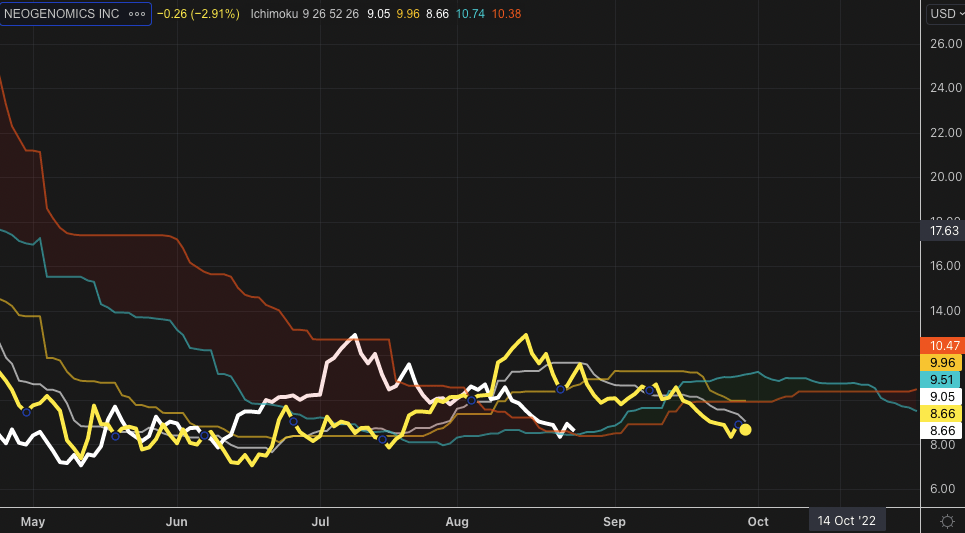
Valuation and conclusion
Shares are trading at a discount to peers and multiples used in this analysis. The lack of earnings and return on investment makes assigning corporate value inherently difficult, and the surging discount rate reduces the predictability of NEO’s future cash flows, and therefore multiples are to suffice right now. As seen below, shares are trading at a discount to book value at 0.98x P/B, and are trading at 2.25x sales. Question is, does the discount represent value of not.
My estimated guess says no, seeing the above points on earnings and ROIC etc., and the fact that more than 53% of NEO’s asset value is assigned to goodwill and intangibles combined, making 91% of shareholder equity value derived from this source. This further supports a neutral view.
Exhibit 5. Multiples and comps analysis
Data: HB Insights, Refinitiv Datastream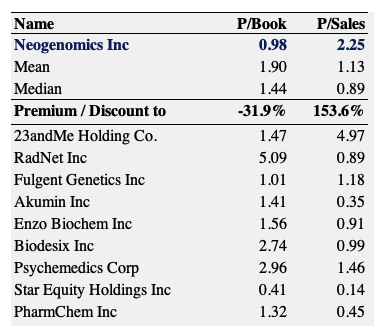
Net-net I’ve retained the hold thesis on NEO. I’m not speculating on directional moves in the market, but NEO is definitely not a buy right now. There are too many unanswered questions and the market punishing NEO with a 75% loss in share price this year is further evidence of the same. There remains a lack of flesh to put on the skeleton as I mentioned, and with valuations equally unsupportive, I continue to rate NEO a hold.
Be the first to comment