

PM Images
How Are SPYG And SPYD Different?
The SPDR Portfolio S&P 500 Growth ETF (NYSEARCA:SPYG) and the SPDR Portfolio S&P 500 High Dividend ETF (NYSEARCA:SPYD), are two passively-managed products that are designed to meet the needs of two different brackets of investors. SPYG is the older of the two ETFs, having been around for more than two decades; during that period, it has managed to accumulate nearly $13bn in AUM. SPYD, on the other hand, was only set up in late 2015 and has since accumulated ~$6bn in AUM.
SPYG is also much broader in scope (offers exposure to 240 stocks) and focuses on the growth-oriented stocks of the S&P500 (SPYG tracks the S&P 500 Growth Index). The growth quotient of a stock is ascertained by using three screeners: a) 3-year sales growth rate, b) 3-year adjusted EPS growth over the share price, and c) 12-month price change in % terms, designed to capture the momentum quotient. Stocks are eventually weighted on the basis of the average standardized value of the three growth screeners. SPYG also comes across as a more stable portfolio, as exemplified by a lowly annual turnover ratio of just 11%. A large part of this is down to the fact that the holdings are only rebalanced once a year, in December.
SPYD is a much smaller portfolio, covering only the top 80 high-yielders within the S&P 500 (SPYD tracks the S&P 500 High Dividend Index). The high-yielding universe is initially crafted on the basis of the indicative annual forward dividend yield, but when it comes to the eventual weighting, all the top 80 stocks are allotted equal weights, so you won’t find any major concentration effect in this portfolio. Just to reiterate, despite covering a much lower number of stocks, six months on, since the last rebalancing date (end of Jan), the top 10 stocks of SPYD only account for 16% of the total portfolio. That’s not quite the case with SPYG where you have some strong concentration effects; even though SPYG covers 240 odd stocks, the top 10 alone accounts for 54% of the portfolio.
SPYD is also a lot more prone to churn (an annual turnover ratio of almost 40%) and unlike SPYG which only rebalances its portfolio once a year, SPYD does this at the end of every July and January In a little over a week’s time, SPYD’s portfolio could look a lot different from what it looks like now.
Being passively managed vehicles, the cost angle of both products is very compelling, but SPYG has a slight edge (expense ratio of 0.04% vs 0.07% for SPYD).
How Have SPYG And SPYD Performed?
To get a sense of the return differentials, we start from the 21st of October 2015, as that’s when SPYD began trading. As you can see from the image below, from 2015 until mid-2017, there was some rotation for the leadership spot between these two products, but since 2018, there’s only been one clear winner. In effect, from SPYD’s listing date until now, the total return differential has been over 1.8x, in favor of SPYG.
YCharts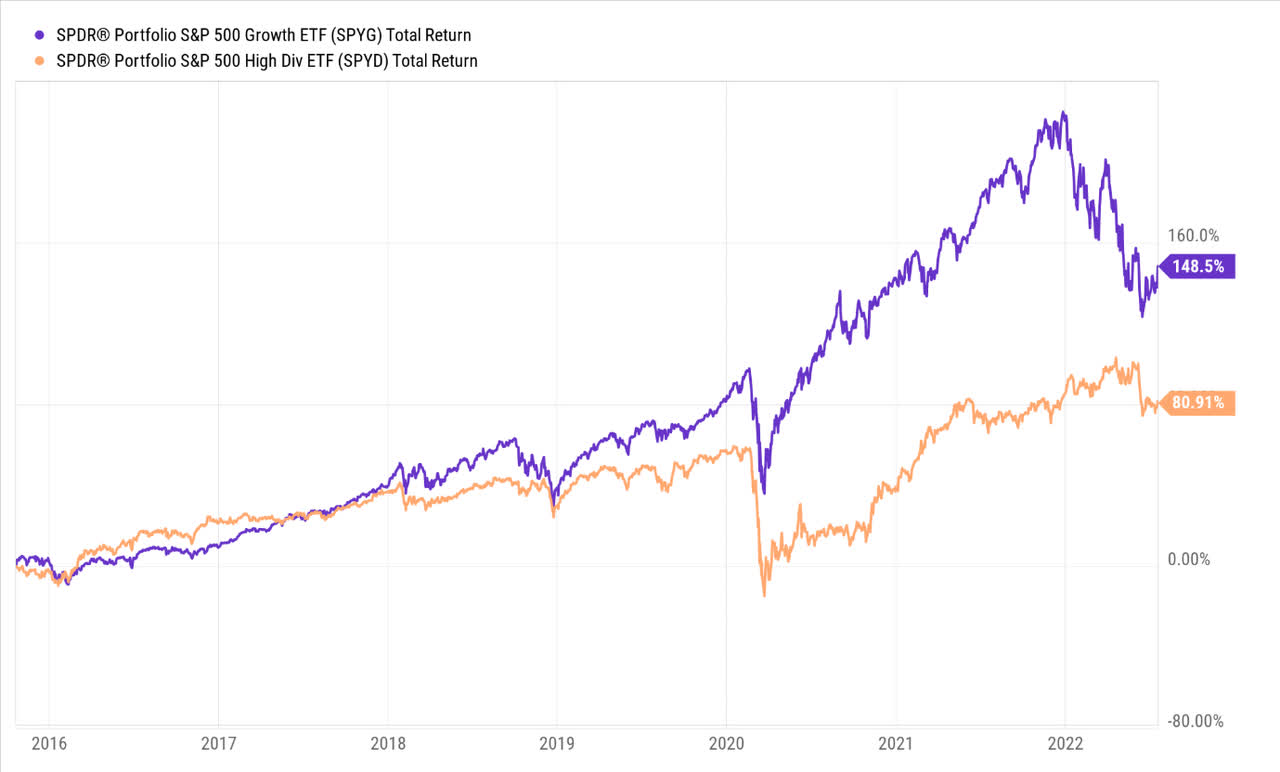
Looking at the absolute returns will only provide a partial picture of SPYG’s superiority; one also needs to get a sense of the quality of returns, and for that, we’ve considered a few risk-adjusted return metrics across a 5-year look-back period, as well as a 3-year look-back period.
YCharts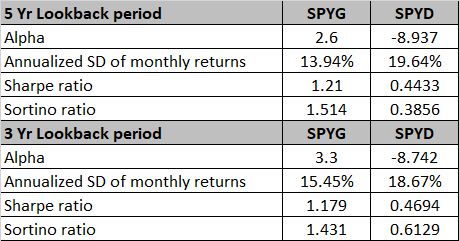
Firstly, not only has SPYD failed to keep pace with SPYG’s alpha numbers, it has actually ended up delivering lower returns than the benchmark across both periods.
What also doesn’t help is that SPYD comes across as a more volatile option, with a much superior annualized standard deviation, although it must be noted that this gap appears to be reducing (the differential was around 570bps over 5 years but only 320bps over a 3-year period).
Nonetheless, the relatively steep standard deviation figures, puts SPYD in a weak spot, and you can see that being reflected in a Sharpe ratio below 1, which is not the case with SPYG; the latter has delivered more than adequate excess returns (over the risk-free rate) that justifies the risk it takes.
We can also see that SPYG is the much better option when faced with harmful volatility, as exemplified by the superior Sortino ratios; interestingly, over the shorter time frame, its Sortino ratio has only continued to improve, even as SPYD’s metric has deteriorated to lowly levels of just 0.39.
Closing Thoughts: Is SPYG Or SPYD The Better Buy?
Growth stocks appeared to have gone out of fashion in 2022, as reflected by SPYG’s double-digit negative returns on a YTD basis (as opposed to only a single-digit decline by the high-yielding SPYD). Nonetheless, I would view the 2022 selling development as a rare opportunity to own a quality portfolio (aka SPYG) at lower levels. Over time, SPYG has demonstrated a strong ability to not only provide quality returns, but also mitigate its volatility effectively, and whilst it may not quite hit the heights of recent years, I don’t see why things should fall off the cliff.
I can appreciate some of the concerns that investors have with growth stocks; for instance, whilst SPYG’s portfolio had previously generated earnings potential within the 50% range, the forward outlook points to a much lower threshold of only 15%. Not only are your earnings likely to be lower, but there are also concerns about the higher benchmark cost of capital used to discount these lower earnings (even as the Fed keeps lifting rates). Yes, I understand that inflation still continues to hover at 40-decade highs, but as noted in my piece on gold, the growing specter of recession risk should force the Fed to reverse course in 2023 and bring down benchmark rates, which would be a great panacea for SPYG’s names. I suspect the market has recently begun to price in this scenario, and this can be reflected in the most recent performance of SPYG, where it is up by 13% in July, even as the SPYD is more or less flat.
YCharts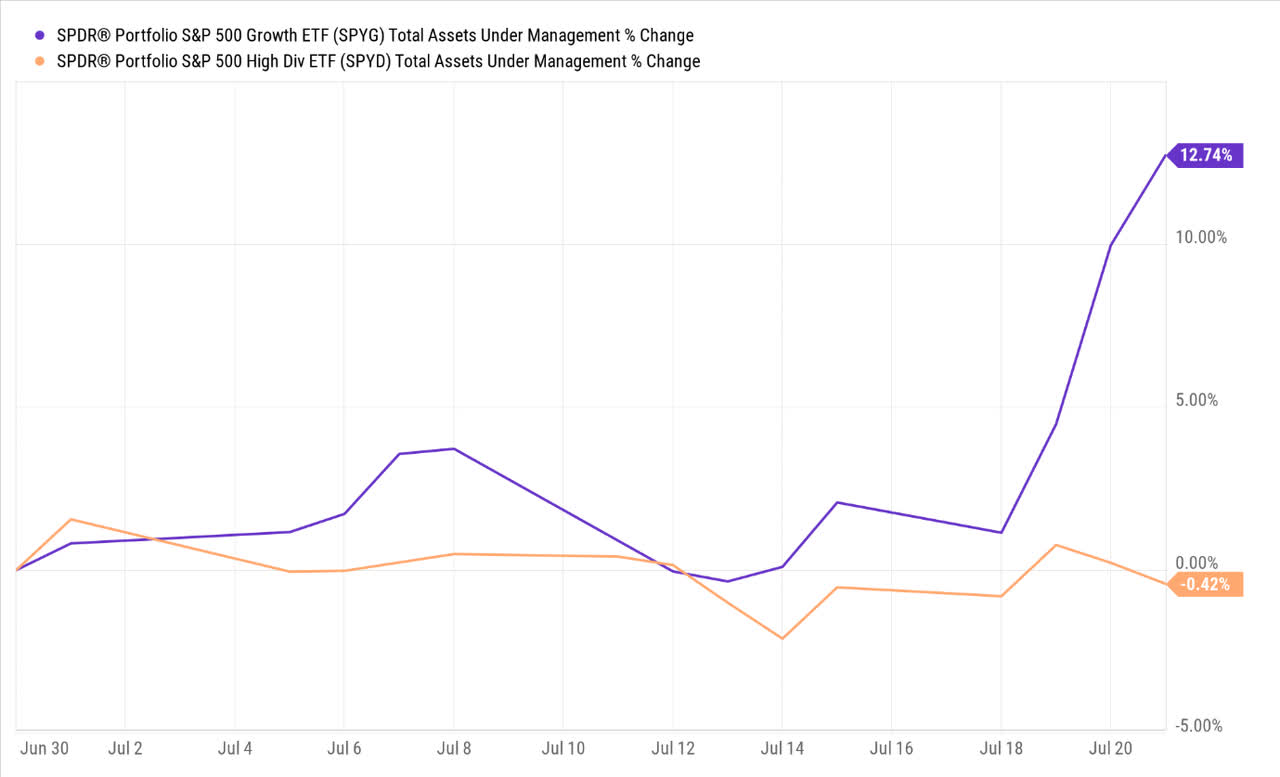
With SPYD, I see limited merit in owning these high yielders, as the level of screening is very unidimensional (strictly limited to the yield), and there are no additional screeners to gauge the sustainability of those dividends or the quality of the fundamentals. Besides, high dividend yielders largely comprise names that have witnessed significant compression in the denominator (share price) rather than any strength in the numerator (strong growth of the annualized dividend). Also consider that SPYD currently yields less than 4%, lower than its 5-year average of 4.57%; the yield angle is the primary driver for owning this ETF, but at current levels, you aren’t getting ample bang for your buck.
YCharts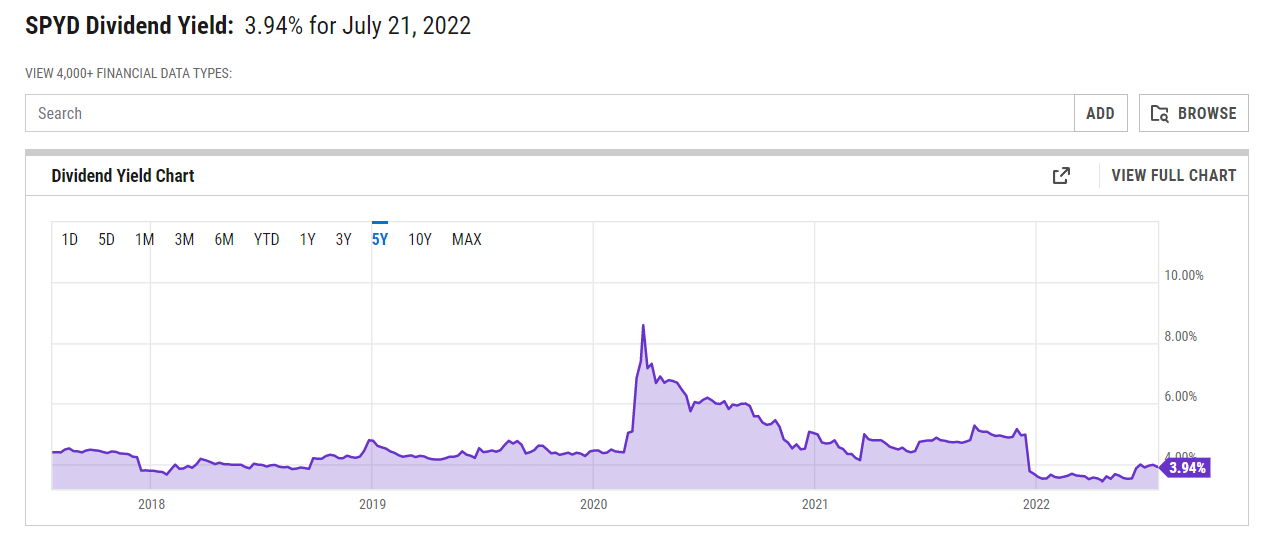
From a technical angle as well, I believe SPYG offers more compelling risk-reward at current levels. Firstly, I want to identify which pocket within the S&P500 (growth or high yielders) offers better rotational opportunities for prospective investors. To get a sense of this, I’ve juxtaposed SPYG and SPYD against SPY. The first chart shows that growth stocks no longer look over-extended to the upside, and are in fact trading closer to the lower boundary of the ascending wedge.
StockCharts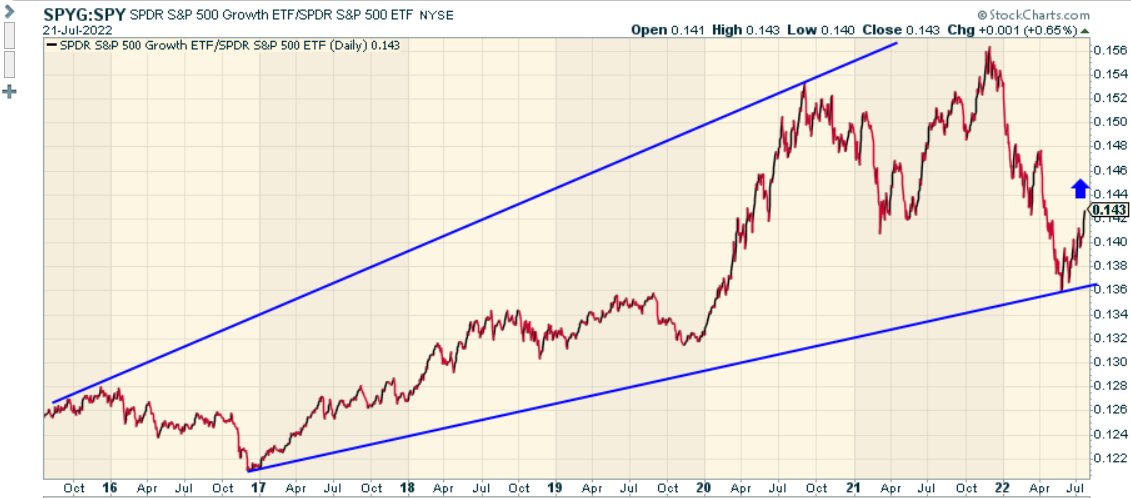
The relative strength chart of SPYD and SPY point to a less compelling risk: reward picture as it trades closer to the upper boundary of its long-term descending wedge.
StockCharts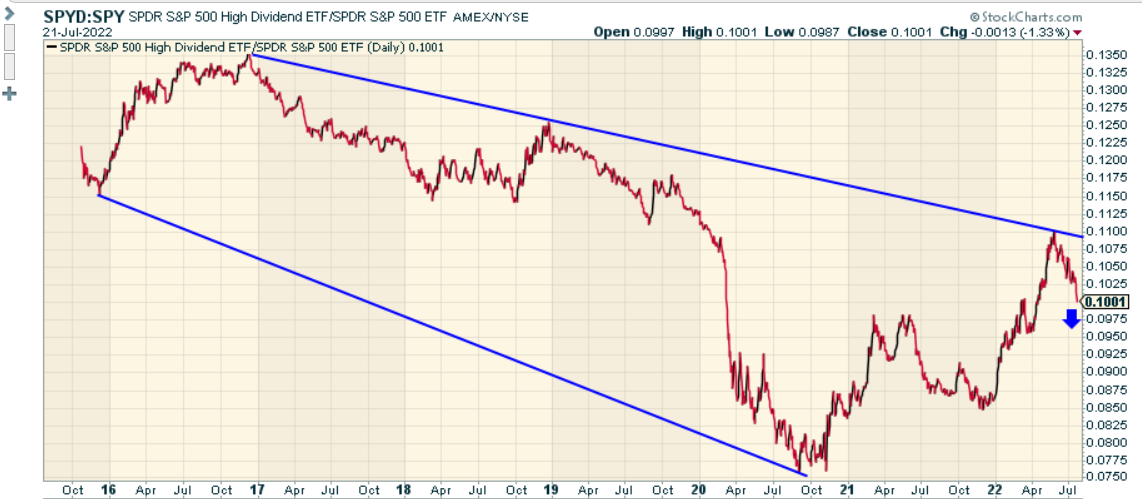
Also, consider the relative strength chart of the two focus ETFs of this article. Based on the trajectory of this ratio since the pandemic, SPYG looks well positioned for the next leg.
StockCharts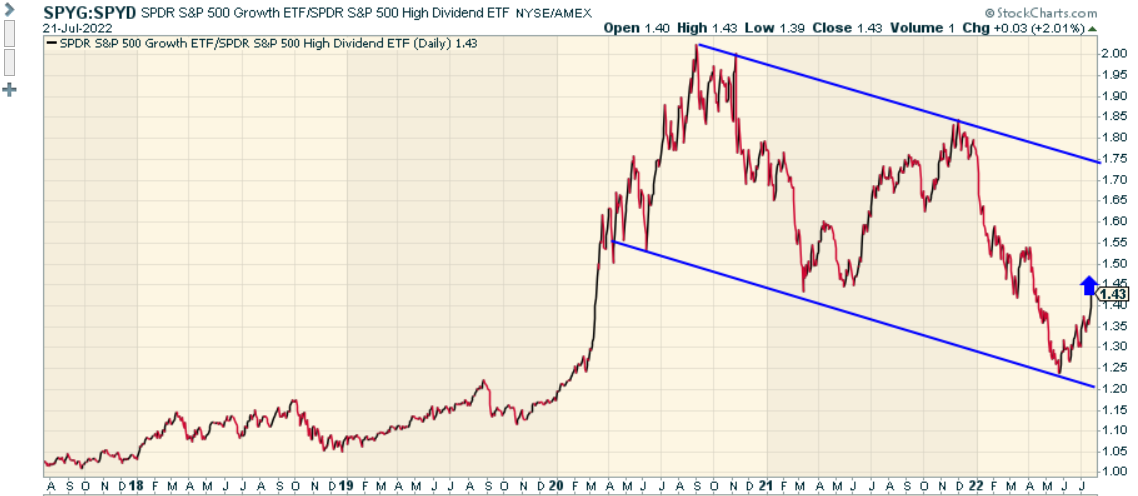
Finally, I’d also touch upon developments across both the standalone charts of SPYG and SPYD.
Investing.com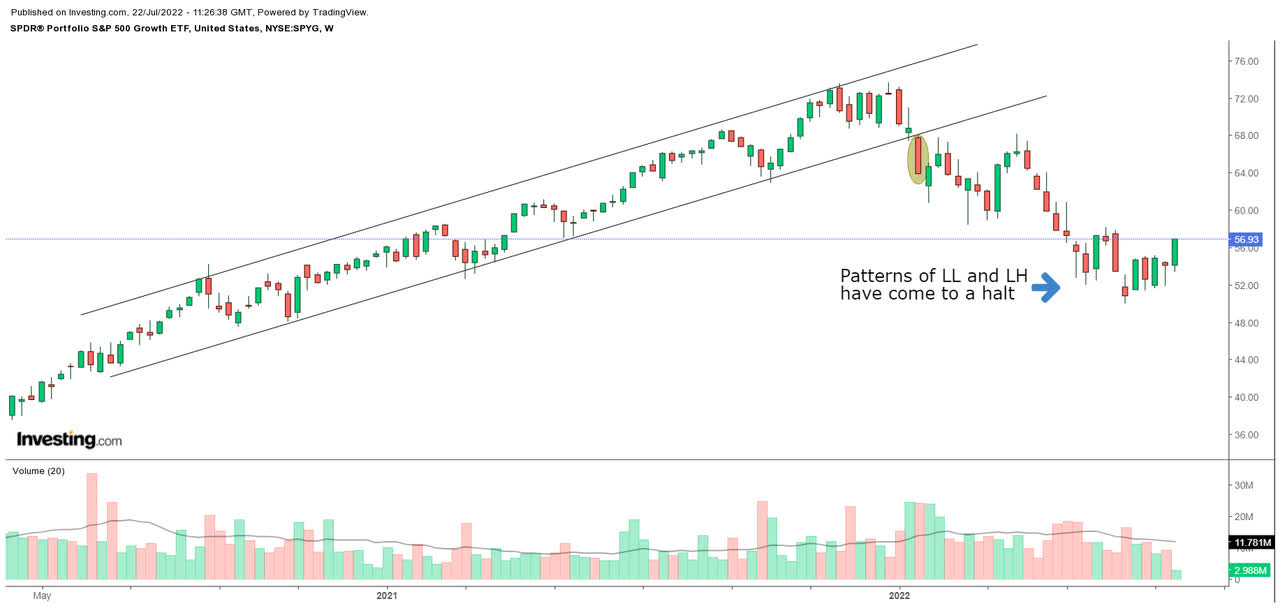
With SPYG, it appears that the worst may be over; we can see that it fell out of its ascending channel in the middle of January, and since then there’s been a series of lower lows and lower highs on the weekly charts, reflecting the bearish momentum. In recent weeks that trend appears to have gone away, as SPYG had built a floor just above the psychological landmark of $50 for a few weeks, before witnessing some bullish momentum this week.
Investing.com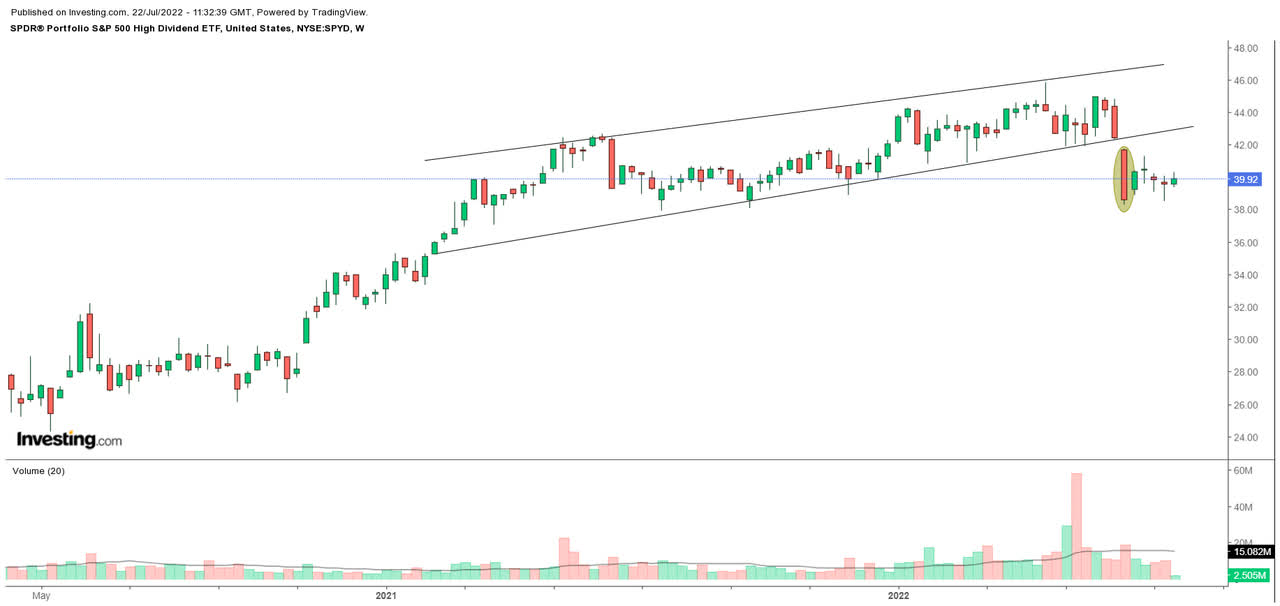
With SPYD, we can see that the breakdown from its channel happened more recently, and after two major red candles in June, the following candles have remained largely unconvincing (largely all small-bodied candles with long wicks). I wouldn’t be inclined to be too bullish following these price patterns.
To conclude, SPYG is the better Buy.
Be the first to comment