

T_o_m_o/iStock Editorial via Getty Images
A couple of weeks back, we promised to “share extracts from our weekly reviews.” This article, taken from an analysis originally published for Macro Trading Factory’s subscribers on Nov. 28, is part of that effort.
——————————————————————————–
Holiday Season ≠ Buying Season
Down 15.5% on Thanksgiving Day, S&P 500 is experiencing the worst start to any year since 2008.
Looking at all the years in the 21st century, you might have some glimmer of hope, however it’s a very small dose (+0.4%) and here’s the bigger problem: The rest of year was negative in 3 out of 7 down years (43%), and in 2 (1) out of 4 (2) down years (50%) with a decline greater than 10% (15.5%).
Carson Investment Reseach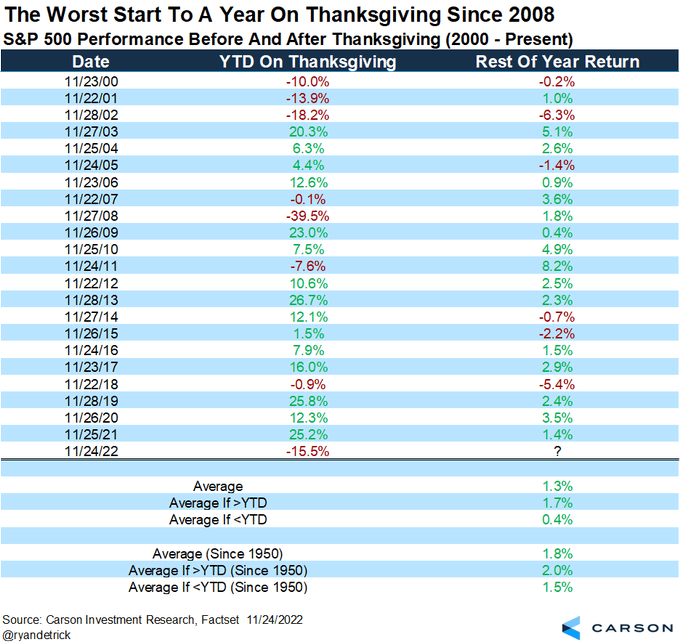
Yet, the SPX has managed to cross the 4000 mark safely, which is an important step. Important, but not a sufficient step for us to turn bullish.
The key task now for the S&P 500 is to deal with the famous downtrend line (that we’ve drawn so many time in recent months) and the 200-DMA.
StockCharts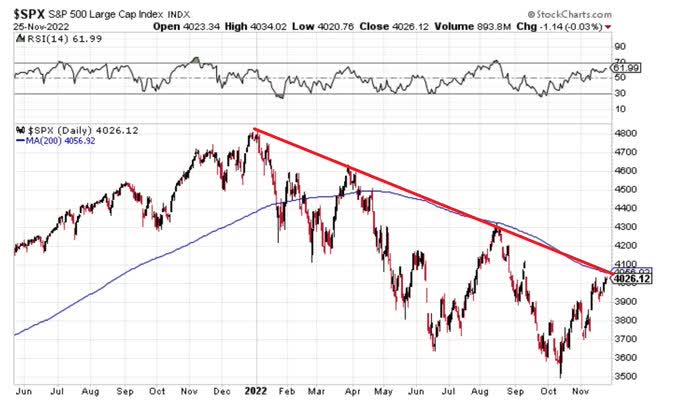
They aren’t far, but they may prove way more persistent than they seem.
And let’s not forget that as much as this may sound weird, the recent aggressive and quick move puts the SPX at overbought territory.
StockCharts
Last but not least (for this technical section), the pattern suggests that we might be looking at a “head and shoulders” formation.
If this is indeed the case, the next big move is down.
derecktrades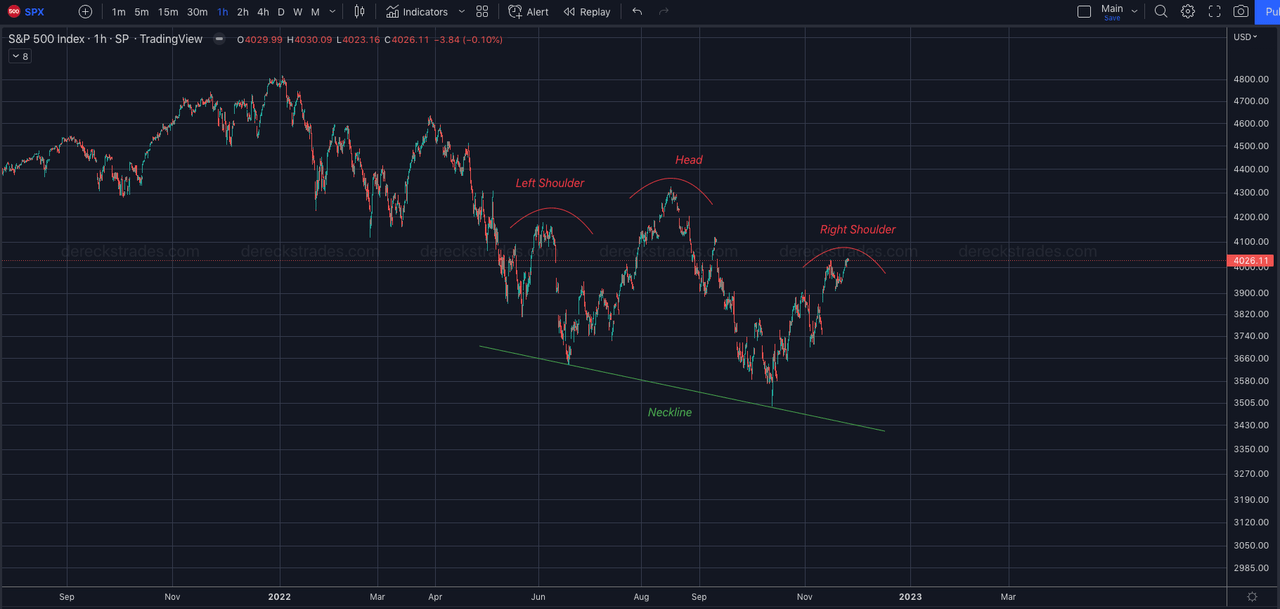
Most (Too?) Extended Stock Market In A Long Time
The Dow Jones Industrial Average (“DJIA”) is now trading 9.1% above its 50-DMA – the most extended level the Index has been at since June 2020 in the early days of the post-COVID bull.
Since 1990, the DJIA has only traded 9%+ above its 50-DMA during only seven other periods.
Bespoke Investment Group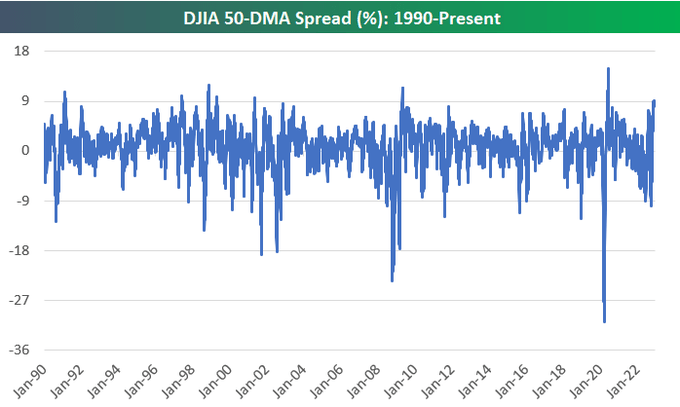
The broader S&P 1500 Index is now trading 13% above its October low, and the median stock in the index is now trading 27% (!) above its 52-week low.
It’s not a bull market for the index itself as of yet (though we’re not too far), but it’s already a bull market for the median stock in the index.
Willie Delwiche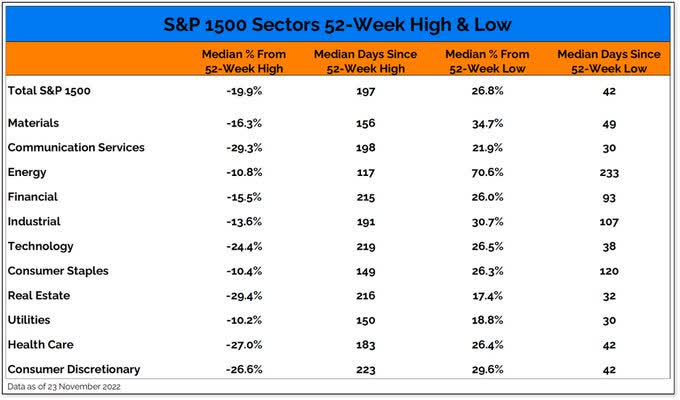
Even the VIX has moved toward the bottom end of its recent range, and that’s not necessarily a good sign.
Here’s a reminder of what we have seen this year:
- When VIX > 28.5 >>> SPX is up 15%
- When VIX < 28.5 >>> SPX is down 25%
Stocks perform best/better when there is extreme fear and/or broad strength. Right now, there is little evidence of either.
All Star charts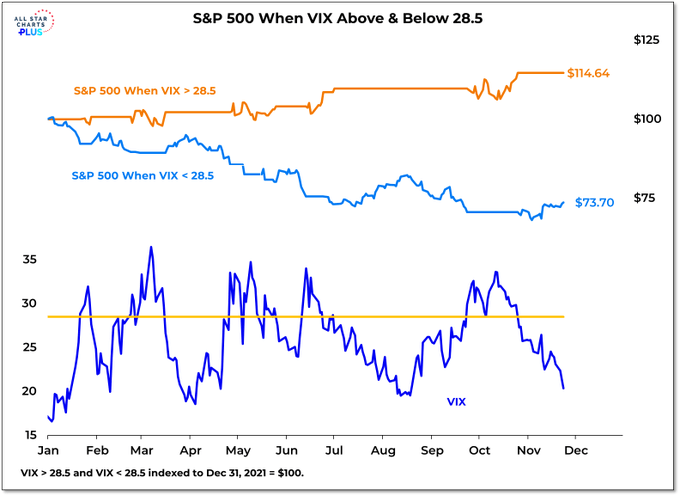
Dividends Make A Big Difference*
[*Especially during rough times]
2022 is a horrible year for both stocks and bonds.
Nonetheless, among over 30 investment styles covered by Goldman Sachs, “Dividend Growth” comes second, only slightly behind “Low Hedge Fund Concentration”, and far ahead of the S&P 500 index (SP500).
Goldman Sachs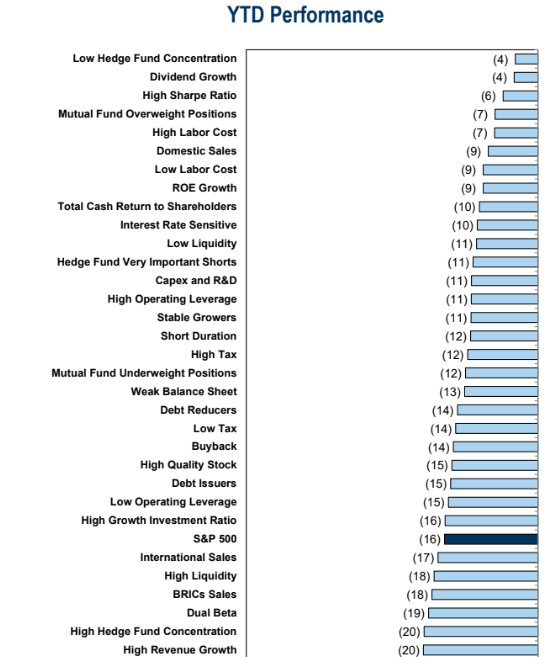
While the S&P 500 most famous tracker (SPY) is down (total return basis) 16.24% YTD, two of the most prominent S&P 500 dividend-oriented ETFs – SPDR Portfolio S&P 500 High Dividend ETF (NYSEARCA:SPYD) and Invesco S&P 500 High Dividend Low Volatility ETF (NYSEARCA:SPHD) – are trading (on average) slightly (+0.33%) above the flatline.
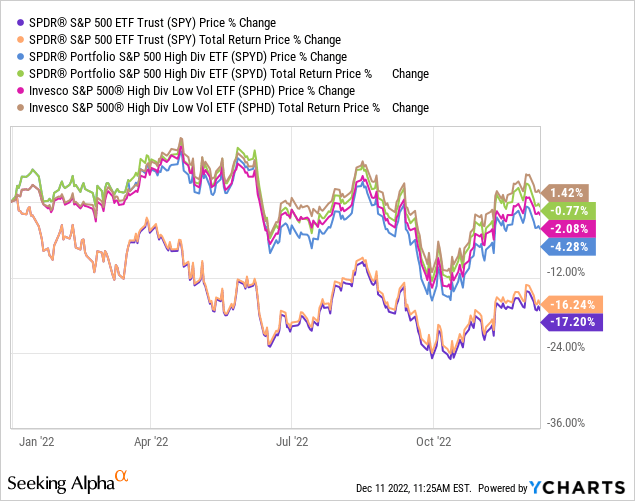
This outperformance of ~16.6% (on average) can’t be described solely by the ~2.5% extra yield (on average) that SPYD and SPHD pay over SPY.
Y-Charts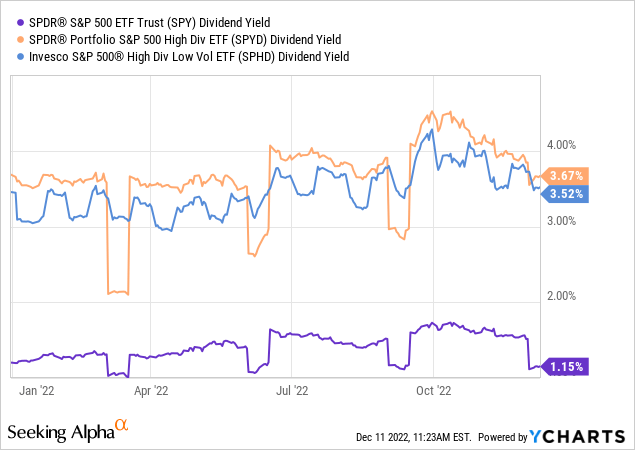
What is it then that makes these ETFs more resilient and better performing?
SPYD Vs. SPHD
The two ETFs are quite similar in nature and holdings. As a matter of fact, there are 46 holdings that appear in both funds (see full list below).
The main difference is the benchmark:
- S&P 500 High Dividend Index for SPYD
- S&P 500 Low Volatility High Dividend Index for SPHD
Here is a comparison between the holdings of the two funds (sorted in alphabetical order):
| Ticker | Name |
SPYD Weight (as of Dec. 8) |
SPHD Weight (as of Dec. 9) |
| ABBV | AbbVie Inc. | 1.404% | 1.774% |
| AMCR | Amcor PLC | 1.239% | 1.721% |
| BBY | Best Buy Co. Inc. | 1.364% | |
| BEN | Franklin Resources Inc. | 1.334% | |
| BXP | Boston Properties Inc. | 0.940% | 1.512% |
| C | Citigroup Inc. | 1.081% | 1.749% |
| CAG | Conagra Brands Inc. | 1.438% | 1.884% |
| CAH | Cardinal Health Inc. | 1.781% | 2.338% |
| CFG | Citizens Financial Group Inc. | 1.338% | |
| CLX | Clorox Co/The | 1.512% | |
| CMA | Comerica Incorporated | 1.050% | |
| CSCO | Cisco Systems Inc | 1.738% | |
| CVX | Chevron Corp | 1.512% | 2.027% |
| D | Dominion Energy Inc | 0.947% | |
| DLR | Digital Realty Trust Inc. | 1.058% | |
| DOW | Dow Inc. | 1.249% | 2.444% |
| DRI | Darden Restaurants Inc. | 1.488% | |
| DUK | Duke Energy Corporation | 1.202% | 1.603% |
| ED | Consolidated Edison Inc. | 1.326% | |
| EIX | Edison International | 1.340% | 2.110% |
| EMN | Eastman Chemical Co | 1.382% | |
| ETR | Entergy Corporation | 1.344% | 1.723% |
| EVRG | Evergy Inc. | 1.211% | 1.528% |
| FE | FirstEnergy Corp. | 1.367% | 2.007% |
| FRT | Federal Realty Investment Trust | 1.318% | 2.139% |
| GILD | Gilead Sciences Inc. | 1.849% | 3.077% |
| HAS | Hasbro Inc | 1.120% | |
| HBAN | Huntington Bancshares Incorporated | 1.411% | |
| HPE | Hewlett Packard Enterprise Co. | 1.486% | |
| IBM | International Business Machines Corporation | 1.448% | 2.435% |
| INTC | Intel Corporation | 0.911% | 1.252% |
| IP | International Paper Company | 1.052% | 1.732% |
| IPG | Interpublic Group of Companies Inc. | 1.370% | |
| IRM | Iron Mountain Inc. | 1.448% | 2.663% |
| IVZ | Invesco Ltd. | 1.359% | |
| KEY | KeyCorp | 1.196% | 1.969% |
| KHC | Kraft Heinz Company | 1.316% | 1.995% |
| KIM | Kimco Realty Corporation | 1.274% | 1.706% |
| KMB | Kimberly-Clark Corporation | 1.298% | 1.598% |
| KMI | Kinder Morgan Inc Class P | 1.265% | 2.928% |
| LNC | Lincoln National Corp | 0.796% | |
| LYB | LyondellBasell Industries NV | 1.181% | |
| MMM | 3M Company | 1.180% | 1.964% |
| MO | Altria Group Inc | 1.366% | 3.240% |
| MS | Morgan Stanley | 1.352% | |
| NEM | Newmont Corporation | 1.152% | 1.519% |
| NRG | NRG Energy Inc. | 1.135% | 1.462% |
| NWL | Newell Brands Inc | 0.828% | |
| O | Realty Income Corporation | 1.128% | 1.762% |
| OGN | Organon & Co. | 1.056% | |
| OKE | ONEOK Inc. | 1.389% | |
| OMC | Omnicom Group Inc | 1.377% | 2.204% |
| PARA | Paramount Global Class B | 0.900% | |
| PEAK | Healthpeak Properties Inc. | 1.196% | 1.999% |
| PEG | Public Service Enterprise Group Inc | 1.254% | 1.506% |
| PFG | Principal Financial Group Inc. | 1.751% | |
| PM | Philip Morris International Inc. | 1.336% | 2.459% |
| PNC | PNC Financial Services Group Inc. | 1.199% | |
| PNW | Pinnacle West Capital Corporation | 1.391% | 2.328% |
| PPL | PPL Corporation | 1.336% | 2.236% |
| PRU | Prudential Financial Inc. | 1.336% | 2.379% |
| PSX | Phillips 66 | 1.499% | |
| REG | Regency Centers Corporation | 1.319% | 1.989% |
| RF | Regions Financial Corporation | 1.342% | |
| SO | Southern Company | 1.199% | 1.618% |
| SPG | Simon Property Group Inc. | 1.419% | |
| STT | State Street Corporation | 1.440% | |
| STX | Seagate Technology Holdings PLC | 0.890% | |
| T | AT&T Inc. | 1.305% | 3.101% |
| TFC | Truist Financial Corporation | 1.098% | 1.615% |
| TROW | T. Rowe Price Group | 1.268% | |
| USB | U.S. Bancorp | 1.147% | 1.649% |
| VFC | V.F. Corporation | 0.759% | |
| VICI | VICI Properties Inc | 1.280% | 2.264% |
| VLO | Valero Energy Corporation | 1.412% | |
| VNO | Vornado Realty Trust | 0.909% | 2.228% |
| VTR | Ventas Inc. | 1.095% | |
| VTRS | Viatris Inc. | 1.442% | |
| VZ | Verizon Communications Inc. | 1.048% | 1.928% |
| WBA | Walgreens Boots Alliance Inc. | 1.329% | 2.405% |
| WHR | Whirlpool Corporation | 1.088% | |
| WMB | Williams Companies Inc. | 1.278% | 2.461% |
| XOM | Exxon Mobil Corporation | 1.506% |
SPYD (79 holdings) is more diversified than SPHD (50 holdings).
While there are 33 names (BBY, BEN, CFG, CMA, D, DLR, DRI, ED, HBAN, HPE, IPG, IVZ, LNC, LYB, MS, NWL, OGN, OKE, PARA, PFG, PNC, PSX, RF, SPG, STT, STX, TROW, VFC, VLO, VTR, VTRS, WHR, XOM) that are part of SPYD’s portfolio but not SPHD’s portfolio, there are only 4 names (CLX, CSCO, EMN, HAS) that are part of SPHD’s portfolio but not SPYD’s portfolio.
If we look at the sector allocation of SPYD vs SPHD, we can see some interesting divergences that explain the slight difference in performance between the two funds but mostly between the two funds to the S&P 500.
Author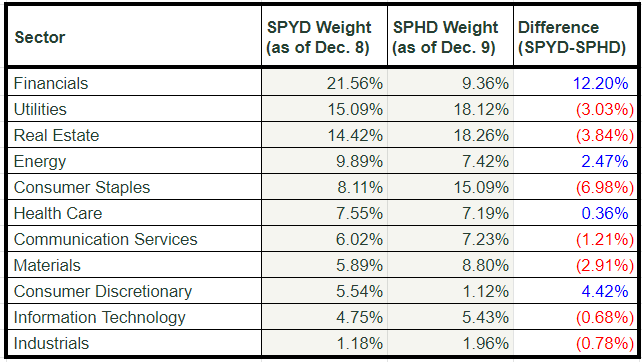
Why has SPHD performed by ~2.2% better YTD than SPYD?
Assuming that the current (sector) exposures (roughly) represent the exposures and differences (between the two funds) along the year, here are the main possible reasons for this outperformance:
- ~10% more exposure to defensive sectors (Consumer Staples, Utilities) that have performed better (or less worse) this year.
- ~4.4% less exposure to Consumer Discretionary (2nd-worst performing sector) that compensate for the ~2.5% lower exposure to Energy (best and only positively performing sector). The math is simple: SPHD saved a loss of ~1.5% on the former and gave up on a potential extra gain of ~1.2% (had it kept the same exposure as SPYD to both sectors throughout the year).
- 12.2% more exposure to Financials (2nd-worst performing sector) that compensate for the 3.84% higher exposure to Real Estate (3rd-worst performing sector). Although the former is far from doing well this year, it’s performing better than the benchmark and therefore – a higher allocation to Financials (in-spite of losing money on it in absolute terms) has played out better in relative terms (compared to the S&P 500).
Charles Schwab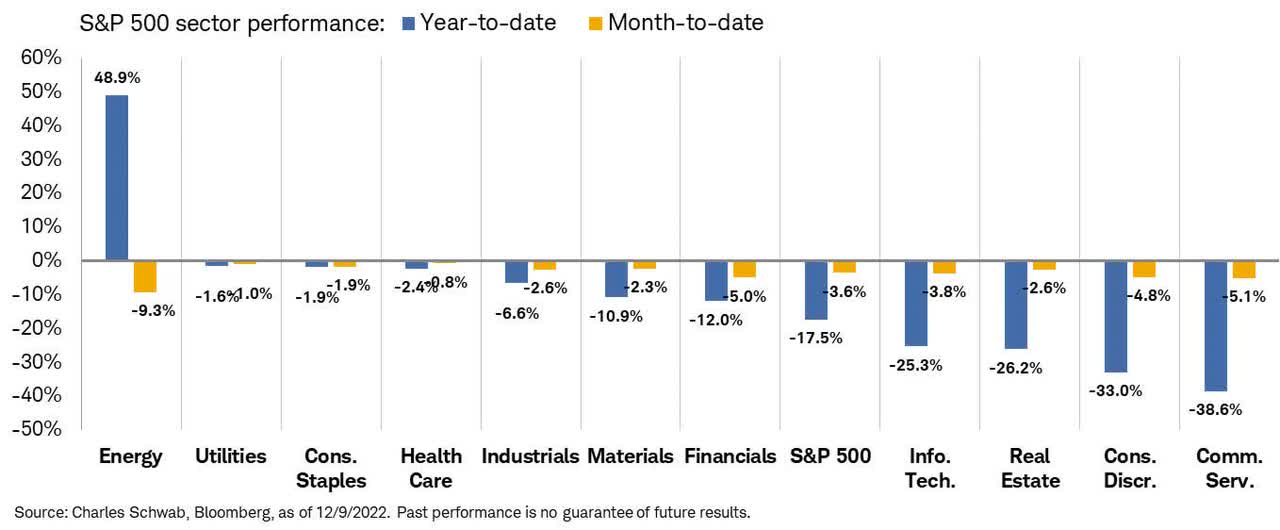
Dividends Provide A [H]edge
All in all, the dividend-oriented funds have performed significantly better than the benchmark – and not only in 2022.
Over the past year, SPYD (+2.4%) and SPHD (+5.6%) have outperformed SPY (-15.2%) by 19.2% on average.
Y-Charts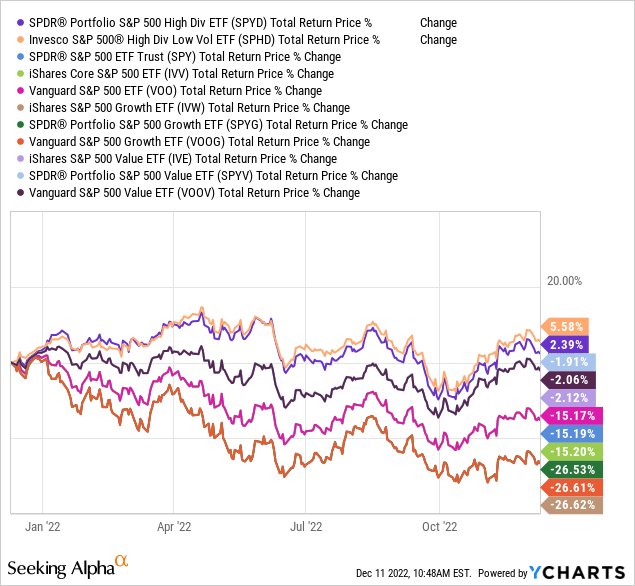
Both funds are also trading closer to their all-time high (total return basis) than the benchmark.
Y-Charts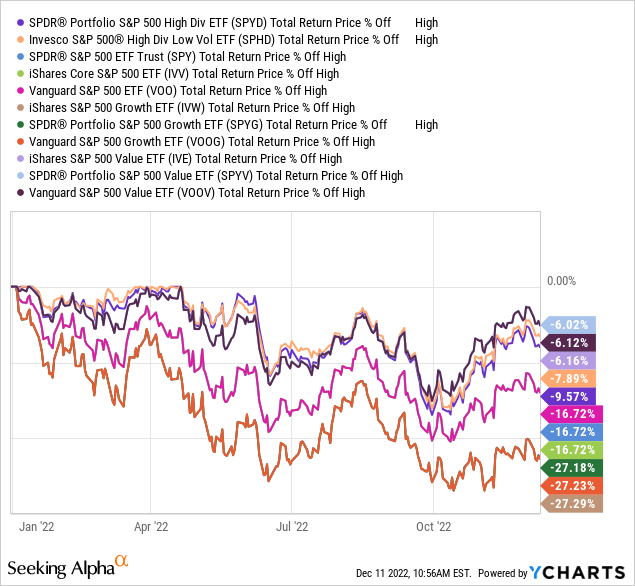
Interestingly, they’re doing so (significant outperformance, smaller drawdown) in-spite of their volatility coming not too far below that of the benchmark.
While SPYD (30-day volatility of 23.23%) is only 2.4% lower than that of SPY (25.63%), SPHD’s volatility is 5.5% (or more than 1/5) lower than that of SPY.
Y-Charts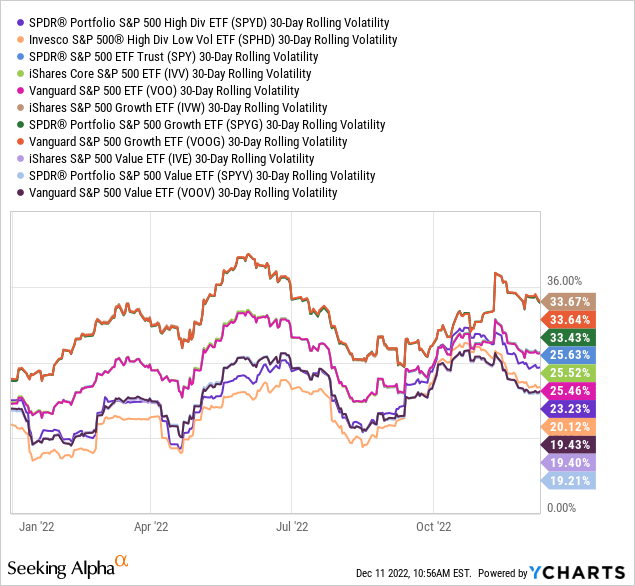
We see that the dividend hedge isn’t a one-off in 2022, and the dividend edge may last longer than one year.
Most shocking (at least to me) is to realize that when we look at data going back to March 23, 2020 (when the markets bottomed following the COVID outbreak), the dividend-oriented ETFs are still coming ahead.
Y-Charts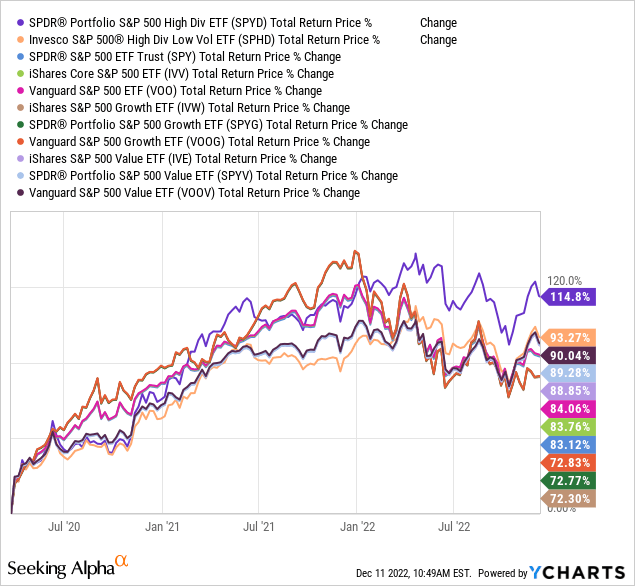
Having said that, we need to be careful drawing a conclusion regarding dividend growth being a better investing style at all times.
Not A One-Off, But…
The cushion (higher total return, lower volatility) allegedly provided by dividends during bad times isn’t guaranteed; neither when we use longer periods nor when we dig deeper into short(er) periods of high volatility.
If we examine the first three months of 2020 closer, we can see that the two dividend oriented ETFs delivered:
- Worse (than benchmark)/Worst (among peer group) total return.
Y-Charts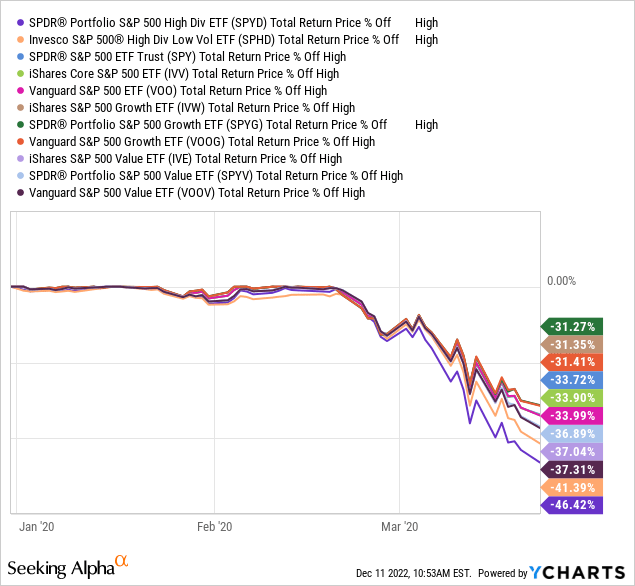
- Worse (than benchmark)/Worst (among peer group) drawdown.
Y-Charts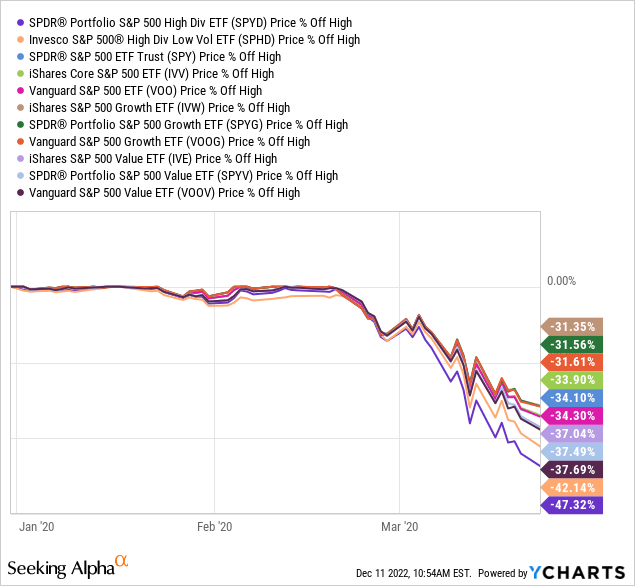
- Worse (than benchmark)/Worst (among peer group) volatility.
Y-Charts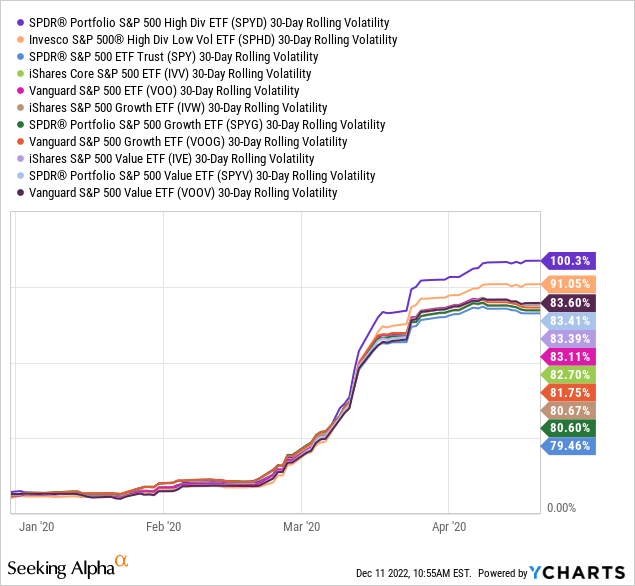
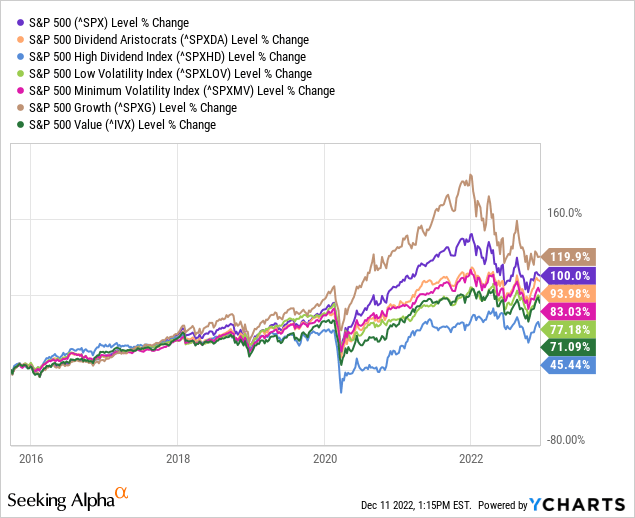
Moreover, when we look at longer periods, it’s hard (perhaps impossible) for income-oriented indices/securities to compete with growth-oriented indices/securities.
The longer the period – the greater the difficulty.
Although the S&P 500 High Dividend Index (SPXHD) is only about 7 years old (thus, we can’t stretch the below chart longer than that), the S&P 500 Index has outperformed the SPYD’s benchmark significantly since its inception.
Plant An Income Garden (Ahead Of 2023)
Regardless of the total return, earning an income out of the portfolio allows the investor to cover living costs and/or fund unexpected expenses without the need to sell positions under pressure.
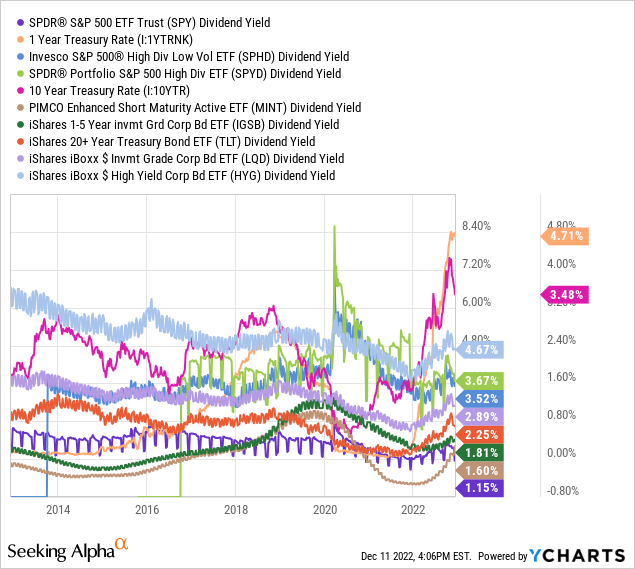
For many years, it has been nearly impossible to earn a decent stream of income out of safe, short-term, solutions, ranging from 1 Year Treasury Rate to ETFs like PIMCO Enhanced Short Maturity Active ETF (MINT) or iShares 1-5 Year Investment Grade Corporate Bond ETF (IGSB).
Even if investors tried using more creative/risky solutions* – the yield was nowhere near sufficient during the vast majority of time.
*Ranging from stock ETFs (e.g. SPY, SPYD, SPHD) to long-duration/corporate/high-yield bond ETF (e.g. iShares 20+ Year Treasury Bond ETF (TLT), iShares iBoxx $ Investment Grade Corporate Bond ETF (LQD), iShares iBoxx $ High Yield Corporate Bond ETF (HYG).
Now, following the quickest tightening in history, things are normalizing, and yet – even now getting yields of 3%-4%, let alone higher than that, isn’t an easy task among traditional, relatively safe, solutions.
Looking at our Rose’s Income Portfolio (“RIG”), the TTM dividend yield is 5%.
SPY’s forward yield (based on the last quarterly distribution) is 1.57%, meaning that RIG is offering ~3.4% more yield than SPY.
Since its inception (Nov. 19, 2021), about 72% of RIG total return is attributed to income and only about 28% to price appreciation.
Macro Trading Factory
Of course, over the past year (+), since RIG’s inception, things weren’t that jolly in the capital markets – neither for stocks, nor for bonds – so there’s some distortion in the data in favor of the income component.
Nonetheless, there’s no distortion whatsoever when it comes to the level of risk taken by RIG compared to that of SPY.
Not only is RIG outperforming SPY by ~19.4% YTD (or ~23.3% since inception), but it’s also doing that while taking significantly lower risk.
How significant is that lower risk? About 40% less risk (Based on comparing the standard deviations of RIG/SPY = 0.94%/1.54%).
Macro Trading Factory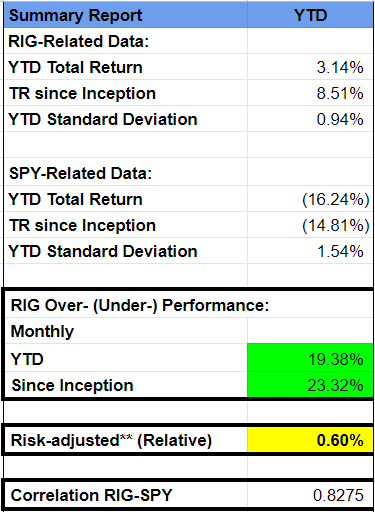
Whether it’s RIG, SPY, or any other instrument of choice – it’s important for investors to generate some sort of an income stream out of their portfolio.
That’s not only helpful in maintaining a healthier income/expenses ratio, but it’s also helpful in reducing the volatility of the portfolio over time.
Over the last couple of years, dividend- and value-oriented investments have outperformed price appreciation- and growth-oriented investments.
Looking at 2023, there’s no reason to assume that this trend is coming to an end.
If anything, we’re only at the early days of what might/should be a long-lasting trend.
FT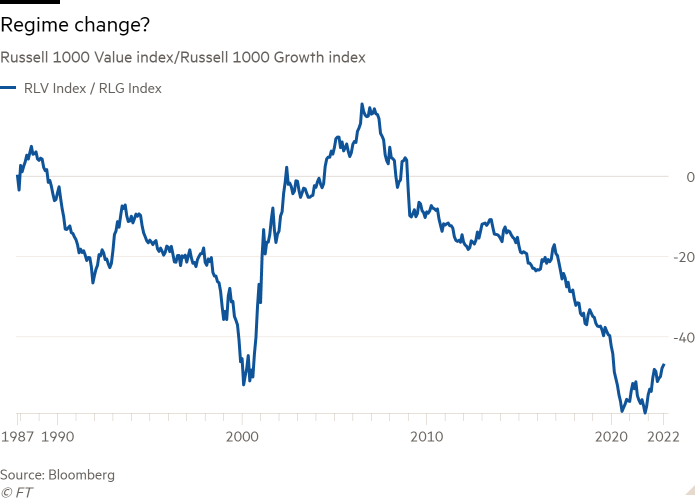
And if that’s true for stocks – it surely is relevant for bonds too, likely more.
Be the first to comment