

sefa ozel
DISCLAIMER: This note is intended for US recipients only and, in particular, is not directed at, nor intended to be relied upon by any UK recipients. Any information or analysis in this note is not an offer to sell or the solicitation of an offer to buy any securities. Nothing in this note is intended to be investment advice and nor should it be relied upon to make investment decisions. Cestrian Capital Research, Inc., its employees, agents or affiliates, including the author of this note, or related persons, may have a position in any stocks, security, or financial instrument referenced in this note. Any opinions, analyses, or probabilities expressed in this note are those of the author as of the note’s date of publication and are subject to change without notice. Companies referenced in this note or their employees or affiliates may be customers of Cestrian Capital Research, Inc. Cestrian Capital Research, Inc. values both its independence and transparency and does not believe that this presents a material potential conflict of interest or impacts the content of its research or publications.
A Message From Outside The Matrix
The journey of the inquisitive investor is a lifelong one. In short trousers you may learn about company fundamentals and the import thereof. Earnings, earnings per share, p/e multiples, all that sort of thing. As you progress you begin to factor macro data into your work. GDP numbers, inflation, rates and blah. If you are not very careful then you begin to ossify in your thinking. You see linear, directive relationships between earnings and stock prices, where only influential relationships exist. You come to expect that if inflation does X, rates will do Y, and stocks will do Z. And most of all you become locked into a way of thinking about a market trend. When it’s going up, it’s going up forever. And when down? Down forever.
None of this is your fault. Your problem-solving conscious brain is looking for a linear equation to solve for making money, in the same way that its prehistoric antecedent learned that there are linear equations for finding shelter and food. (Cavedweller 101: always look both ways out the front of the cave door before heading out, lest a sneaky predator deems you lunch). And your limbic brain, in an opioid haze most of the time, cannot be relied upon since it favors having you run towards the gunfire or away from it in equal measure, and an autonomic shot of the wrong corticosteroid at the wrong time can cause you to become hero or zero without any conscious input on your part.
This is why the best way to read markets is with a big dose of cynicism, a calm demeanor, and an understanding that unless you be J P Morgan himself, most folks are just there to be buffetted this way and that by the market. As far as the major indices go, in their options, futures or ETF clothing, you have in your favor that they are generally too big to fail for very long, that they are highly liquid, and that they are Playground Number One for Big Money who likes nothing better than a game of cat and mouse with Joe P. Retail. And taken together, that all means that the most popular index of all, the S&P 500, can be played using pure sentiment as the gauge. Reality need never feature.
Fortunately you have tools available to model not-reality and you can use those tools to build a more likely outlook for stocks than your common-or-garden earnings forecasts. Technical analysis tools are, of course, simply ways to measure sentiment. You can call them something more scientific if you like, but really all they are trying to do is pattern recognition. Every TA tool says, well, usually when a security moves like this in the past it moves like that in the future. Beyond that, the skill is in the practitioner.
Will The S&P 500 Go Up Now?
Here’s how the S&P 500 – using its proxy ETF, SPY – looks through the lens of a common TA tool, the Elliott Wave and Fibonacci method. Using this tool can help you prepare emotionally and financially for the trend you happen to find the market in. And this can help you prepare for trend reversals – which are the moments when Big Money truly burns small accounts, pausing only to giggle whilst sailing off into the sunset – literally – whilst grasping big chunks of folks’ 401(k)s.
Take a brief look at the chart and then we’ll walk you through it.
SPY Chart (TradingView, Cestrian Analysis)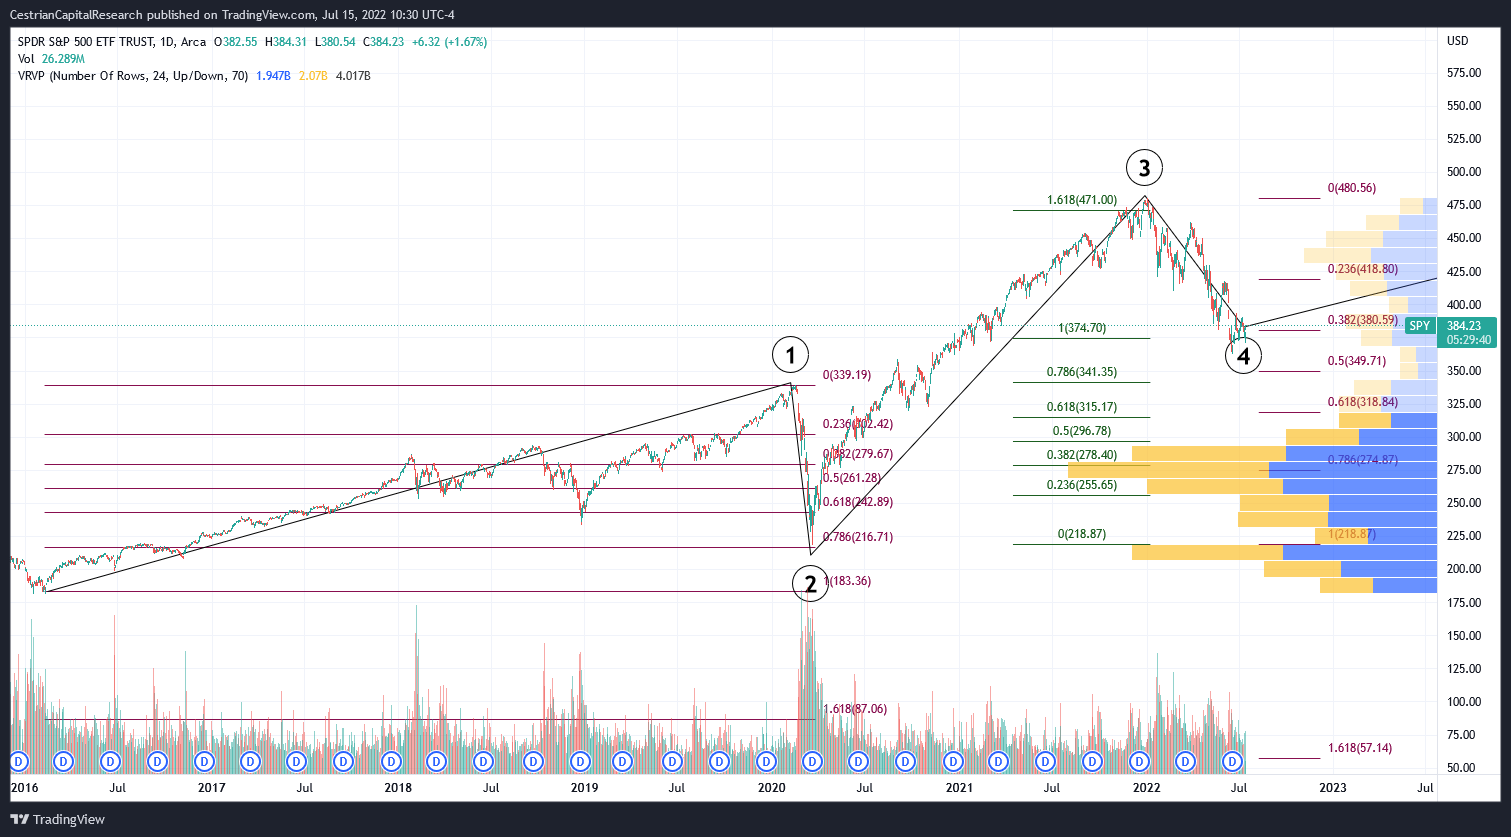
If you were sat in Fibonacci Wave 101 right now (this is a class we will teach one day, but we are only accepting Matrix-dwellers as applicants in order to maximize our own entertainment), and you knew nothing about anything, you had no Twitter, you didn’t know who Bullard, Powell & Co were (maybe a law firm?), you didn’t ever leave your desk to buy anything so you hadn’t noticed inflation?
You would say, well, that’s a textbook stock chart right there. You wouldn’t say, gosh, will this selling ever end? And you wouldn’t have been saying in 2020-2021, why, these pesky kids are crazy with their never-ending YOLO buying. You would just say, huh, fake chart, too perfect with the reversals, show me a real life one and we can talk about it.
But this is a real life chart.
Here goes.
- From the 2016 lows, SPY puts in a Wave 1 up, peaking right before the Covid crash.
- From that Wave 1 high in the $340 zone comes a 0.786 retracement of the Wave 1 up, troughing at around $219. A 0.786 retrace is an important Fibonacci level and it is a textbook Elliott Wave 2 down.
- From the Covid lows we get a Wave 3 up which peaks right around the 1.618 extension of Wave 1, which is to say around $480. Read any Elliott Wave guide and see how long a Wave 3 usually is. Answer, very often indeed they are 1.618x the length of Wave 1. As SPY hit $480 back in Q4 last year we called “Yikes, The Top” in our Growth Investor Pro service, because the index simply could not push up above that 1.618 extension, no matter how many times it tried.
- We then moved into a Wave 4 down, which has so far respected two Fibonacci retracement levels – the 0.236 retrace (around $419) and the 0.382 retrace (around $380). SPY tried to hold $419 as support back in February and March, failed, then treated it as resistance in May and June. The June selloff plunged below the $380 level then pushed up against it as resistance, and the index is currently thinking about whether to turn that level into support.
If, big if, SPY moves up from here, then a reversal at the 0.786 for a Wave 2 low, at the 1.618 for a Wave 3 high, and a 0.382 for the Wave 4 low, is absolute textbook.
Now, knowing these potential reversal levels and knowing which wave you are in can help you train your brain to deal with the situation.
As the limit-down days hit in the Covid crisis you would say, well, this looks like a Wave 2 down, a brutal selloff in no time at all where shock & awe fill the air around the watercooler. Well, that and a poisonous miasma of viral load. As the 0.786 approached you would say, well, it might plunge right past that but there’s a good chance it doesn’t, so I’ll start thinking about buying the index again.
As the 1.618 extension served as resistance on several occasions late last year, you would likely have concluded, well, it really doesn’t want to go much higher – and if you looked at the QQQ and saw that it had put in a 2.618 extension at this time and was putting in a similar headbanging performance – you might have agreed further with yourself.
And into the selloff this year you would have the 0.236 and the 0.382 and the 0.5 (that’s $350 for SPY, plus or minus) in your sights. You would also be saying to yourself, this is a Wave 4. It’s not a Shock and Awe Wave 2. It’s a Slow Bleedout, Controlled Demolition Wave 4. You would say, we had a deep Wave 2 correction so probably Wave 4 won’t be so deep. Probably it will be between the 0.382 and the 0.5 that it reverses.
Well, where we sit right now in SPY is that the ETF has been down to between the 0.382 and the 0.5 retracements, reaching a local low of around $362 in mid-June. And since then it has pushed up above the 0.382 level of $380 and is thinking about holding over that level.
Has The Market Stopped Selling Yet?
Well, the easy answer is, on a textbook larger-degree 5 waves up off of the 2016 lows then the market looks set to reach new highs in a final Wave 5 up. Using that lens, the next move up would top out somewhere above $480 and the market would then make a deep correction – much deeper than we have experienced this year – for some months, maybe more than a year. The logic being the 5 waves up off the 2016 lows would form a large Wave 1 and the subsequent large Wave 2 we could expect to bottom between the 0.618 and 0.786 retracement of that Wave 1 up. That’s somewhere between $250-300 for SPY. So, if this textbook chart pattern continues, you have your levels. Risk on until SPY approaches $480, then start dialing back the risk until SPY rolls over in a convincing fashion, by which time the prudent investor will already have assembled a basket of protective instruments – puts, short index positions, and so on.
Unfortunately we think it’s a little more complicated than that. Sticking purely to chart analysis, and ignoring the whys and wherefores, the counterargument to the above is that the market is simply in a downtrend, and whilst that $380 can surely act as support, it will be merely until SPY hits its head on the resistance defined by that downtrend.
Like this:
SPY Chart II (TradingView, Cestrian Analysis)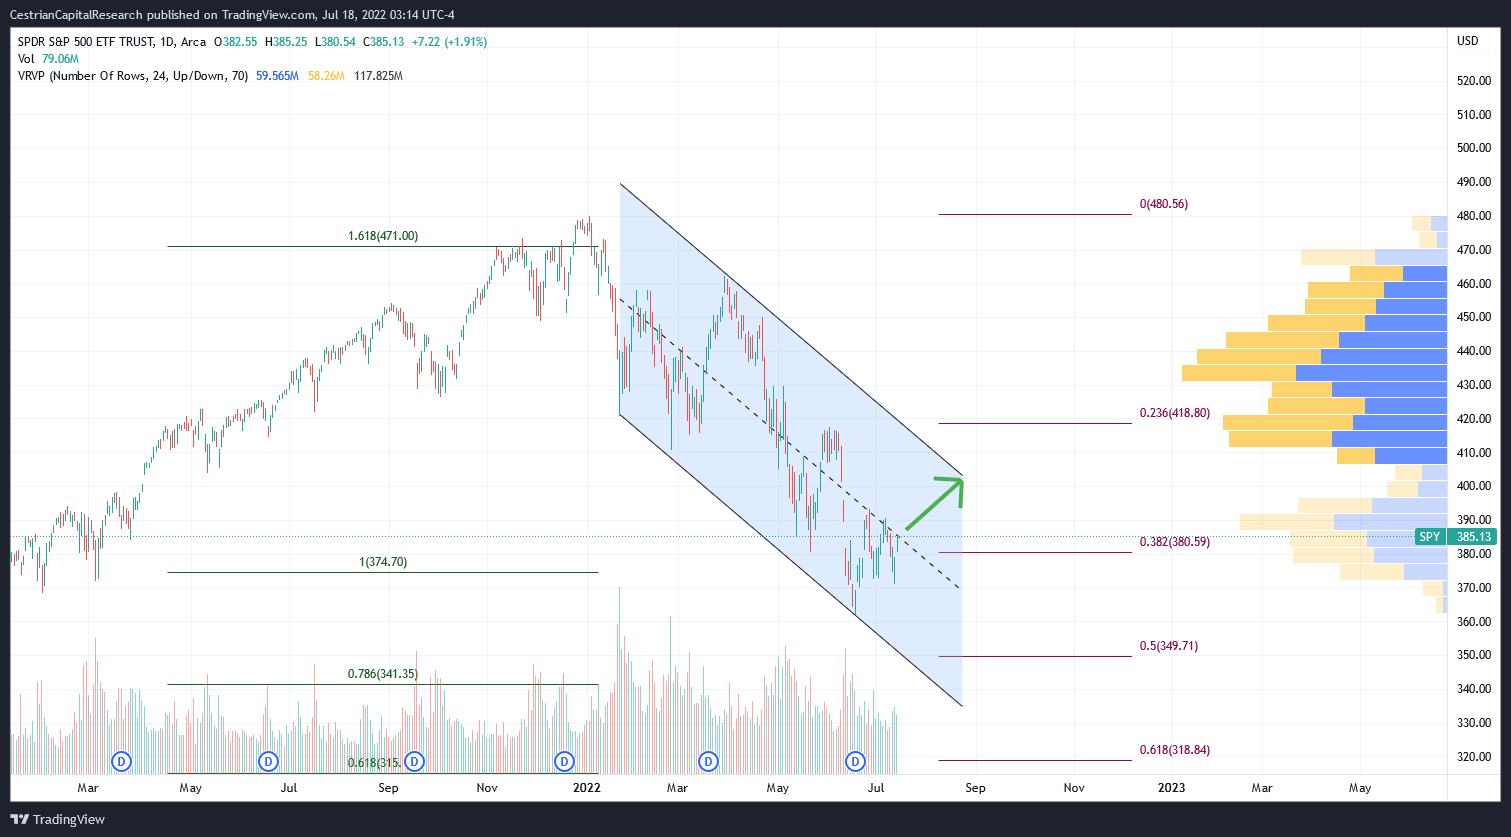
So even if SPY does keep pushing up, we may run into resistance at +/-$400. Then, and only then, can we know whether truly sentiment will trump what lies outside the window. If it does, we should see SPY climb back up to that 0.236 retrace ($418ish) and beyond. And if not – a move back down to $380 and below, maybe as low as $350 (which is that 0.5 retracement of the post-Covid move up).
As always, nobody can know for sure and all you can do is watch in real time to know when it’s safe to be risk-on and when best to dial back. In our Growth Investor Pro service our house stance is as follows:
Short-term bullish on the market until SPY approaches the $395-400 range, in which case we believe cashing in gains and de-grossing positions would be prudent. If SPY pushes up and out of that downward channel, and turns the upper resistance line into support, long positions can be safely added to in our view, in anticipation of a further rise. But if the downward channel persists and we’re simply in a modest rally within a continuing bear market, time to keep cash and/or add to short positions. In our service we find the short levered index ETFs are useful instruments for this.
Other Useful Indicators Include Crypto
Corroborating evidence and other indicators of risk appetite? You can look at the Nasdaq if you like, but in truth whilst the timeframes are a little shortened and the price moves a little amplified vs. the S&P, the two move very much in concert. So QQQ doesn’t add much visibility to the mix.
Crypto however we find useful as a canary in the coalmine. For instance, when Bitcoin scares, and it scares easy right now, the index usually follows. As you can discover on FinTwit and elsewhere, BTCUSD above $20k and moving up is a useful indicator of risk-on for now. Below $20k, risk off.
So in our view, if the present short term rally in BTC moves up and rolls over, at the rollover point we believe that can flag a pending rollover in SPY too.
Incidentally, we believe BTC can drop a lot once it rolls over. Its correction off of the Covid highs looks incomplete to us.
BTCUSD Chart (TradingView, Cestrian Analysis)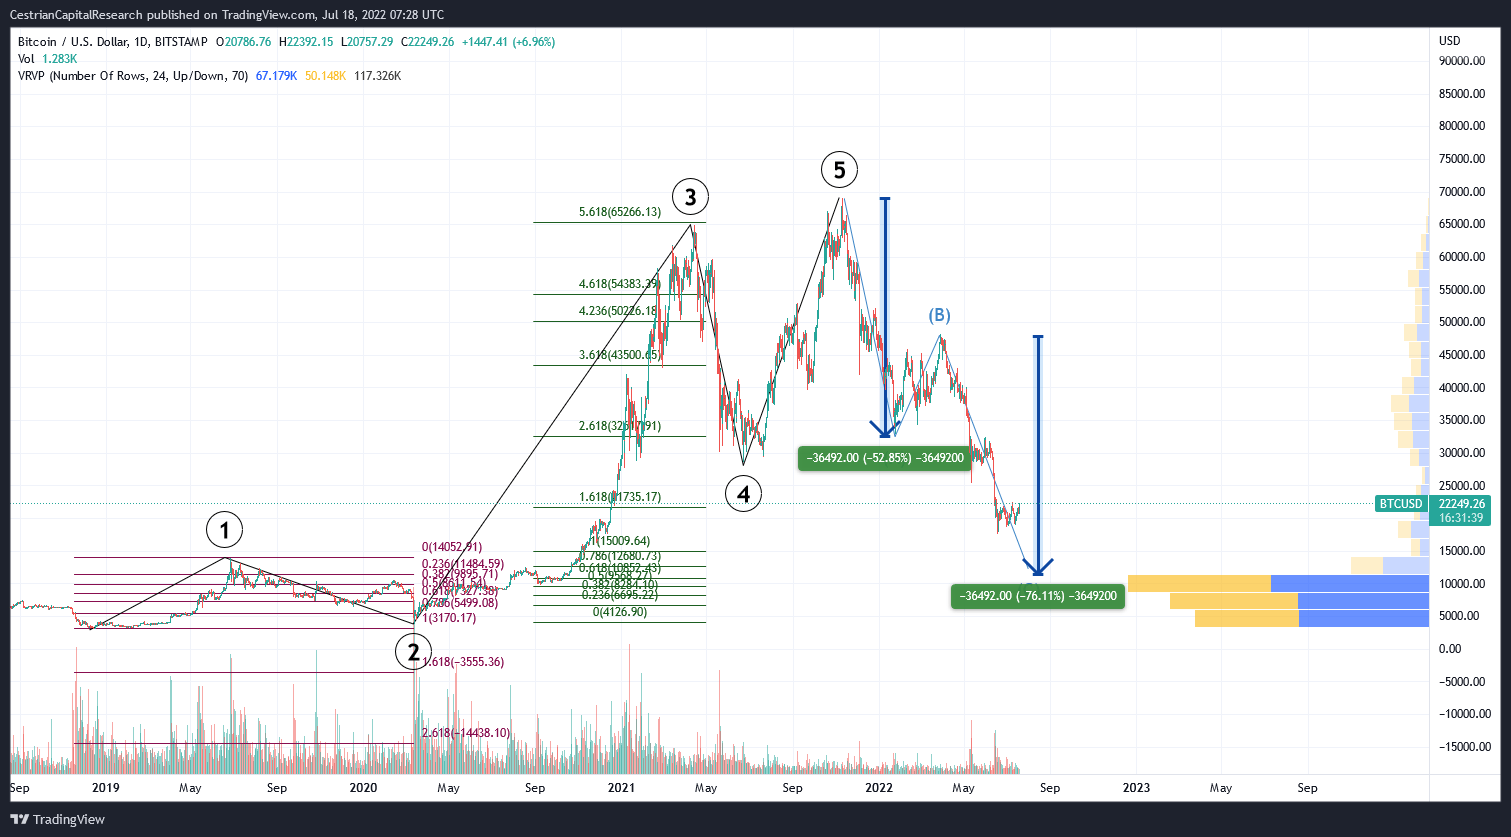
Being an instrument of pure sentiment, with no reality to it at all – no earnings, no fundamental tether to anything, BTC can be charted very well with sentimental tools like Elliott Waves and Fibonacci levels. If you look at the chart above which runs from the 2018 lows, you have again some moves that fit the patterns very well. Wave 1 up, ends just below the 0.786 retrace at the Covid lows for a Wave 2 low. Then a HUGE Wave 2 up – hitting the 5.618 Fibonacci extension of Wave 1 almost to the dollar – a Wave 4 down then a final Wave 5 higher. After a full 5 wave impulsive move like that, it’s common to see a three-wave A-B-C correction and common too for A=C i.e. the price drop in the A leg is equal in the C leg before a bottom is reached. BTC hasn’t achieved that yet. A=C would be satisfied around $12k which is also where the first major high volume node sits on the volume profile (in other words there was a lot of volume traded at that $12k and below price, a lot more than in the upper reaches of the recent price range; that suggests you have holders more likely to defend $12k as support than $20k as support). So at some point we would say, BTC is going to take another big hit and that’s not positive for SPY.
Ether by the way tells a slightly different story and may lead BTC’s recovery.
ETHUSD Chart (TradingView, Cestrian Analysis)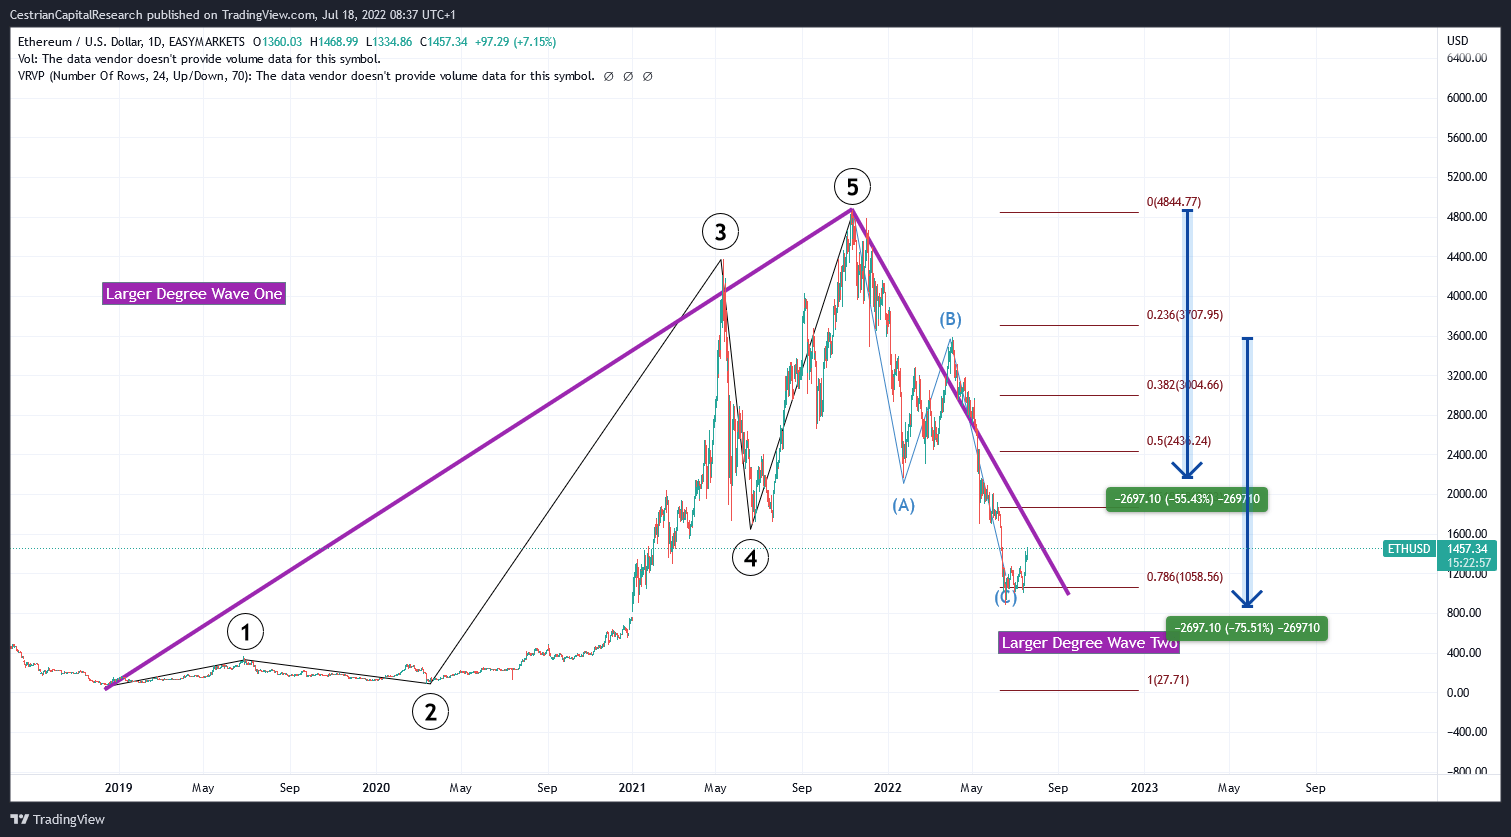
So far ETHUSD has bottomed at the 0.786 retrace of the whole move up since the 2018 lows and that bottom satisfied the A=C condition, to within a few dollars in fact.
So What Does All This Mean For Stocks?
In our Growth Investor Pro service and indeed in staff personal accounts we have been moving to risk-on at the recent lows. We’ve closed profitable short positions in XLE, USO and WEAT; taken profits in volatility (UVXY), cashed profitable long positions in inverse ETFs such SQQQ and SPXS, and closed short positions in QQQ. We recently opened a new TQQQ position, averaged down our ETHE in-price, averaged down our PINS in-price on news of the Elliott stake, averaged down in ARKW and OKTA and so forth. We think these long positions can pay off but we are watching the above levels and indicators very carefully indeed and expect to dial risk down some if SPY and BTC keep moving up. Our conclusion for stocks right now is, work out your levels ahead of time, stay on your toes, don’t be complacent with gains, and practice the ability to become bullish or bearish depending on what the indicators are telling you, not what your cavedwelling limbic system would have you do!
Cestrian Capital Research, Inc – 18 July 2022.
Be the first to comment