

Kameleon007
In this article I will look at five exchange-traded funds (“ETFs”) to find out which one is the best to invest in once this bear market is over. The five ETFs examined in this article are: SPDR S&P 500 ETF (NYSEARCA:SPY), Invesco QQQ Trust (QQQ), Consumer Discretionary Select Sector SPDR Fund (XLY), Financial Select Sector SPDR Fund (XLF), and Industrial Select Sector SPDR Fund (XLI). These are often referred to as “risk on” assets.
I will gather data from the last five bear markets – defined as drops in the S&P 500 Futures (SPX) of 20% or more. We know from history when each of the last five bear markets ended. For the purposes of this article, I will consider the bear market to be over once the market as measured by SPX has closed above its 10-month exponential moving average. In each case, this will have occurred after the exact bottom of the five bear markets. I will then look at the performance of buying each of the five ETFs at the opening price the following month and then holding those ETFs for one-, two-, and three-year periods. Let’s see what we can find out.
The first bear market will be the Dot Com Bear Market. In this event, the market lost over 50%. The S&P 500 Index reclaimed its 10-month EMA in April 2003, so according to my method, I would enter a position for each of the ETFs at the open of May’s trading. Table 1 shows the results of those for the next three years.
Table 1 – Dot Com Bear Market
Author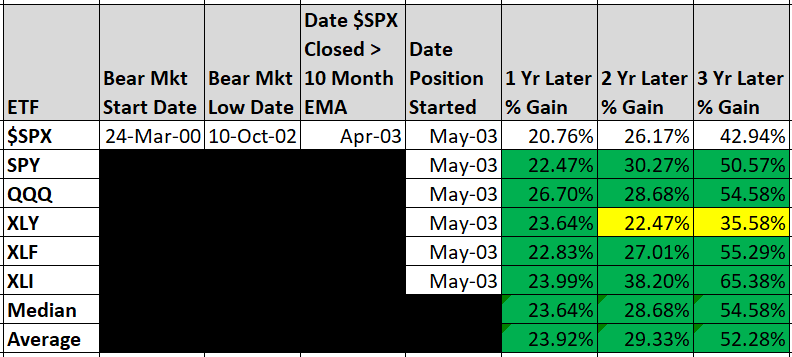
Table 1 shows the results of SPX in the second row with the one-year, two-year, and three-year results. All other results that beat SPX are highlighted in green. Results that underperform SPX are highlighted in yellow. The bottom two rows show the median and average results for all ETFs for that period.
The results show that QQQ performed best for the first year, returning 26.70%. XLI performed best for the two-year and three-year period. XLY underperformed the market for the two and three-year periods. These results surprised me, as I thought that technology stocks would have outperformed all others for the three years because technology stocks were so beaten down during the bear market.
The second bear market examined will be the Financial Crisis Bear Market. In this event, the market as measured by the SP 500 lost over 57%. The SP 500 reclaimed its 10-month EMA in July 2009, so according to my method, I would enter a position at the open of August’s trading. Table 2 shows the results of those for the next three years.
Table 2 – Financial Crisis Bear Market
Author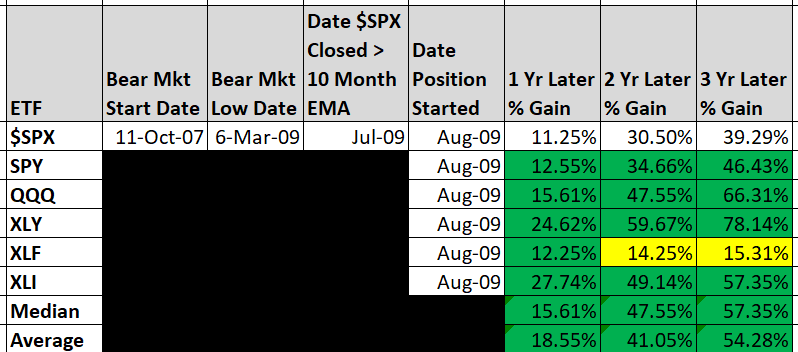
Looking at Table 2, Industrials were the one-year winner. They more than doubled the market’s gain for the first year. XLY also more than doubled the market in the first year. Consumer Discretionary stocks outperformed all others for the two-year and three-year periods. It’s interesting to me that Financials never got on track and were clear laggards.
The third bear market examined will be the European Debt Bear Market. In this event, the market as measured by the SP 500 lost over 21%. The SP 500 reclaimed its 10-month EMA in October 2011, so according to my method, I would enter a position at the open of November’s trading. Table 3 shows the results of those for the next three years.
Table 3 – European Debt Crisis
Author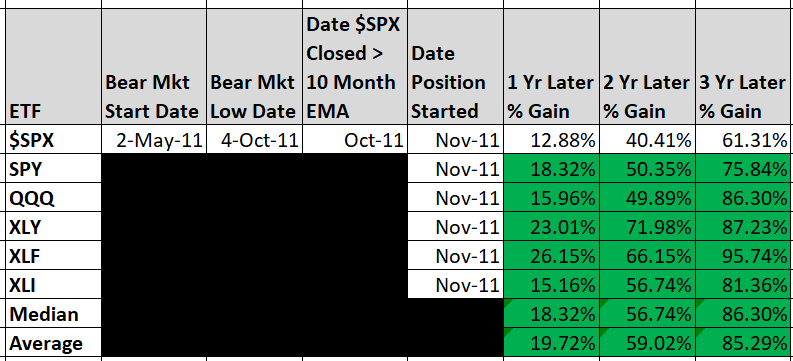
Table 3 shows that Financials led for the first year coming out of the bear market, more than doubling the market’s overall performance. Consumer Discretionary stocks outperformed for the first two years. Financial stocks outperformed all others over a three-year period. This table shows that all the ETFs studied outperformed the market for all three time periods.
The fourth bear market examined will be the Cryptocurrency Debt Bear Market. In case you’re wondering, I got this name from Wikipedia. In this event, the market as measured by the SP 500 lost over just over 20% barely qualifying for bear market status. The SP 500 reclaimed its 10-month EMA in January 2019, so according to my method, I would enter a position at the open of February’s trading. Table 4 shows the results of those for the next three years.
Table 4 – Cryptocurrency Bear Market
Author
Coming out of this bear market is where technology stocks show up. QQQ outperforms all the other ETFs for all three time periods. It does so in a big way. It’s two-year and three-year performance is 40 percentage points higher than its closest competitor. The time frame of the table overlaps Table 5 five below and therefore shows the COVID rally where technology stocks dominated. This bear market is also one where there were several ETFs that underperformed the market over all three time periods.
The last bear market covered is the COVID Bear Market. In this event, the market as measured by the SP 500 lost over 35%. The COVID bear market was the shortest bear market in the study spanning just over a month. The SP 500 reclaimed its 10-month EMA in May 2020, so according to my method, I would enter a position at the open of June’s trading. Table 5 shows the results for two full years and to the end of October 2022 as there hasn’t been a full three years since this market reclaimed its 10-month EMA.
Table 5 – COVID Bear Market
Author 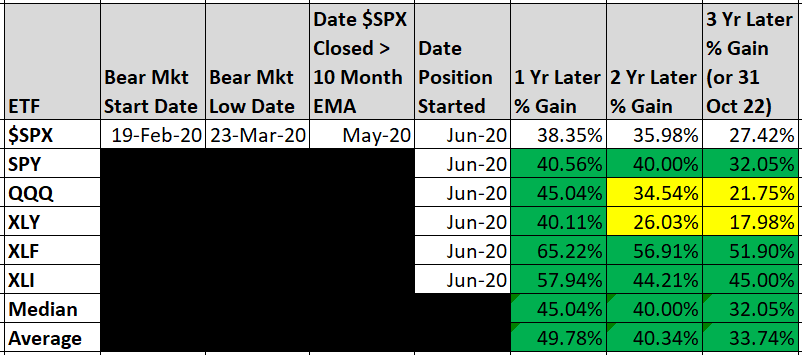
Coming out of the COVID Bear Market, Financial stocks led the way for the first year. This result surprised me. I was certain it was technology stocks that led the way. For the two-year period XLF outperformed all other ETFs while managing to lose money from the end of year one to the end of year two. The same situation happened with the return to the end of October 2022. XLF led all other ETFs for the total period, while losing money from the end of year two.
The last table will be the averages for all five ETFs compared to SPX for all five bear markets. This chart is difficult to read, and I apologize for that. When reading this chart, percentages highlighted in green are percentages that are above SPX returns for the same period of the bear market identified in the first column. Percentages highlighted in yellow are percentages that are below SPX returns for the period of the bear market identified in the first column. The cells highlighted in blue represent the best period return for that bear market.
Table 6 – Combined Results
Author
What jumps out at me from Table 6 are three things. One, SPY outperformed the broad market in each bear market recovery in each time period. So, if you want to outperform the market, buy SPY. I think Warren Buffett gives that advice. The second observation is that QQQ outperformed the broad market for the first year in every instance. It outperformed SPY for the first year in every instance except the Euro Debt Bear Market, where QQQ returned 15.96% in the first year while SPY returned 18.31% in the first year. Both beat SPX during that time frame. Three, each ETF had its moment of outperformance and underperformance.
What I’ve learned from this study is that once the current bear market is over, meaning SPX closes above its 10-month moving average, I will put some of my money in SPY. I will put money in QQQ for the first year at least. XLY, XLF, and XLI all had their opportunities to shine. Looking at Table 6, I’m not sure I can make a blanket statement that one or more of those ETFs should be an automatic buy over SPY or QQQ coming out of a bear market over.
Be the first to comment