

NoDerog
Public Storage (NYSE:PSA) is one of the largest and most well-known companies in the self-storage industry with an unmatched scale consisting of the top market position in 14 of their top 15 markets, in addition to an ubiquitous presence in the United States, where half the population lives within a PSA trade area.
The company has a long 50-year operating history and is a component of the S&P 500 with a sector-leading A-rated balance sheet comprised of low leverage and significant liquidity. In addition to maintaining their leadership position in their top markets, they are also accelerating growth into their largest market of Los Angeles, which is also among the world’s largest and most difficult to break into.
For investors seeking downside protection against recession, the self-storage industry is one valid haven. From a historical perspective, during the Great Financial Crisis of 2007-2008, all commercial real estate segments experienced a net annual loss of between 25-67%, except self-storage, according to Mainstay Global, which posted a gain of 5%.
The reason for the outperformance is due to the essential nature of storage, which goes hand-in-hand with shelter. And in the current economic environment, storage is all the more important due to the amount of goods accumulated over the past two years.
Furthermore, with more of the population priced out of home ownership, many are being forced to dwell in rentals that are often too small for comfort. This is further amplified by the rise of hybrid working arrangements, with living spaces now serving dual purposes.
Self-storage, then, provides a viable alternative to those looking to free up space without having to incur the cost of moving out of their current locations. With an average cost of about $100-200/month, self-storage is a fraction of the cost one would incur to upgrade the square footage of their current living arrangements.
Despite its defensive nature and its leadership position in the market, PSA is still down about 20% YTD, which is on par with the losses of the broader index. Yet, as a defensive hedge, one would expect shares to be more immune from these significant declines.
Rate growth is, indeed, moderating and economic conditions are not favorable for their capital priorities, which include developments and acquisitions. But the company is still posting strong quarterly results, nevertheless, that are ahead of pre-2020 levels, and their financials are among the best in the industry. At its lows, PSA presents an attractive opportunity for investors seeking to add to their core real estate holdings.
A Large Same-Store Portfolio With Elevated Concentration In California
At the end of September 30, 2022, PSA had an interest in over 2,800 facilities with net rentable square footage of about 200M square feet (“SF”). This is up 5.9% and 8.5%, respectively, from the same period last year. Of their total facilities, their same-store population accounted for just under 2,300 facilities or about 75% of their total net rentable square footage at period end.
Though their geographic presence encompasses 40 states across the U.S., their operations are concentrated in five top markets: Los Angeles; San Francisco; New York; Miami; and Seattle-Tacoma. Collectively these top states account for about 40% of total YTD revenues and net operating income (“NOI”).
Q3FY22 Investor Supplement – Financial Summary Of Top Five Operating Markets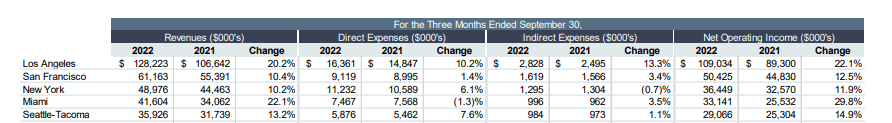
And Los Angeles itself, their single largest market, accounts for about 15% of the company’s business. Added together with San Francisco, total exposure to the California market amounts to over 20% of operations. While the state provides several key competitive advantages, such as its massive scale and high barriers to entry to new entrants, the elevated exposure does result in a higher level of concentration risk.
Moderating Rental Rate Growth But Still Up Double Digits
In the current period, same-store revenues were up 14.7% from last year, due primarily to a 17.2% increase in rents attributable to both existing long-term tenants and new move-ins. For existing tenants, rates were up in most of their markets in 2022 compared to last year, where there was curtailment in several regions. Additionally, rates were up 2.8% on new move-ins due to strong demand in most of their markets.
Though total revenue growth moderated from the 15.9% reported in Q2, rental rate growth held up comparatively unchanged. Leading the way in the quarter was strength in their Los Angeles market, which accelerated from 17% revenue growth in Q2 to 20% in Q3.
Benefits achieved via higher rates were partially offset by an increased volume of move-outs and greater promotional activity. In the current period, YOY move-outs increased 12.3%, outpacing YOY move-ins by 320 basis points (“bps”). This ultimately resulted in a sequential decline in occupancy during the quarter to 94.5% compared to 95.8% at the end of June 30, 2022. YOY, the decline is even more pronounced at 230bps.
Q3FY22 Investor Supplement – Net Move-In Summary In The Current Quarter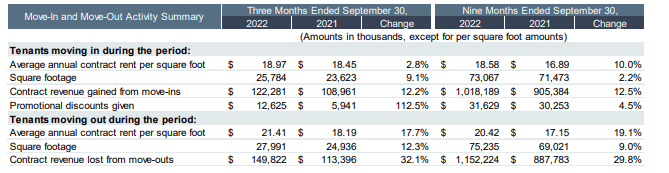
While rate increases were one factor in elevated move-out activity, move-outs from tenants not receiving increases were also higher compared to 2021. And as a result of higher move-out activity, the company engaged in increased promotional discounting and marketing, while also moderating the YOY growth of rental rates to new customers.
Still, move-out activity levels are still below those seen prior to 2020, and this is largely being offset by higher length of stays from existing customers. In addition, marketing outlays during the quarter came in at just 1.5% of total revenues, which is on the low end of their historical range of 1-3%.
Softness In San Francisco And New York But Continued Strength In Los Angeles
Among their major individual markets, all reported YOY double-digit rent growth, with particular strength in their Los Angeles and Miami markets, two top markets who each reported YOY growth of at least 20%. These increases, however, came with occupancy losses in all their top markets.
Rate sensitivity was notably pronounced in their San Francisco and New York markets. Even though rents were up 12.7% and 13.7% in these markets, occupancy was down 230bps and 240bps, respectively. This compares to only a 190bps loss in occupancy in Los Angeles, despite an over 20% increase in rates.
Q3FY22 Investor Supplement – Rent And Occupancy Summary Of Top Individual Operating Markets
Top-Rated Balance Sheet With A Safe Dividend Payout
PSA has one of the strongest balance sheets in the entire REIT sector. In 2021, for example, their net debt and preferred equity to EBITDA stood at just 4.0x, which was the lowest among comparatively rated peers at the time. That has since come down to 3.6x in the current period.
May 2021 Investor Day Presentation – Comparison Of Debt Load Of PSA Compared To Other Rated Peers
In addition, the company has a very high fixed charge coverage of 9.3x and a minimal amount of secured debt, which are both credit positives. Strength is further supported by the stable and predictable cash flows generated in their reoccurring operations.
Through the first nine months of this year, they generated +$2.4B in operating cash flows, which is over +$1.0B in excess of their investing activities, excluding the proceeds from the sale of their equity investment in PS Business Parks, Inc.
This is also more than sufficient to cover their quarterly dividend payment, which amounts to $2.00/share or a yield of about 2.9% at current pricing. Annualized, the dividend payout represents just over 50% of the low end of their range for core funds from operations (“FFO”), which suggests a high degree of safety in the annual payment.
At period end, total liquidity stood at well over +$1.0B, consisting of +$884M in cash and availability on their revolving credit facility. Furthermore, they expect approximately +$600M in retained operating cash flow over the next twelve months. And in addition to a low debt load, they also have no debt expirations through 2023, providing them with a significant cash buffer for opportunistic capital deployment.
An Industry Leader Worth Storing In The Long-Term Portfolio
PSA remains one of the largest global owners and operators of self-storage properties and is one of the most widely known names in the sector. Aside from its scale, they also benefit from a strong financial profile marked with low leverage and a significant liquidity position that includes nearly +$900M in cash on hand.
In the current quarter, core FFO grew 20.8%. And for the year, it appears set to grow by over 20% for the second consecutive year. Revenue growth also exhibited continued strength during the period.
Growth, however, moderated on a sequential basis. Additionally, occupancy declined on an increase in move-outs during the period, with particular rate sensitivity in San Francisco and New York, two of their top operating markets.
Increased turnover is resulting in more promotional activity. But as a percentage of total revenues, marketing expenses are still on the low end of historical averages. Additionally, higher move-outs are being offset in part by greater length of stays from existing tenants and continued strength in their largest market, Los Angeles.
And though occupancy declined from last quarter, it’s still up from the years prior to 2020. This should provide some flexibility to push rates further on their existing customer base. An active pipeline of developments that should stabilize within the next three to four years also provides some visibility to future earnings growth. While higher costs will likely pressure yields, management has proved adept at controlling expenses, as evidenced by their strong operating margins.
Presently, shares are trading at about 17.7x forward FFO and at the lower rung of their 52-week range. While this is above the smaller peers, such as Life Storage (LSI), CubeSmart (CUBE), and National Storage (NSA), who all trade between 13.4x to 16.1x, it’s discounted to Extra Space Storage (EXR), who is currently trading at 18.2x.
The discount is despite PSA’s leadership stake in the market and their strong operating metrics that includes EBITDA margins in excess of 70%. The company also maintains a better-positioned balance sheet with cash on hand that is well above their peer set. While some would argue that PSA’s current discount to EXR means EXR just has further to fall, one can reasonably argue to the contrary.
Self-storage is naturally resistant to recession, and PSA is the top company in the sector, with a significant presence in one of the largest markets in the world, Los Angeles. Given the current economic environment, premium valuations should be reserved for only top operators with pristine balance sheets and financial metrics.
PSA is one such name that warrants a premium to peers. At a 20x multiple, shares would trade at a premium but still lower than where they have historically. At this price, shares would have implied an upside of over 10%. While that may not be enough for some, it’s still a reasonable amount from current trading levels. And for those seeking a permanent hold in their long-term portfolios, PSA remains a strong candidate to store away for the long haul.
Be the first to comment