

Dzmitry Dzemidovich
In my most recent bond analysis, which focused on the iShares 20+ Year Treasury Bond ETF (TLT), inflation, and monetary outlook, we predicted that the YoY and MoM inflation peaks would both occur in the months of July – September. I wagered that commodity prices would decline and that other leading indicators would also dramatically deteriorate. However the Fed responds to the most lagging inflation parts, the CPI/PCE/core CPI report from July is not initially bullish. Lower commodities prices had a significant impact on the MoM’s “stabilization,” but the most lagging drivers to the CPI – shelter and services are still quite high and are still increasing. The necessary items, which the Fed wants to stabilize, are not stabilizing.
On first glance, the market rallied due to strong data from inflation prints, but in our breakdown, the data has not been strong at all. SPDR S&P 500 Trust ETF (NYSEARCA:SPY) deviated from the long-term inverse correlation between real yields and SPY’s price mainly due to a “strong fundamental week.” However, I’m firmly convinced this was another bear market rally. Medium-term inflation expectations rose, which is not a good case for stocks. In summary, we can await more rate hikes to come, more than the market currently prices in.
Inflation breakdown
The CPI’s YoY growth was still high at 8.5% and rose in July by zero percent. However, the core CPI rose “only” by 0.2%, which was lower than the consensus. Nevertheless, if you make an inflation breakdown, you will see the drivers. Motor fuel (oil & gas) has contributed very negatively to the overall CPI monthly change. This item is the most current in the lagged CPI. However, the most lagging components of the CPI are housing, food prices, medical care services, and other services, and it will take some time for these inputs to stabilize or decline.
CPI monthly change (@MacroAlf)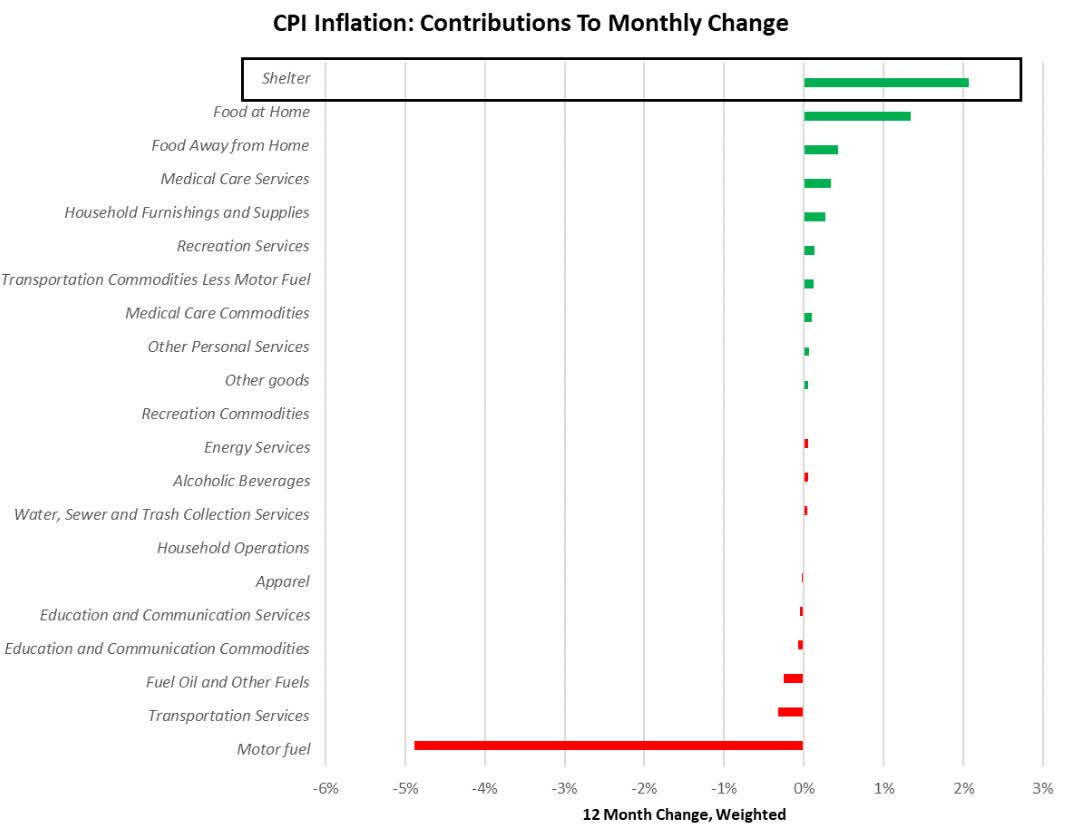
As I stated in my previous analysis on TLT, the consumer destruction will take place in 2-3 months. The issue is that supply-side inflation (mainly oil, gas, and other commodities) can be impacted only indirectly – mainly by lowered demand. That is what we see in the commodity market right now. Industrial commodities and the ones that have a great impact on overall CPI started to decline. But it does not reflect only demand destruction but also the quite strong economic slowdown (forward-looking). I still believe inflation will go down, but mainly due to the strong base effect caused by the measured style-YoY comparison. The much more important figure will be core inflation on a monthly basis.
Still, if inflation were to be zero on a monthly basis till the end of the year, it would still be at 6.5%, and if it were to be longer, it would be at 3.3% in March. Still significantly above the fed’s medium-term target. I am confident that inflation will fall, and that we will see a significant slowdown in 4Q2022, but this must be accompanied by a continued reduction in consumption and GDP growth forecasts.
Projecting CPI at Year-End (BLS, Cleveland Federal Reserve Nowcast)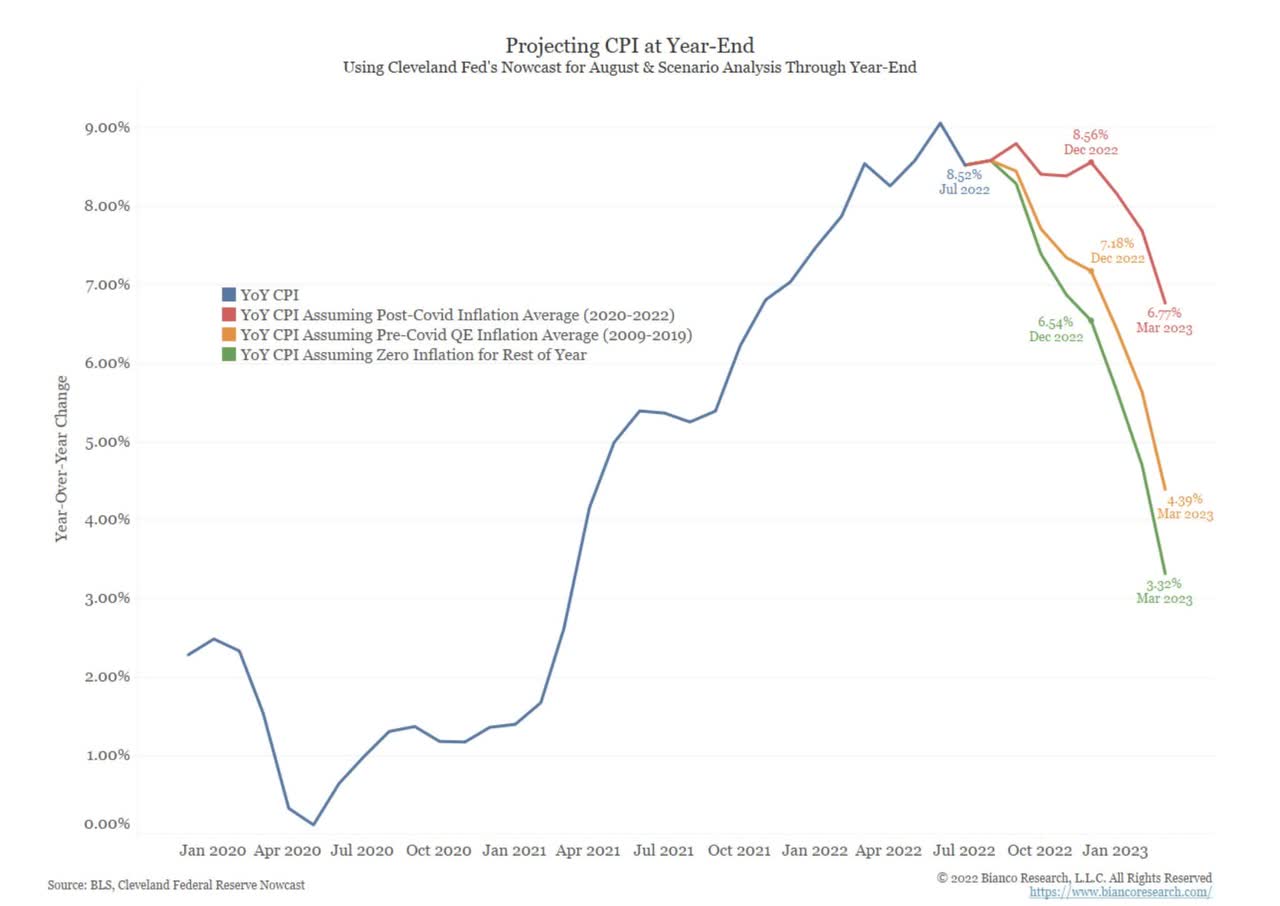
Outlook on the monetary policy
I’m strongly convinced that inflation will go down on a YoY basis. On the other hand, I’m a little bit less convinced by the MoM point of view. To support this scenario, the fed will need to be very hawkish to convince the market that it will do so. Despite still having a very inverted yield curve, the market started to price in fewer rate cuts than anticipated 2-3 weeks ago. And this is all on the back of lower-than-expected inflation figures from a week ago. The spread between Fed funds futures rates in Dec 2022 and Dec 2023 is reaching less than -0.2, thus implying market expectations of almost only one rate cut till Dec 2023.
Spread between FFF 12/2022 and 12/2023 (Author´s calculation via Tradingview)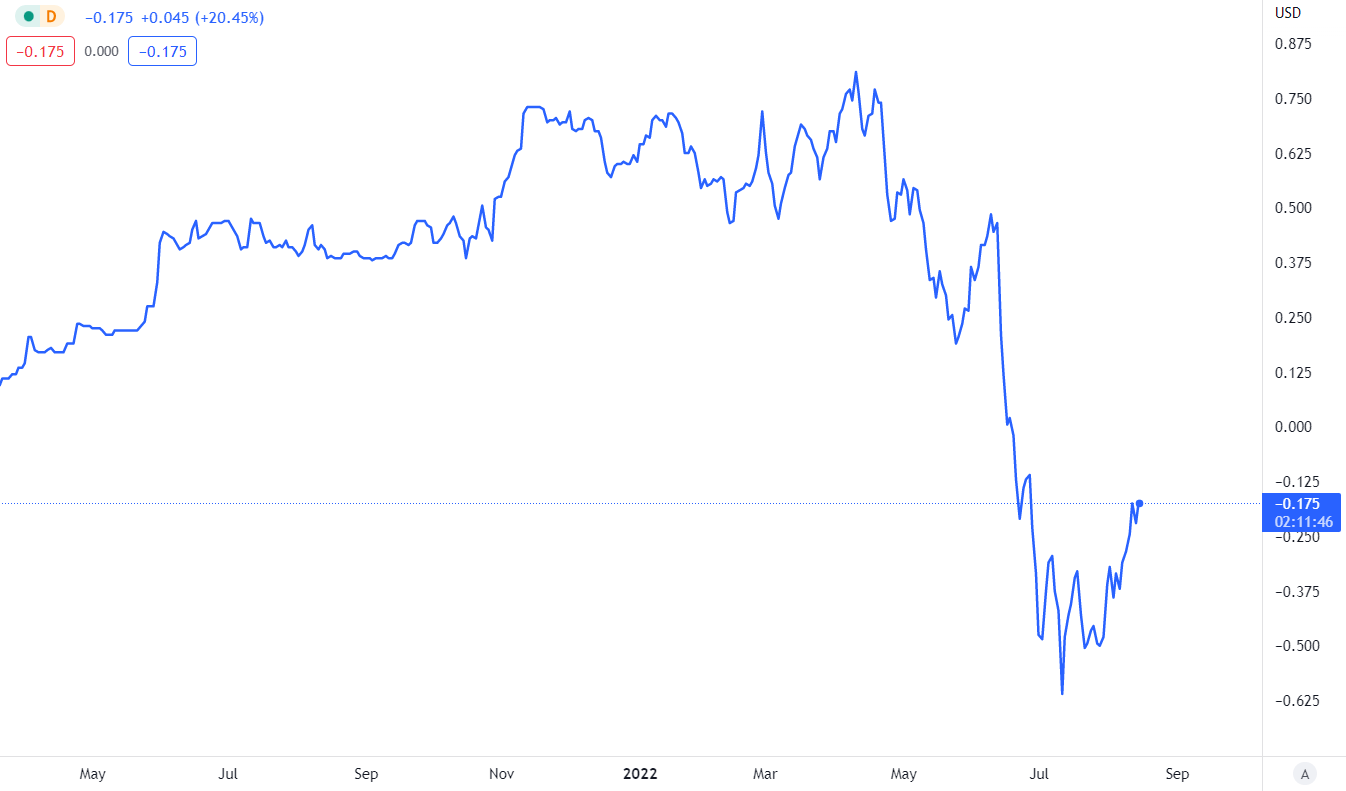
Despite the fact that the market began slightly repeating the FOMC member’s rhetoric, the stocks rallied significantly. It is because the market believed the narrative of “soft-landing” to be more probable than before inflation prints. However, the inflation fight is still not over. I consider this rally unsustainable and not supported by the macro fundamentals. After the inflation print, rates expectations measured by Fed funds futures rose quite significantly.
Rates expectations measured by FFF (Author´s calculations via Tradingview)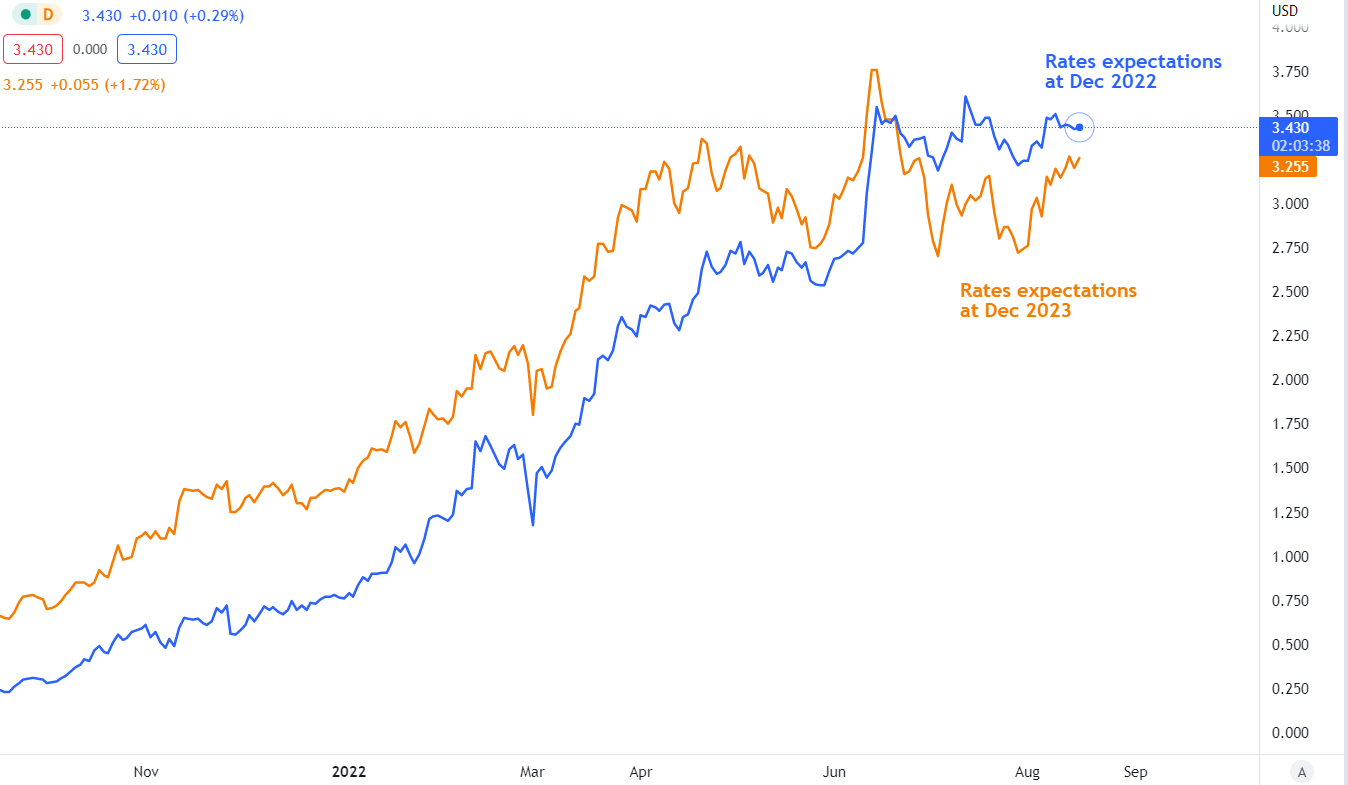
Thus, retail investors are fairly misled by inflation print and soft-landing. This scenario does not support the thesis of being bullish at current levels. However, for me, the very strong narrative stands behind the real yields and SPY. There is a very strong negative correlation among the variables, which the market fully ignored until Friday.
Real Yields vs. S&P500 (Bloomberg, Morgan Stanley Research)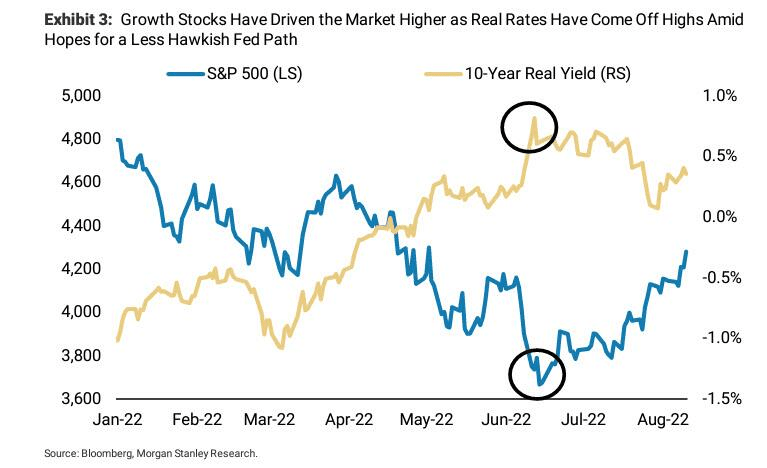
The key driver of the latest rally was short-covering
As many investors / traders followed the inflation print and saw a market rally, they massively closed their short positions or bets, which led to a significant rally from the bottom. That’s the true reason why the market rallied in the previous weeks. And it only makes sense to me because macro fundamentals such as real yields and other leading indicators have all worsened, just hand in hand with a strong labor market. Despite the rise in real yields, the market rallied in recent weeks, their negative correlation deviated significantly from normal conditions, giving me no reason to be bullish from a macro perspective.
On the contrary, as I said, the rally was caused mainly by short covering (the closing of short position) and it was the 3rd most aggressive short-covering in the latest ten years.
Short covering / Short selling (GS Prime Book via Investro)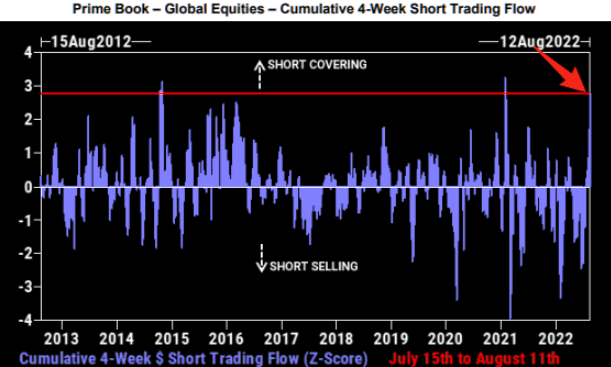
And also a great chart from @MacroCharts, which measures the sum of (QQQ) deltas, indicated that this massive rally was caused by a full switch of position. As there are monitored deltas for QQQ, I believe it will be similar for the S&P 500 or SPY, because major stocks from QQQ are also integrated with significant weights in SPY. From the extremely short to the extremely long ones. For me, it is absolutely unsustainable to remain at such levels, and the rising probability of further downturn, combined with macro fundamentals, gives me quite strong confidence.
Sum of QQQ Deltas (Charlie Mcelligott / Nomura via @MacroCharts)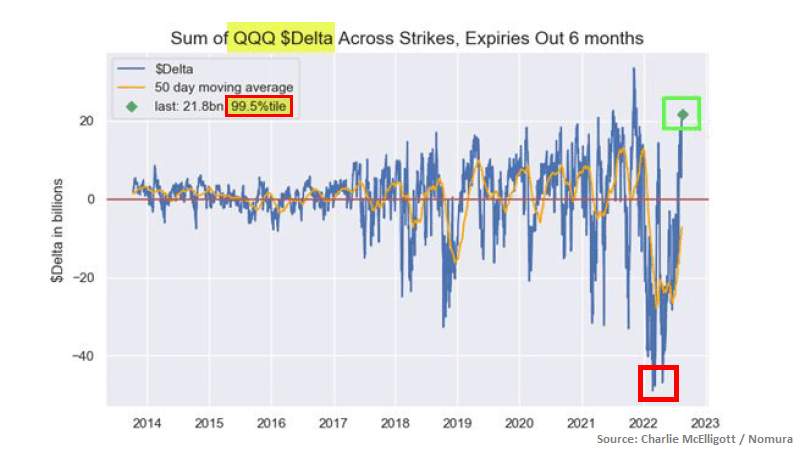
Another very important measure, which I highly recommend, is to follow short sale volumes for SPY/QQQ and others. The chart below just implies there is a lack of shorts or very low activity in short selling, which is a great contrarian indicator. The 10-day moving average of short sale volume, measured by FINRA, indicates there is a lack of short sale volume, indicates the market is probably exhausted. It also confirms the thesis of short-covering rally in the previous weeks as well. Just look at the significant numbers of short selling in mid June, in hand with the market bottom. There should be no surprises about the following market squeeze or strong short-covering activity. Currently, I see a strong reversal situation, thus giving room for another leg down in SPY. However, I also could be wrong, but combined with the real yields narrative, the worsening economic situation, and the strong contrarian indicator of short sale volume, I am firmly convinced this was another bear market rally.
The Fed believes a soft landing is less likely than the market
The reason why I believe such a narrative is caused by FOMC members’ statements as well as by the data-driven approach. First of all, there are leading indicators that are screaming to us that inflation as well as economic growth will slow down. However, as previously stated, the YoY will slow, and the MoM will most likely stabilize. However, even if there is a 0% MoM change until the end of the year, inflation will still be significantly above the medium term horizon and above the fed’s key target. With so strong numbers from the labor market, the fed can be calm to focus really on inflation and to tame it. The sacrifice would be economic growth. This is the reason why I believe rate hikes will continue until the fed sees a portion of lagging core CPI MoM moving around -0.2% to 0.1% in the medium term.
Now, let’s summarize some of the latest statements from FOMC members.
Fed’s Bullard, according to Reuters:
St. Louis Fed President James Bullard, who was among the central bank’s earliest advocates last year of a more muscular response to fast-building price pressures, said that given the strength of the economy he is currently leaning toward supporting a third straight 75-basis-point interest rate hike in September.
Also, Mary Daly, president of the San Francisco Federal Reserve, stated earlier on Thursday that raising rates by 50 or 75 basis points at the fed’s upcoming policy meeting on September 20-21 would be a “reasonable” way to raise short-term borrowing costs to slightly above 3% by the end of this year and put them on a path to a little bit higher in 2023.
Also a kindly hawkish note from the Fed’s Kashkari:
So the question right now is, can we bring inflation down without triggering a recession? And my answer to that question is: I don’t know. Fed has more work to do in raising interest rates to bring inflation down.
Despite the better than expected inflation print, the fight is not over and there must be a clear indication of tightening conditions that will continue to bring inflation down. Until then, the market still hopes for a soft-landing as in 2019, but this is really different story. I’m firmly convinced it will bring a bigger economic slowdown than the current one, but I don’t know if it will be a big recession. Probably not. But it will be harder than soft-landing. Kashkari is one of the first FOMC members to admit that they are unsure whether it will cause the recession or not. They just can’t tell you, “for sure we will cause a recession.” However, in the previous months, when the yield curve started to be inverted, the fed screamed that it was not an appropriate indicator of recession. The opposite is the truth.
However, the fed released its own indicator of forecasting recession, slightly different than the classic yield curve, which had not been inverted before. It is now fully inverted, which, according to previous fed papers, should clearly indicate a recession going forward. A great chart from @MacroAlf calculated the development of this indicator, and as it was almost one month ago, it started to be inverted, thus confirming that the fed knows and is aware of the ongoing recession. Regardless of what they say. It was the only opinion as the yield curve started to be inverted that it was better to monitor the “near-term spread,” calculated as 18m forward 3m yields minus 3m yields, as it is a much more precise predictor of the upcoming recession.
Fed´s preferred yield curve indicator (@MacroAlf)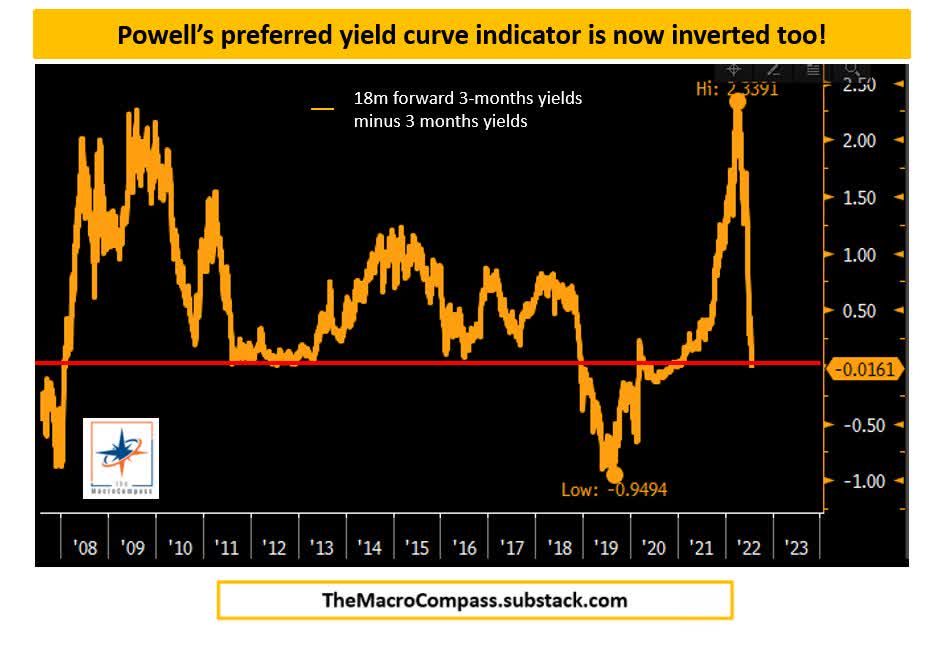
Earnings are lagged, CPI too
However, I’m convinced that CPI will go down and the fed will tame inflation. The issue is that there will be an EPS drop as well. To tame inflation rapidly, it is necessary to cause an economic slowdown. However, it is happening right now, and many leading indicators are confirming this thesis. Companies are oversupplied (with inventories), commodity prices are falling, and PMI and new orders are dropping too. Oil is falling; however, natural gas recovered from the total drawdown seen in July. Nevertheless, the macro indicators tell me that inflation will calm down, but the fed needs to continue doing its job and focus on inflation. I also believe that it can cause a mild recession and then we could see slight rate cuts in 2023. The next chart shows the leading indicator – G5 Credit Impulse and its impact on S&P 500 EPS as well as CPI YoY. Both are well lagged vs. their leading indicator, which leads by 4-5 quarters. This also supports our thesis, thus giving room for EPS decline as well as for CPI decline.
G5 Credit impluse as leading indicator (@MacroAlf)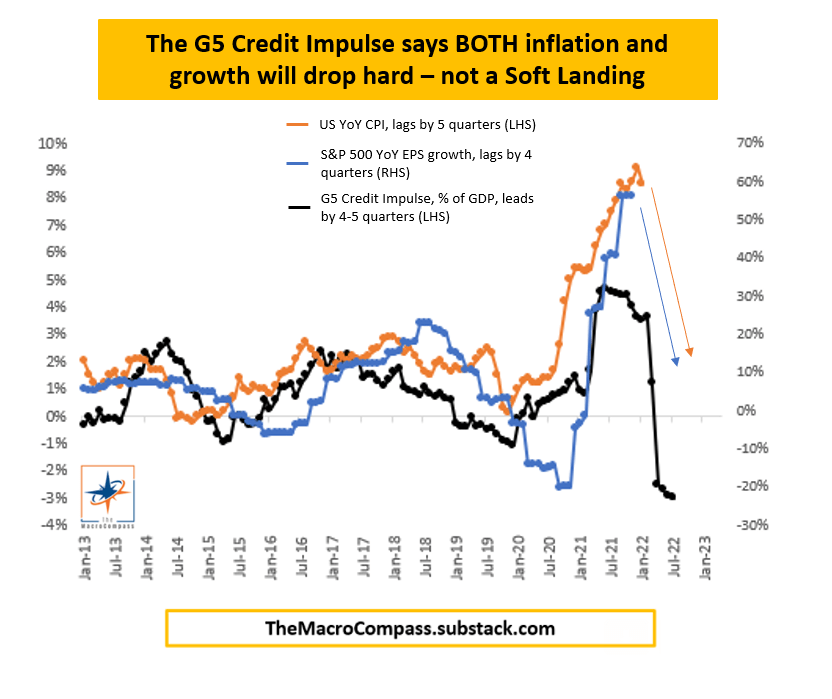
Risks and Summary
Let’s start with the risk to our thesis. The first risk can be that I have wrongly detected another bear market rally and where a bull market started. I do not say we will find the new bottom. Currently, I’m convinced that under current macro circumstances, followed by sale volumes and short-covering narrative, the market is overbought and should decline 5-15% from its current levels. The next risk to this thesis is that inflation will fall fast with a soft-landing. Although I see a little probability, it is still a kind of scenario. When inflation, mainly core inflation, drops significantly, it could cause the fed to stop the tightening cycle and, after 2-3 quarters, to ease conditions rapidly. And that’s all without economic damage, with a strong labor market and slight economic growth. Currently, I’m not convinced that is the case.
In my opinion, the short scenario has significantly bigger odds right now for plenty of reasons: Real yields and the SPY correlation have significantly deteriorated and deviated, which is unsustainable in my opinion. Additionally, we saw that due to strong short-covering rally – the 3rd largest in the last 10 years. Next reason is that there is a lack of short sellers right now, which could indicate a short-term market peak. The market rally could be exhausted because there are no short sellers. The next indicator is the still and tireless statements from FOMC’s members, which are still very hawkish, and the best case is to DO NOT FIGHT THE FED. The most recent narrative remains focused on inflation print. Very volatile figures and the most current ones as motor fuel, transportation, and others are down, but it depends on prices (on the market). However, the fed wants to see the most lagging parts as a shelter, services, and demand side inflation to cool down. It will take some time, and I believe we will see that. But also, it will have a negative impact on EPS. Also, I can be wrong, but these are the key reasons why I firmly believe that the market is exhausted (upwards) and a short-term rally downwards could continue.
If you like my analysis and appreciate my work, I would be very grateful if you would follow me on SA. Please feel free to comment. I will try to answer all your questions.
Be the first to comment