

Andrew Burton/Getty Images News
The 2022 Bear Market – The Phase 1 Selloff
The cyclical top for S&P500 (SP500) was on January 4th 2022, at 4808 on intraday basis. On October 13th, SP500 was as 3502, or 27% below the high.
After the late 2022 bear market rally, the downtrend in S&P500 (SPY) remains firmly in place – the bear market of 2022 is entering its second year in 2023.
What Caused The 2022 Bear Market?
The Fed made the major policy error in 2021 assuming that the post-covid inflation was transitory, and, consequently, in 2022 had to aggressively tighten the monetary policy. Specifically, the Fed increased the Federal Funds rate from 0.17% to 4.32%, and ended the QE program and started with the QT program.
The aggressive monetary policy in 2022 popped all excessive speculative bubbles, such as cryptocurrencies, meme stocks, and big tech. As a result, the S&P500 experienced the Phase 1 selloff – or the liquidity removal based selloff.
The two bear market rallies in 2022, the summer rally and the year-end rally, were both based on expectations, or hopes, of the Fed’s pivot, which would end the Phase 1 selloff. However, the Fed continued its hawkish stance – which brings us to 2023.
What To Expect In 2023 – The Phase 2 Selloff?
By aggressively hiking short-term interest rates, the Fed deeply inverted the 10Y-3mo yield curve. Historically, a recession follows within a year after the 10Y-3mo yield curve inverts – this has been empirically tested and proved in many academic studies. Currently, the yield curve is the most inverted since the data became available in 1980 – here is the chart.
FRED
Thus, based on the historical evidence, it’s almost a certainty that the US economy will enter a recession in 2023.
The ttm PE ratio for S&P500 is currently near 20 – this is much higher than the historical average (around 15-16). Obviously, the S&P500 is overvalued and not pricing the upcoming recession. Thus, in 2023, the S&P 500 is facing the recessionary selloff, or the Phase 2 of the bear market.
Specifically, the valuation multiple has to contract to reflect the economic reality. Further, the corporate earnings will have to be downgraded to reflect the possible decrease in earnings as the recession hits.
Current S&P500 earnings are at $189 (for Sep 2022, Dec 5th update). Based on YChart data, the earnings are already in a downtrend since Jan 2022 – and the recession hasn’t even started yet.
YChart
Thus, assuming that earnings drop to $175 for 2023, once the recession hits, and that the PE ratio contracts to 16, the estimated fundamental value for S&P500 for 2023 is 2800.
The Phase 2 selloff – the recessionary selloff, would bring the total drawdown in S&P500 to around 42%.
Trend Extrapolation
The fundamental analysis suggests that the 2022 bear market in S&P 500 is likely to continue in 2023, as the Phase 1 selloff transforms into the Phase 2 selloff, or the recessionary selloff.
Technically, we see the well-defined downtrend channel in S&P 500 since January 1, 2022. If we extrapolate this downtrend channel to the end of 2023, we get the range for S&P 500 from 2400 to 3200 with the mid value at 2800, which is exactly what the fundamentally based estimate is with the PE at 16 and $175 EPS.
TradingView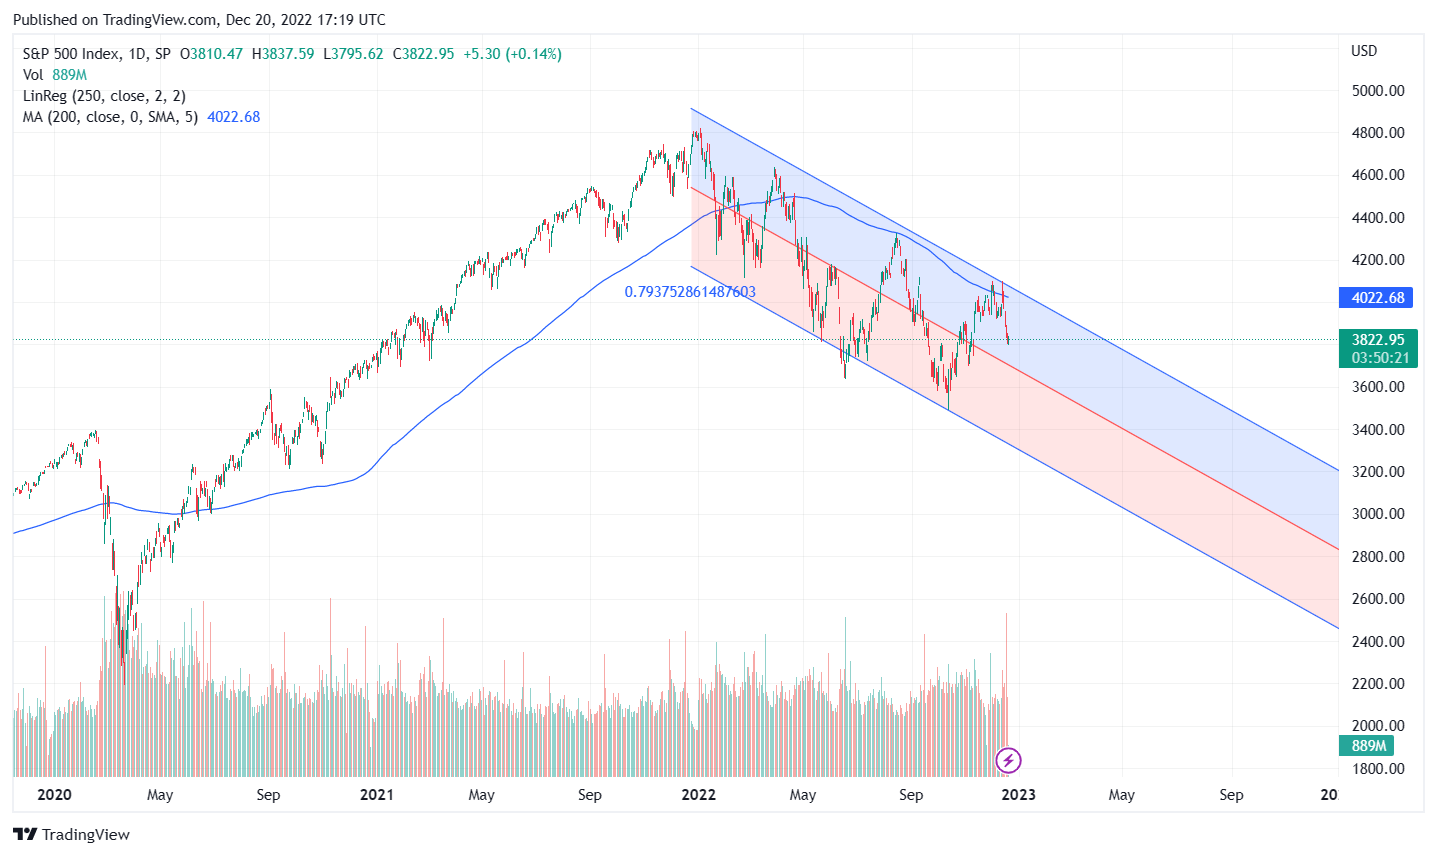
Thus, based on fundamental analysis and trend extrapolation, the fair estimate for S&P 500 at the end of 2023 is 2800.
The assumptions and risks
- The workers-jobs gap and a broad de-globalization will keep the inflation above the Fed’s 2% target, making it difficult for the Fed to make a dovish pivot. Thus, the Fed will hike to 5.1% and will not cut interest rates in 2023, as currently signaled by the Fed.
- The Fed is unlikely to officially (or unofficially) accept the inflation above 2%, and to abandon the 2% inflation target.
- The current downtrend channel in S&P500 has a strong resistance in the 200dma. The technical breakout of 200dma could change the sentiment in the market, at which point the current SP500 2800 estimate has to be revised.
- The first half of 2023 will likely price the upcoming recession. The second half of 2023 will start looking towards 2024. The SP500 2800 estimate would have to be revised depending on any significant changes to the 2024 outlook.
- As always, the current estimate is pricing all information currently known. The 2800 estimate will have to be revised if any unknown unknows occur in 2024.
- The geopolitical situation is highly uncertain, and the current assumption is that the Russia-Ukraine war would not spread to other regions, and the nuclear weapons will not be used.
What About The Phase 3 Selloff?
The Phase 3 selloff is the credit crunch, measured as the spike in credit risk (like in 2008). Once the recession hits sometimes in 2023, it is likely that “something will break”, and that “something” could cause the credit crunch and the financial crisis.
At this point it’s difficult to predict what will “break” once the recession hits, or if anything will “break” at all. Based on the 2022 UK bond selloff and the British Pound crash in response to the unfunded tax cut the sovereign credit risk could be the issue in 2023.
The BIS Report from December 2022 found investors have been taking on a huge amount of “off-balance sheet dollar debt” that is creating big risks for the U.S. economy. The total value of this “hidden ‘shadow bank’ debt” is $65 trillion. At this point it’s unclear what are the risks here, and how will this playout as the recession hits in 2023, but it does point to another key trigger for the possible Phase 3 selloff.
The Phase 3 selloff would likely extend the total drawdown to the lower level of the SP500 range – to the 2400 level.
Editor’s Note: This article was submitted as part of Seeking Alpha’s 2023 Market Prediction contest. Do you have a conviction view for the S&P 500 next year? If so, click here to find out more and submit your article today!
Be the first to comment