


powerofforever/E+ via Getty Images
In the 1970s, inflation proved to be much more stubborn than policymakers anticipated. By and large, they kept policy rates too low for too long, engaged in dubious legislative gambits, and were forced to face the reality of shortages of energy, food, and qualified labor willing to work after blowing out the money supply. Does this sound familiar at all? We’re about to get some clues as to whether history is repeating itself. This week brings two huge economic events, the first being the November CPI on Tuesday at 8:30 AM Eastern Time, and the second being the FOMC interest rate decision on Wednesday at 2 PM. The FOMC decision will be followed by Jerome Powell’s all-important press conference afterward. CPI reports and FOMC meetings in the past few months have seen daily swings of as much as 5% for the benchmark S&P 500 Index (NYSEARCA:SPY). To top it off, Friday is expiration day for monthly stock options, index options, and futures, known on Wall Street as “Triple Witching Hour“. All signs point to potential trouble.
Is The Market Too Complacent?
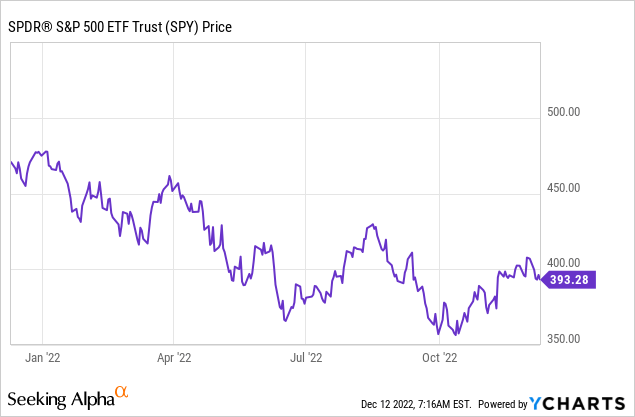
Since the October lows were set after a wild reversal from the ugly September CPI report, the market is up about 10%. The S&P 500 rallied all the way to 4100, which seriously clashed with softening expectations for earnings. 19x is historically a very high multiple for stocks in the current environment, and index buyers at 4100 in my view got very poor compensation for the risk they’re taking with risk-free returns near 5% in Treasury bills. This isn’t a total bubble price, but it’s on the very high range of normal.
Put another way, you can earn about the yield from simply parking your money in cash that you can earn by investing in businesses, so you want to be exceedingly careful about what stocks you buy. There’s an old rule of thumb in the stock market called the “rule of 20” that states that the P/E ratio of the market plus the inflation rate should sum to about 20. Celebrity fund manager Peter Lynch was known to be a big proponent of this rule of thumb. In its original form, the rule of 20 would imply a valuation for the S&P 500 of about 2700 index points. The S&P 500 may not drop that low, but the insight here is that the rate of return over cash for the market is far below what investors historically can expect. To justify its current valuation, the market needs inflation to go down quickly and needs unemployment to stay low so corporate earnings don’t tank along with it. That’s a tall order.
Last month’s inflation report that lifted the Dow by 1200 points in one day was quirky too. My modeling suggested a higher number, but the core CPI figures last month were helped a surprising amount by a technical data adjustment on the price of health insurance. The Fed prefers to use PCE data for policy because there are fewer quirks like this.
Interestingly, at roughly 24 as of my writing this, the VIX is much lower than it has been in previous months before CPI.
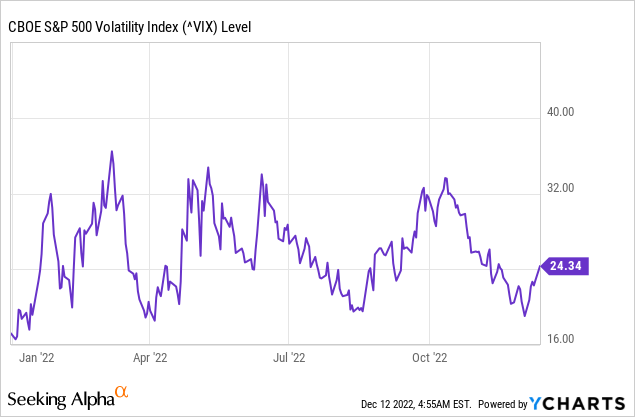
Using the square root rule as a rough guide, you can divide the VIX by 7 to get the expected move in the S&P 500 for a week. That implies a weekly move in the S&P 500 of about 3.4%. The one-day swings alone on Fed and CPI days have been more than that in previous months. I’d argue this is irrationally priced given the history of explosive moves in either direction from CPI, Fed, and options expirations, of which we have a trifecta this week. The algos will be locked and loaded for this week. And of course, more on my forecast for CPI below.
Historically, Inflation Doesn’t Just Go Away
The lesson from the 1970s and early 1980s is that policymakers would get a few good CPI reports and then cut rates, and then inflation would come roaring back. Now we’re potentially back in that kind of environment if we’re not careful. We now have an inverted yield curve, a stubbornly high CPI, and all kinds of media calls for more government handouts to “ease” the burden of inflation. Bloomberg columnist Aaron Brown did a great piece recently on decoding the yield curve, posing the question to readers of whether the economy will be allowed to wash out unproductive companies or whether the government will continue to exert more and more influence on the economy, leading to years more of 1970s-style economic chaos. Disco may be dead, but the idea that millions of voters have that they can get something for nothing has endured.
Brown is fairly optimistic that lessons were learned from the 1970s. At least publicly, Powell seems to be showing some semblance of backbone. In Jackson Hole this summer, Powell acknowledged the 1970s-era trap of cutting rates too soon (leading to the dollar falling, speculative demand surging, and inflation roaring back). At the Brookings Institute in November, Powell admitted that the US had a national housing bubble and that the Fed would help fix it. Beating inflation likely won’t just happen on its own. Social Security is about to increase by 8.7% in 2023, and millions of employees are currently negotiating their 2023 pay increases, which will be far in excess of numbers consistent with the Fed’s 2% inflation target. Implicit in these wage negotiations are threats of either going on strike or quitting and leaving for other employers, which at an unemployment rate of 3.7% is a credible and effective threat to employers. Unions representing pilots (30% pay increase) and railroad workers (24% increase) scored big concessions from Corporate America, while West Coast dockworkers are next in line for grabbing big pay increases. With voter focus squarely on inflation and shortages, unions have a lot of leverage over the Biden administration, the most high-profile example being the extraction of a $36 billion payout to the Teamsters union from federal COVID-relief funds to keep the peace.
And then, you have the Fed’s nightmare, which is the fact that consumer savings rates are near the lowest levels ever. Personal savings hit 2.3% in the last month, and this is with student loans paused. The only other time savings rates have been this low was in the run-up to the 2008 global financial crisis. Consumers are starting with more savings than they had then, but given enough time, these trends imply a serious day of reckoning for consumers. Saving 2.3% is not enough to cover the long-term obligations of consumers. 8% to 10% is considered healthy, and if personal savings go negative, it’s a huge red flag.
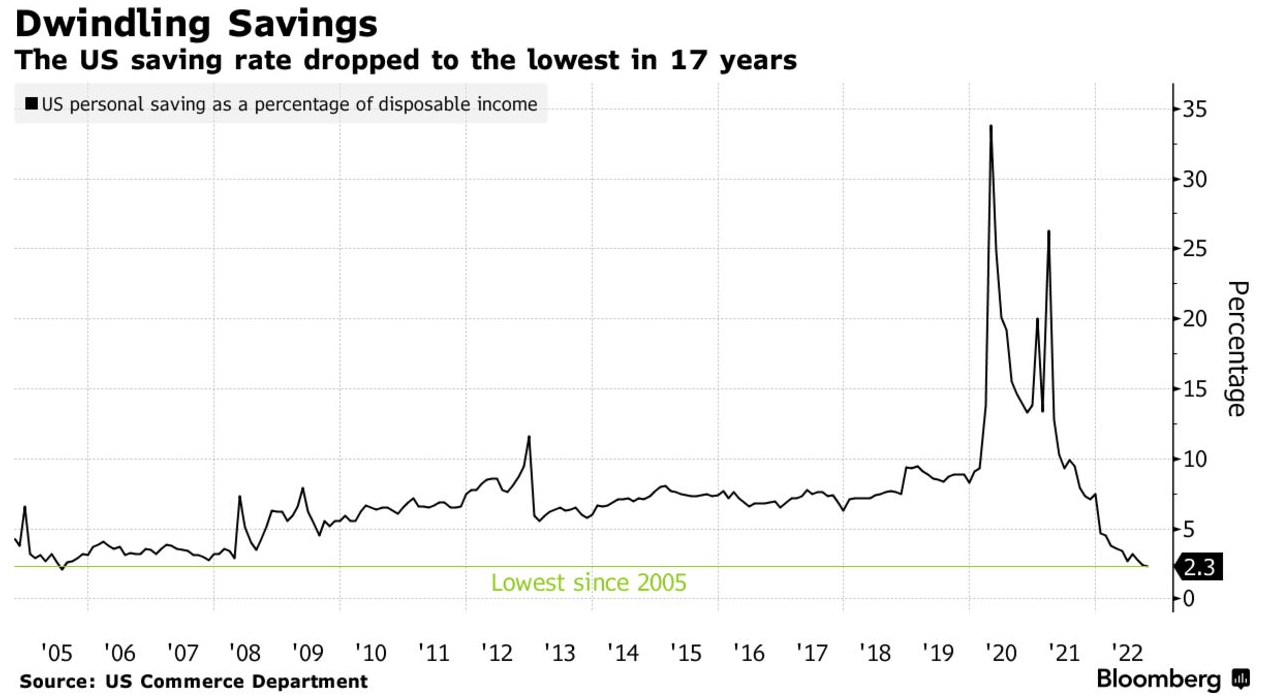
The Fed’s Nightmare? (Bloomberg)
As a result of this YOLO-driven economy, real incomes from wages continue to relentlessly fall for consumers, while spending continues to climb. The Fed has published reports on this to help shed light on where the money is coming from and where it’s going– they’re worth a read. The consensus here is that pent-up savings from pandemic stimulus are continuing to fuel the economy and that this money will soon run dry. The Fed’s data that they’ve published on consumer savings is mostly indirect– you can’t tell from their PCE estimates just how much consumers have in reserves or how long it will last. Bank CEOs can fill the gaps. JPMorgan’s (JPM) Jamie Dimon has suggested that the excess savings will run out around mid-year 2023. BofA (BAC) CEO Brian Moynihan often plays the optimistic foil to Dimon, but he’s called for GDP contraction in 2023, albeit mild. Capital One (COF) is a key lender for subprime borrowers, and they’ve struck a cautious tone, limiting some new accounts for borrowers with lower credit scores.
Consumers still have some pent-up savings from the pandemic, but rather than use them to shore up their retirement or follow the Fed’s lead and put the money on deposit to earn 5%, they’re spending with reckless enthusiasm. The WSJ recently published a report, “The $42 Billion Question”, asking why so few consumers are moving their money to earn more than the 0% interest that big banks pay. Thousands of dollars per year are up for grabs for millions of affluent households, and most of them effectively refuse to pick it up off of the sidewalk. Maybe they’d rather spend it all.
As long as consumers have this cash pile, they’re going to spend it (YOLO), rather than see their neighbors having all of the fun (FOMO). These personal savings rates are mind-blowing when you consider:
- The general level of affluence in the US vs. other countries. The US is by no means the only economy with speculative excess, but if anybody should be putting money away, it’s Americans.
- That most American households own a home bought at non-bubble prices with sub-4% mortgages (or none at all).
- And that those who don’t are often benefitting from the student loan pause (which is going to get axed by the conservative Supreme Court in late winter or spring).
There’s still way too much demand out there given the level of people willing and able to work– and too much (mainly borrowed) money chasing too few goods. This leads me to believe that we’re still at least a good six months or so from inflation being pushed down to levels that are consistent with anywhere near the Fed’s 2% inflation target. Another hint about whether inflation is defeated comes from the Mannheim used car index– it was falling steadily but now has leveled off. Why might this be? Of course, pent-up demand.
Where Will November CPI Come In?
It’s now time for us to handicap the CPI figures. Economists expect 0.5% CPI inflation for November and 0.3% core CPI inflation. Last month, October CPI came in at 0.4% and core came in at 0.3%.
The preponderance of the evidence suggests that inflation is a bigger problem still than economists realize.
- The dollar is down about 10% off of its October highs. The US imported $3.4 trillion in goods and services in 2021. The move upward in the dollar previously had served to mask the true amount of inflation in the US and make inflation appear worse in places like the EU. Now, with the dollar coming back down, these same goods and services will cost about 10% more than they would have a month ago. This alone is enough to increase CPI by between 1% and 2% over the next year.
- Stocks are back up and yields are down, encouraging people to borrow and spend. The Fed often speaks of “financial conditions” with respect to its monetary policy. What this means in the real world is that people see their accounts back up from where they were in October, so they go right back to spending, losing any caution they may have developed from the market rout earlier in the fall.
- To this point, markets are reflexive. October’s CPI print came about in large part because of a stronger dollar, lower stocks, and higher yields leading up to the report. This made the inflation number come in lower and made the market believe that the Fed would soon pivot. The last time this happened, it set the conditions for the next CPI report to come in hot, dashing any hopes of a Fed pivot and sending stocks to new lows and yields to new highs. Now since November, we’ve seen a weaker dollar, higher stocks, and lower yields, all setting the conditions for another hot report and crazy swing in stocks. The paradox here is that the more traders get excited about lower inflation and a Fed pivot, the less likely it is to happen.
The Cleveland Fed econometric model generally outperforms professional economists in forecasting inflation. The model predicts a core CPI of 0.51% for November, far higher than the 0.3% projected by economists. I think this is about the right number for November. CPI is projected to increase another 0.5% in December by the model, which I also agree with. If the Cleveland Fed model is correct, then equity markets will get a slap in the face as their hopes of a Fed pivot are filed away for the next six months.
Another approach is to look at other countries that report CPI before the US does in the month. My unscientific sample shows that core November CPI in Mexico was higher than expected, core CPI in South Korea was higher than expected, and core CPI in Hungary also surprised to the upside. In each case, the countries had seen a decrease in energy costs coupled with an increase in demand-driven core CPI. My forecast is therefore 0.5% for core CPI in the US for November for the reasons above. If this is so, the market won’t like it.
What Will the Fed Do This Week?
The day after CPI we will get the Fed. My guess is that the Fed has boxed itself into a corner regarding a 50 basis point hike and that they won’t backtrack to 75 bps if the inflation report comes in hot. Similarly, if inflation comes in as expected, raising by 25 bps would send the wrong message to the market and fuel round after round of technical, speculative buying. Therefore, almost regardless of where inflation comes in, I’d expect a 50 basis point increase in the Federal Funds rate, followed by a hawkish press conference. But the key question is where the Fed funds rate is likely to top out, and how long they’ll keep it there. I believe the rate will have to go higher than most people think and stay there for longer as well as a result of the unprecedented level of free government money and the wrecking ball effect it had on the real economy in 2021.
But let’s get back to some econometrics.
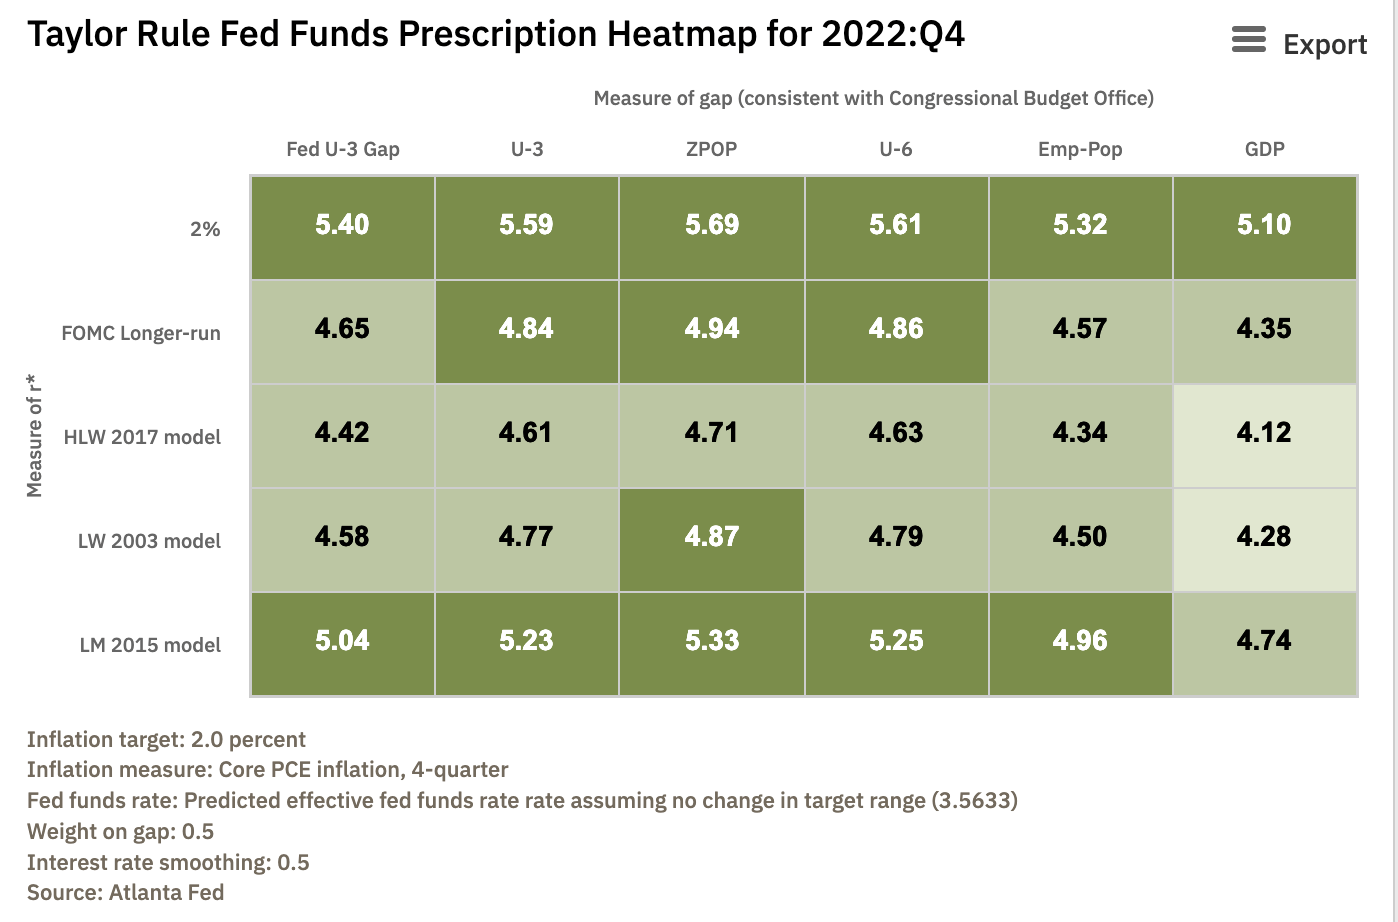
Taylor Rule Calculator (Atlanta Fed)
Under most assumptions for where Fed policy should be, the recommended interest rate is around 5%. Key to my assumption here is that roughly 50% of core inflation is supply driven and 50% is demand-driven. If you believe that two-thirds of core inflation is demand-driven, then you get this.
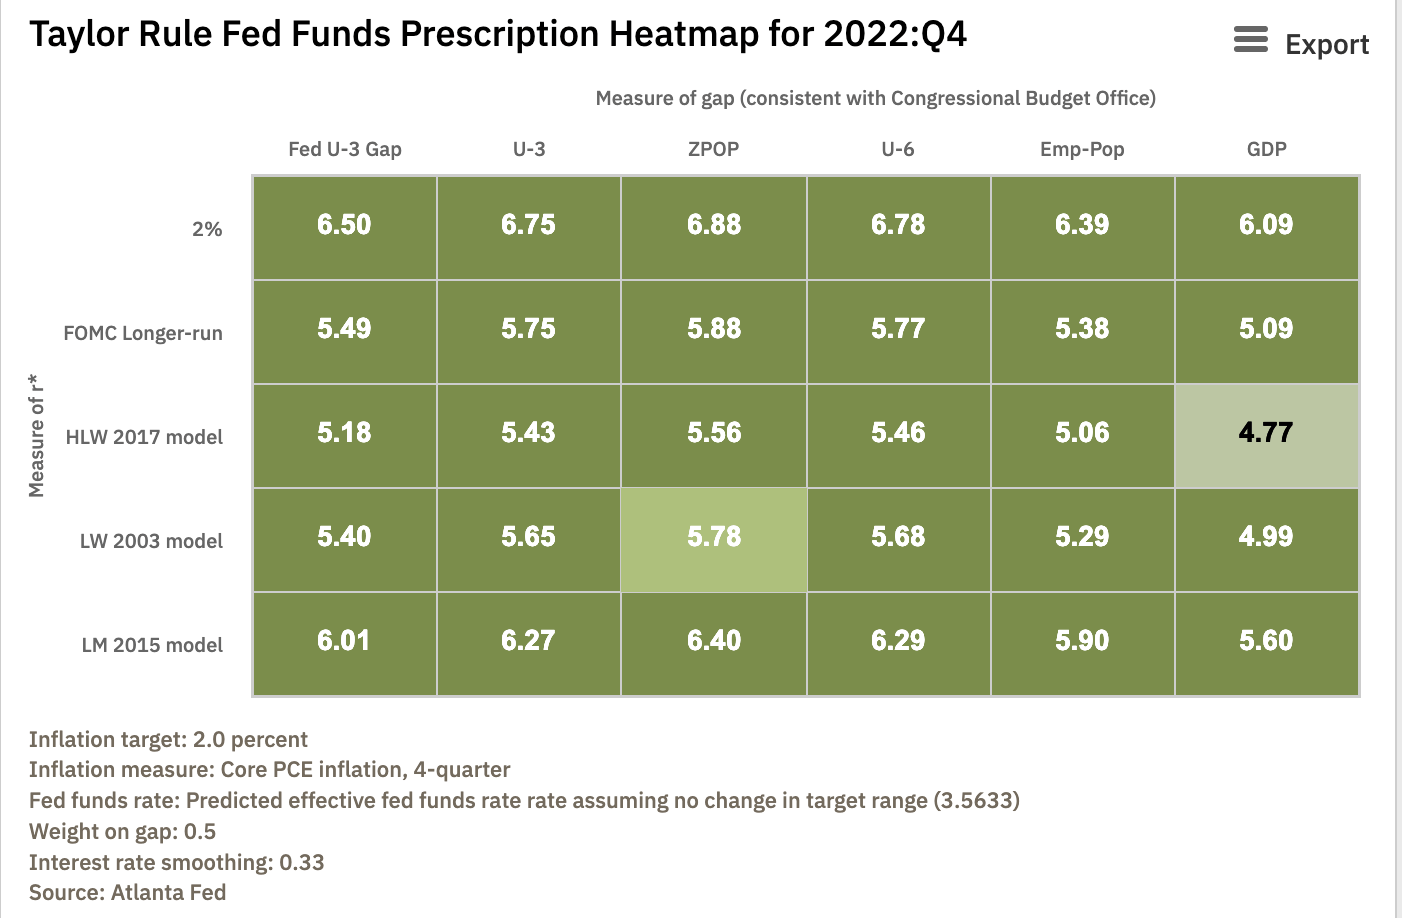
Taylor Rule Calculator (Atlanta Fed)
These figures are in line with some vocal policy hawks like Larry Summers. The approach has some minority support inside the Fed as well from more hawkish members like St. Louis Fed president James Bullard. 6% rates would have some serious implications for stocks, as you’d be silly to park much money in high-multiple growth stocks when you could get 6% for doing nothing. The Fed is likely to go 50 bps this week, but credible arguments are being made for bringing in the big guns later on if this week’s inflation report shows a lack of progress on core inflation.
Bottom Line
Should you make any portfolio moves off of the Fed this week? Perhaps, or perhaps not. I understand the sentiment of not wanting to make short-term moves or trying to time the market. But even so, investors have discretion with when to deploy new money into the market or raise cash for sales. And the expected rate of return on cash, bonds, and stocks should absolutely color your asset allocation decisions. In this case, the message is that you want more cash and fewer stocks as part of your asset allocation mix. There are still good businesses you can buy at reasonable valuations, but it’s a macro minefield out there for index investors with high valuations, an on/off recession on the horizon, and a Fed that is forced to hike rates into a weakening economy to wrest back control over inflation. However CPI and the Fed shake out this week, expect some fireworks from a heavily technicals-driven market going into triple witching on Friday. The preponderance of the evidence suggests that stocks will fall this week, possibly sharply. But in a market ruled by the algos, I wouldn’t rule out a monster rally on at least one day of this week. In any case, the short-term risk/reward looks bad!
Be the first to comment