

DNY59
Bearish again
I’ve been publicly bearish S&P 500 (NYSEARCA:SPY) since March 25th 2022. However, I’ve been trying to find the “hole” in the bearish scenario, and to see the “glass half-full”. In fact, I turned bullish on May 30th, just before the summer rally, before resuming again with the bearish view on August 15th. Just recently on September 29th, I tried to time another “bounce” higher, but this time, it’s very hard to justify the fundamental logic for even a short-term bullishness. Thus, as I will explain in this article, I am resuming my bearish on SPY.
Fundamental framework
As I explained in my previous articles, my default view on S&P 500 (SP500) (SPX) is bullish, unless:
- The Fed is expected to significantly increase the interest rates and reduce liquidity, in which scenario all speculative positions are expected to be closed, and all speculative bubbles burst. I define this as the Phase 1 of the bear market or the Liquidity shock.
- There is a high probability of an imminent recession, in which the earnings get downgraded and the valuation multiples contract. I define this as the Phase 2 of the bear market, or the Recessionary selloff.
- There is a high probability of the credit crunch, during which credit spreads spike and cause the forced liquidations, especially if the major financial institution goes bankrupt (for example Lehman). I define this as the ultimate Phase 3 of the full bear market, or the Credit risk selloff.
Stock market selloff YTD
The S&P 500 is down by over 25% YTD. The selloff is rooted in the Fed’s hawkish pivot on November 2021, when the Fed admitted the “transitional inflation” error and signaled the beginning of the interest rate tightening cycle.
Ever since, the expectations of the Fed’s hawkishness have been increasing. The Fed has increased the interest rates from near 0% to over 3%, and it’s expected to hike to 4.95% by April 2023, based on the Federal Funds futures.
Thus, the stock market selloff YTD has been the Phase 1 or the Fed-induced Liquidity shock selloff. As a result, all excessive speculative bubbles busted, for example in cryptocurrencies (BTC-USD), big tech (QQQ), stocks like Tesla (TSLA), and ETFs like ARK Innovation ETF (ARKK).
The Phase 1 of the Fed-induced liquidity shock ends approximately with the peak in the Fed hawkishness. This is the point at which the market fully prices the Fed’s expected policy tightening.
The problem is that we are still not at the peak Fed hawkishness. With every data point, the market increases the expectations for the cyclically high interest rate.
In fact, in June 2022 before the summer rally, the Fed’s made a mild dovish turn, and the expectations of the further tightening eased. That was the major reason behind my bullish turn. However, the negative inflation surprises during the summer killed all hopes for the dovish turn.
What’s next for stocks?
Based on historical facts, the Fed’s monetary policy tightening causes a recession. Thus, the next stage for S&P 500 is the Phase 2 of the bear market or the Recessionary selloff. During thus stage all economically sensitive stocks decrease in value, while the speculative names continue to crash.
The ideal bullish scenario in my playbook is that the Fed reaches the peak hawkishness before the economy starts significantly slowing down. This would produce the period between the Phase 1 and the Phase 2.
In this “interphase” scenario, the market would rally, which would many define as the “bear market” rally. However, the rising stock prices, in combination with the interest rate stability, could increase the probability of a soft landing or a very shallow recession. In this scenario, the Phase 1 bottom could be the overall bear market bottom. This was the possibility with the June bottom.
Unfortunately, the June bottom is not holding, and the S&P 500 (SPY) has made the new cyclical lows. Why? We have not reached the peak Fed hawkishness yet. In fact, we have not reached the peak core CPI inflation yet.
Thus, the Phase 1 liquidity selloff is still in process. At the same time, the economy is starting to slow down, and most economists expect the recession to officially start in Q1 of 2023 – that’s in 2-3 months from now. You can call this an imminent recession. (Yes, we had negative GDP reading in Q1 and Q2 of 2022, but I define the recession as the weakening labor market).
Thus, the window for this “sweet spot” between the Phase 1 and Phase 2 is closing, and the chance of the meaningful bounce is decreasing. Now, the S&P 500 is facing the recessionary selloff, marked with the corporate earnings downgrade and further PE valuation contraction, possibly even below the historical average of 15-16 to reflect the prolonged period of subnormal growth.
The worst-case scenario
The recessionary selloffs that trigger the credit crunch or the Phase 3 selloffs produce the deepest drawdowns, for example the bear market of 2008. Thus, the worst-case scenario for the current bear market is the possibility of the severe credit crunch.
Currently, the corporate credit spreads are not indicating any stress in the financial markets, which is as expected because we are not in a recession yet. But once the unemployment rate meaningfully increases, and if the housing prices sharpy corrects, we could be in another financial crisis.
Most importantly, the forthcoming financial crisis is likely to be a sovereign credit event and a global financial crisis. We currently have the preview of this scenario in the UK, where the government continue to favor fiscal stimulus, while the central bank tightens to fight inflation. Systematically, this could lead to the currency crisis like in 1997, led by the Fed-supported strong USD.
Further, the real possibility of an escalating geopolitical situation with the Russian invasion of Ukraine, combined with the unfolding trend of deglobalization only strengths the US Dollar (UUP) and increases the probability of the global financial crisis.
Implications and tactical considerations
The ETF that tracks S&P 500 (SPY) is currently below the long-term support level, the 200-week moving average. The continuation of the 200wma breakdown could signal a longer-term bear market and a much deeper total drawdown.
Barchart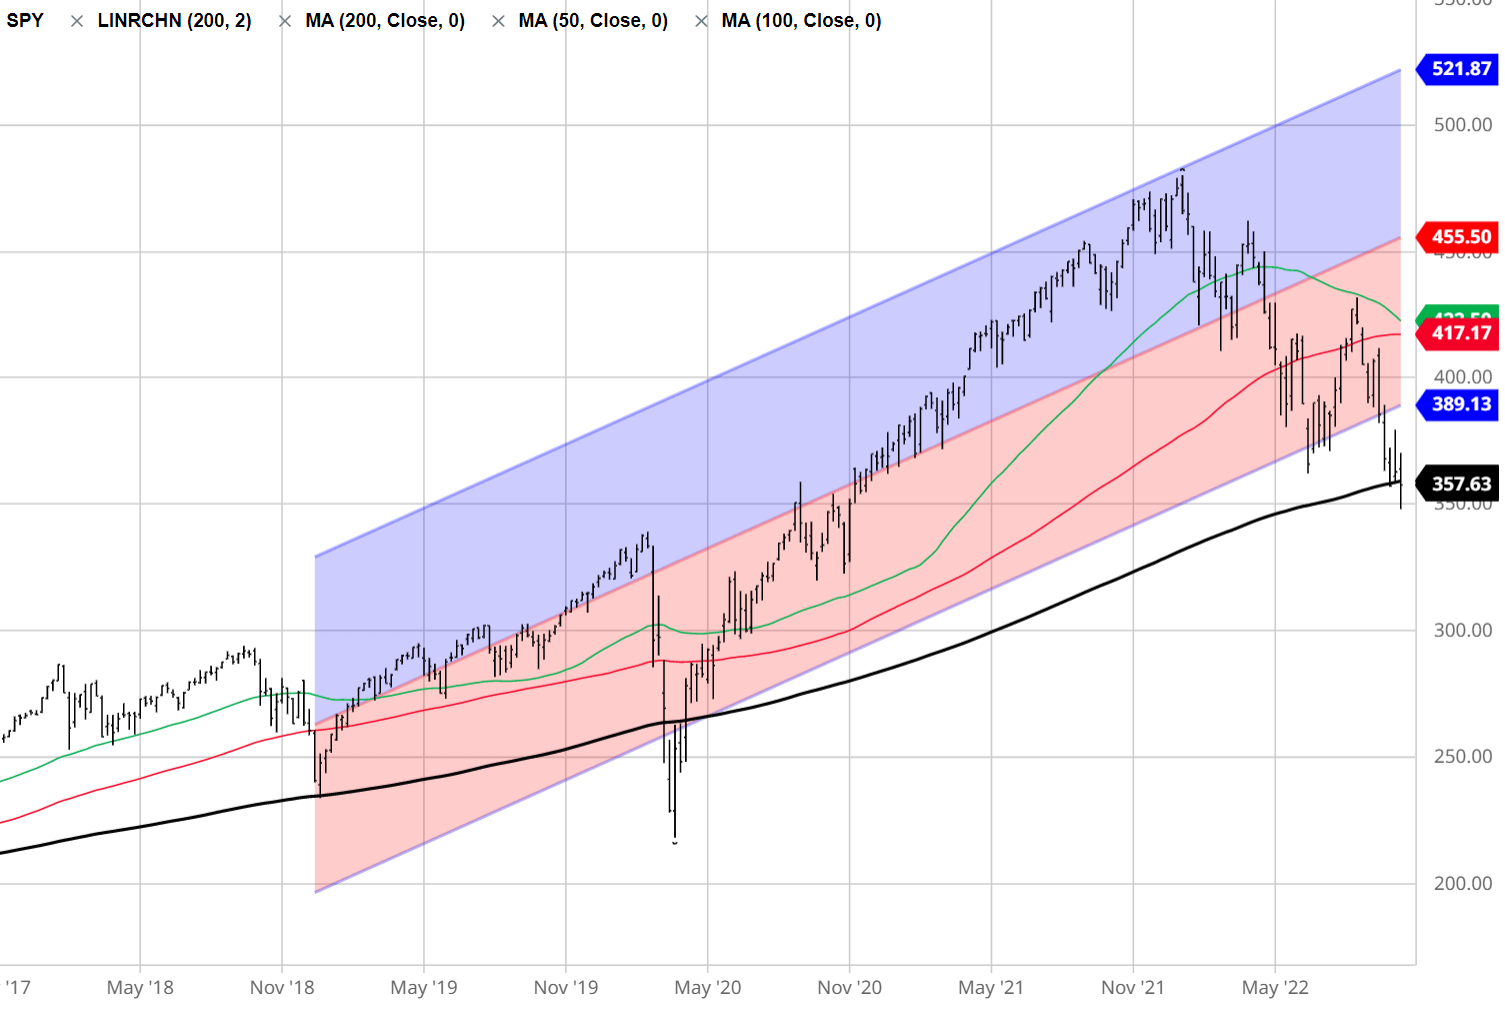
On the other hand, the support of the 200wma level, combined with the improvement in the fundamentals, such as the verified peak CPI inflation, could produce the buy signal. However, as I explained in this article, it’s very hard to expect any fundamental improvement at this time, and the “bounce window” is closing. Thus, my view on SPY is bearish.
Special SPY sector analysis
Over the last month, SPY is down by almost 10%. More importantly, all SPY sectors are down, led by Utilities (XLU) and Real Estate (XLRE) sectors, both down by over 18%. This tell me that the Phase 1 selloff, which was led by selloff in Technology (XLK) and Communications (XLC) and Discretionary (XLY) sectors, is transitioning to the Phase 2 recessionary selloff, and supports my bearish view.
Select Sector SPDR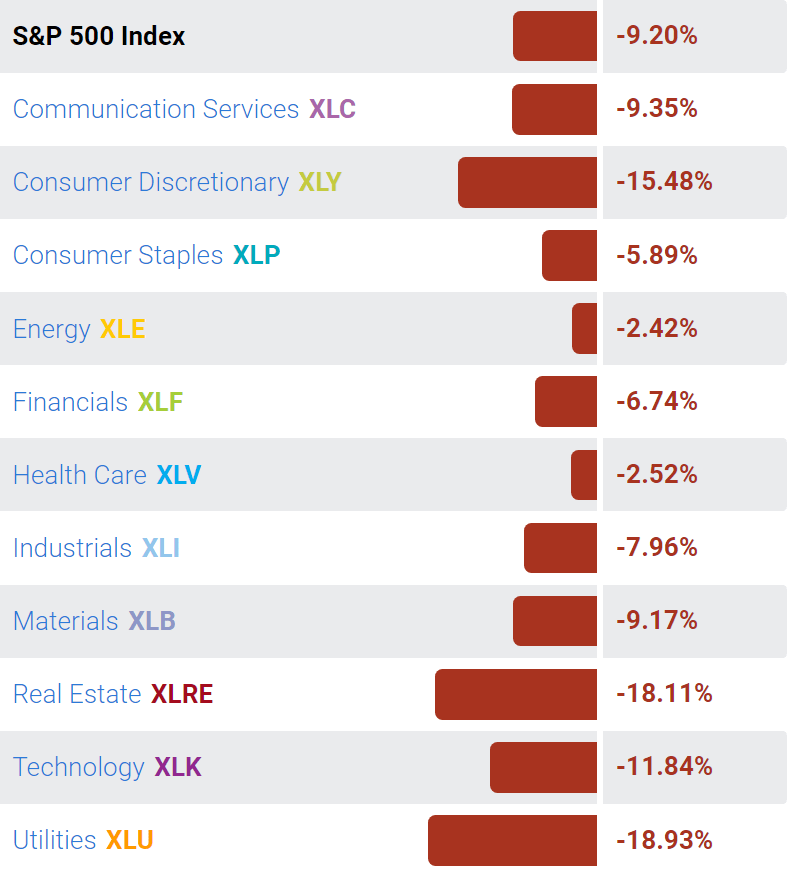
Be the first to comment