

CatLane/E+ via Getty Images
There are numerous optimistic and bearish hypotheses, and the majority of the arguments are credible; yet, over the past week, I have observed practically universal pessimism. The mood is very pessimistic. In addition, I analyzed the S&P 500 ETF (NYSEARCA:SPY) during the past few months and disclosed a bearish thesis. Since then, SPY has decreased by 10-12%, and numerous events have occurred. Now I am shifting my short-term viewpoint. Despite my medium-term pessimism, there is a chance of a short-term rally, since there are numerous excellent contrarian indications screaming in my face. However, I am not convinced to be bullish in the medium run since macro fundamentals would probably continue to deteriorate, and despite the inflation peak, I will reveal short-term bullish strategy.
Let’s start with real yields
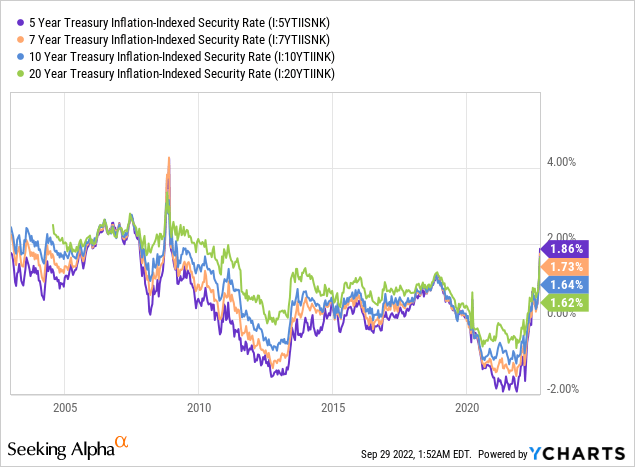
The rise in real yields is a key driver of stock market deceleration. However, as real yields rise, high beta stocks tend to decline the most, but also the stocks with lower beta. With a rise in real yields, the P/E tends to normalize and is getting closer to its long-term average. However, yields on treasury inflation-indexed securities reflect a great view of real yields with a wide range of maturities. While short-term ones (5 years) reached the highest levels since 2009, the 20-year ones are near 2011 levels. Despite the fact that the overall real yield curve is at the Fed’s target and in positive territory, the real yield market has never taken such an aggressive stance. I am strongly convinced that we will see a slight normalization rather than a continuing rise in both the nominal as well as real yield curves.
A similar aggressive move in real yields had been spotted in 2008 and then eased. Yes, I know, the macro cycle is a little bit different and the Fed also stated that it wants to see real and nominal yields higher and for longer. I will describe my viewpoint below.
The Fed is bad at forecasting
The latest FOMC meeting boosted both nominal and real yields, as the Fed revealed more aggressive tightening, primarily for the long term, than the market expected. The Fed now expects rates to be at 4.4% in 2022, 4.6% in 2023 and 3.9% in 2024. Now, let’s look at “how much do forward rates overshoot the terminal rate.” From the chart history, we have not seen such “overshooting” like that (in the case of spread). With that absolutely crazy guidance to remain “higher and for longer” as the Fed delivered. It makes sense to me that the Fed only wanted to deliver as hawkish message as possible.
The problem, as we all know, is that the Fed is usually a step behind in forecasting, as we have seen many times in history. So the current dot-plot and guidance show the Fed’s intention, but that’s all. In my opinion, we saw a peak in Fed Funds Rate estimates, which is the main reason why to bet on the bond market as well. At the end of the text, I reveal a simple strategy, which in my view is a clear opportunity. As confirmed by the chart below, the current spread between the projected and current Fed Funds Rate is absolutely high and will surely widen. Currently, I see a cap of 4.5% for the highest projected terminal rate.
How much do forward rates overshoot the terminal rate (Bianco Research L.L.C. CME, Bloomberg)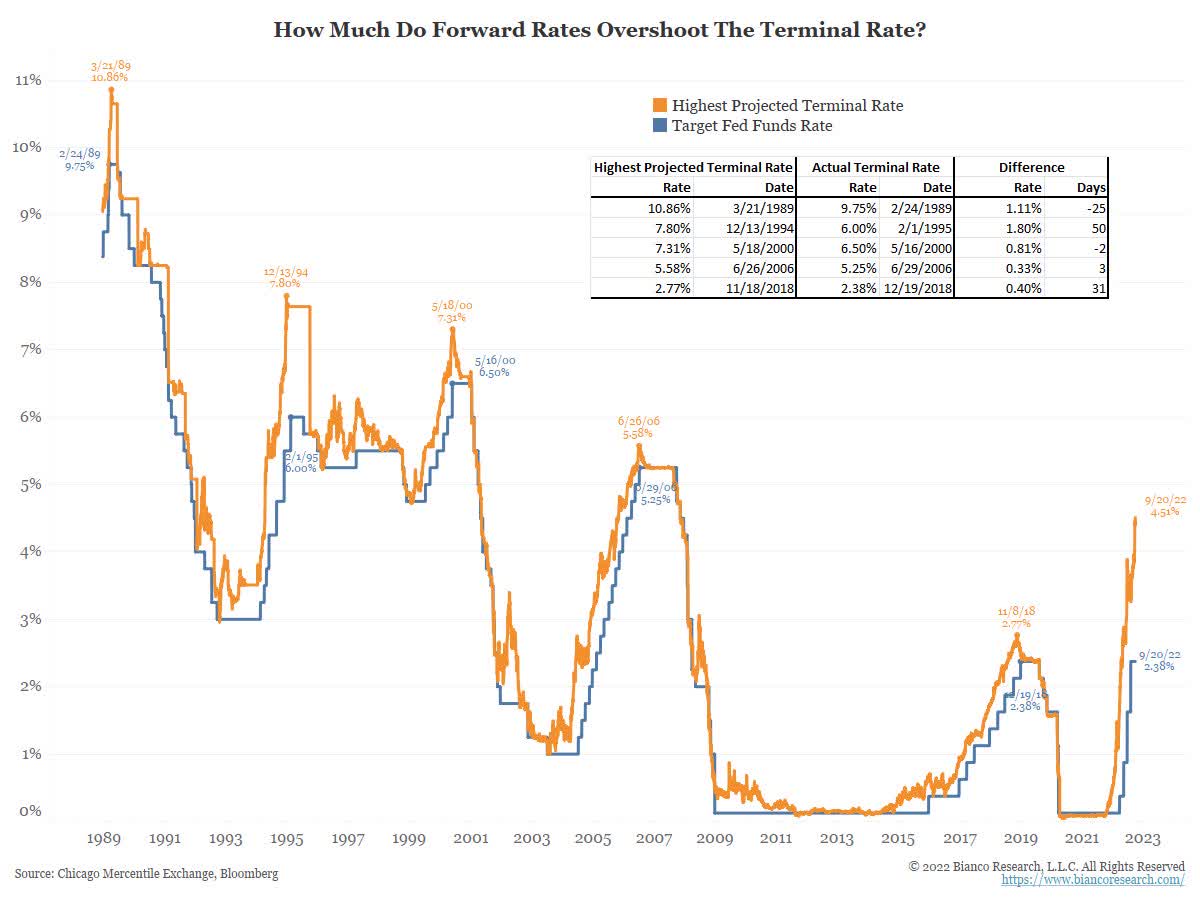
In the following chart, we can see FFR estimates based on FOMC projections and US03Y. The Fed is also very bad at projecting the inflation rate. This opinion is backed by the two following charts, which monitor every single FOMC projection from 3Q2020. Look at such different projections each quarter. In my opinion, the central bank was significantly underestimating the monetary and fiscal stimulus as well as, in my opinion, overshooting the tightening process. The question is what the possibilities are right now.
FFR estimates based on FOMC projections (Author´s calculations. FOMC projections)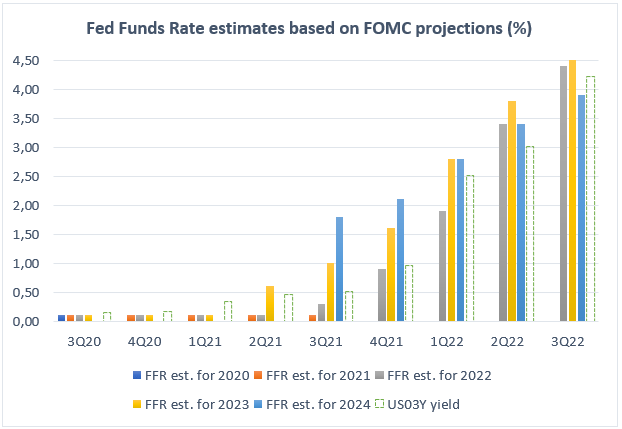
Despite J. Powell’s repeated statements that he wants to avoid the mistake of early easing in the 1970s, which led to a further inflation rally, I’m not convinced the Fed will be able to go so far above neutral. To be clear, I believe that such a hawkish message was intended to scare market participants into believing that they are serious about lowering inflation. I believe the Fed will be able to do this. As inflation has peaked (but much depends on monthly inflation contributions), the US03Y is above FFR 2024 and slightly below 2022/2023 projections. The market has fully priced in the tightening expectations of FOMC projections.
Core PCE estimates based on FOMC projections (Author´s calculation. FOMC projections)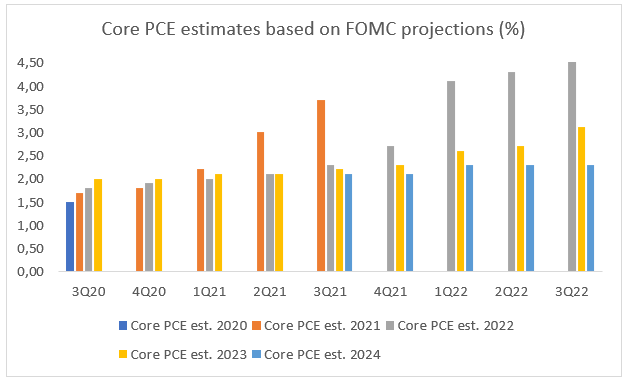
There is a trigger – Bank of England
The surge in yields worldwide, not just in the US but also in the UK, is causing absolute damage to government spending and deficits. Many countries, mainly in the UK and EA but partially also in the USA, need to spend so much money to overcome the energy crisis that will end with new bond emissions. There are two possibilities. To finance it, the participants and funds will demand a higher yield for such emissions, and debt servicing will become very expensive. The issue is that some pension funds got margin calls. The bonds (UK gilts) served as collateral in the repo market to raise some cash. As the price of bonds significantly dropped (50-75%), these funds did not have enough collateral to back and they got a “margin call”. The great explanation you can read here.
That is also the reason why BOE came into play. The other option is for further emissions to be financed by QE and to calm the bond prices (reverse upwards) to give some time to the pension funds to solve the situation. And that is exactly what happened in the previous days and days, which will follow. We are not talking about “risky” hedge funds, but about the pension funds and assets of ordinary people. This is exactly what the market participants begged for, and this step is to avoid financial instability. I’m convinced that this could occur to EA countries backed by the ECB. And if the Fed overshoots interest rates, this could become a problem in the United States as well. So, in my opinion, there is a clear cap for monetary tightness.
Inflation could drop faster than you think
There are two strong reasons why I believe this tightening will stop earlier than predicted by the Fed.
Firstly, the recession fear is so big right now, confirmed by the NY Fed recession indicator twelve months ahead. It consists mainly of yield curve leading indicators, which have historically been shown as great leading indicators for recessions. September’s data will be even worse as the yield curve (nominal or real one) significantly increased. The question is not whether there will be a global recession, but how severe it will be. The central bank needs to make big choices.
Recession probability measured by NY FED (NY FED.)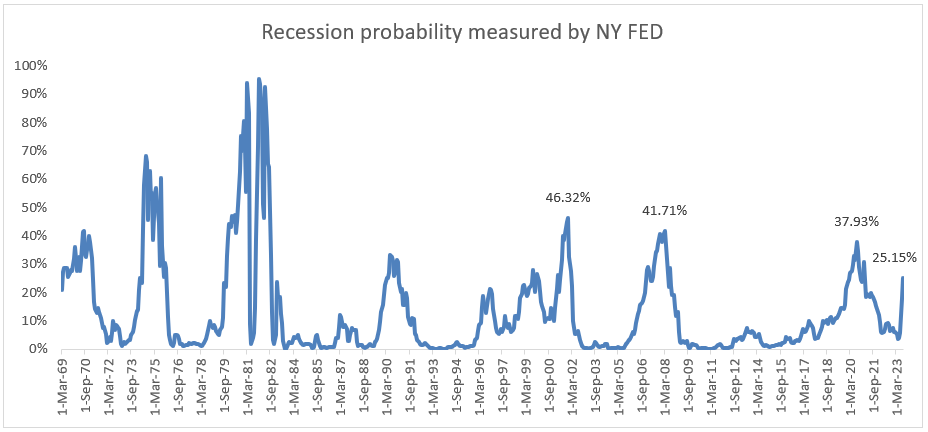
One thing is obvious. With such a combination of high inflation and rate hikes, both demand and supply-driven inflation will come down. I believe that’s the point. It could go down much faster than many people think. Market participants expect inflation to significantly calm down. Current inflation projections measured by inflation swaps are still quite high, but we really saw some nice progress and a reversal from June. Now, mainly from the short-term point of view, the market projects lower inflation forward than it did in October 2021 (via swaps).
US Inflation Projections via Inflation Swaps (@Ole_S_Hansen)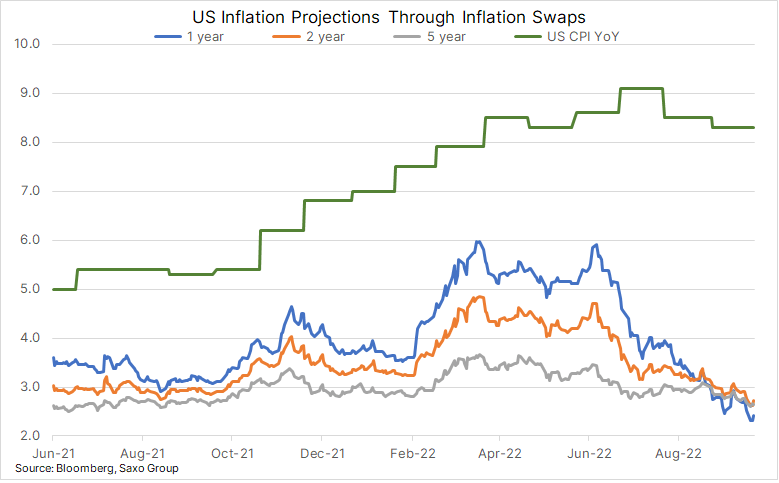
This is a crucial forward-looking indicator for the FOMC. Yes, they mainly react to the lagged CPI, where the most lagged part is rising shelter. But this chart is one of the strong reasons why I believe we saw a cap in dot-plot (in the case of high FFR estimates) and why, in my opinion, the further projections will be lowered. Lastly, I analyzed inflation scenarios, which suggest that in 1Q2023-2Q2023 we will see higher inflation > rates, thus rates won’t need to be as high and long as the Fed currently projects (in 2023 and 2024). Consider such scenarios. Even if the monthly inflation contribution is 0.1-0.3%, the YoY inflation will be below the current pricing of Fed Fund Futures. Confirmed by inflation swaps, this is a strong contrarian narrative to be bullish about, as the Fed will most likely pivot when rates are above YoY inflation. The current market participants do not get it.
Potential Paths for YoY CPI Based on Constant MoM Changes (@bespokeinvest)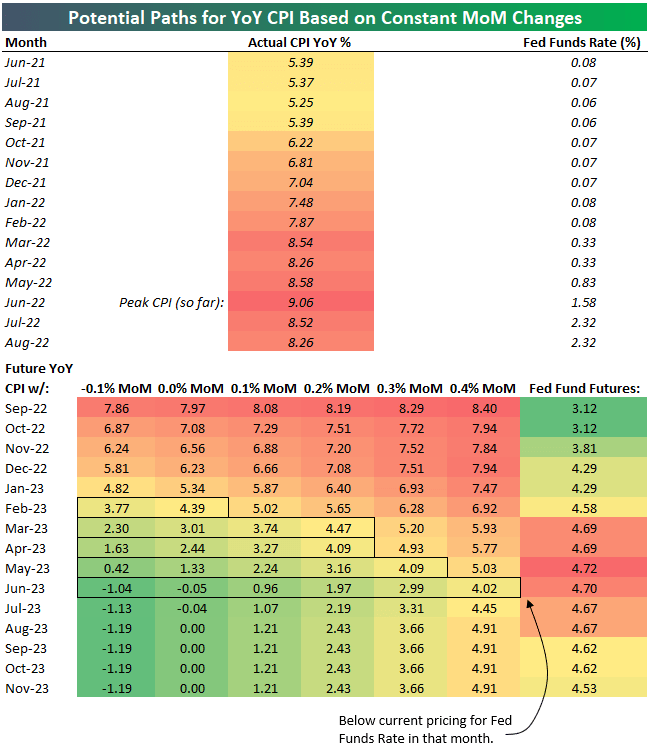
The second reason why the Fed could pivot is that the FOMC could overshoot the tightening. Recession odds are now quite high (and we don’t have the most actual data). I know the FOMC mentioned several times that they would continue to hike even in a recession. But history tells a different story, and the case of the Bank of England currently confirms it. There is some “inflex-point” between what the economy could handle and what it could not. It’s very hard to determine what the point is, but it mostly connects to neutral rate. The neutral rate can be hard to count directly, but in my opinion, the best interpretation is its long-term projection rate in the FOMC projections.
The issue is that once the current or expected FFR gets above the neutral rate, it is very dangerous because it is an “inflex-point” and something in the economy can easily break. It’s not a good scenario to sit there for longer. It tends to decrease during the time horizon as the total debt is increasing and the economy faces demography issues. However, it also increased over time, as inflation is higher. The longer run for FFR increased to 2.65 in September from 2.5 in June. We have a lack of data, but theory is like that. It’s okay for the FFR to be above the neutral rate for some time to calm down inflation, but it is risky to be there in such a manner as the Fed revealed in the latest projection. It is also the latest argument why I do not believe the FFR will be at 4.9% in 2023 and 3.6% in 2024.
Fed neutral rate vs. US02Y (FRED)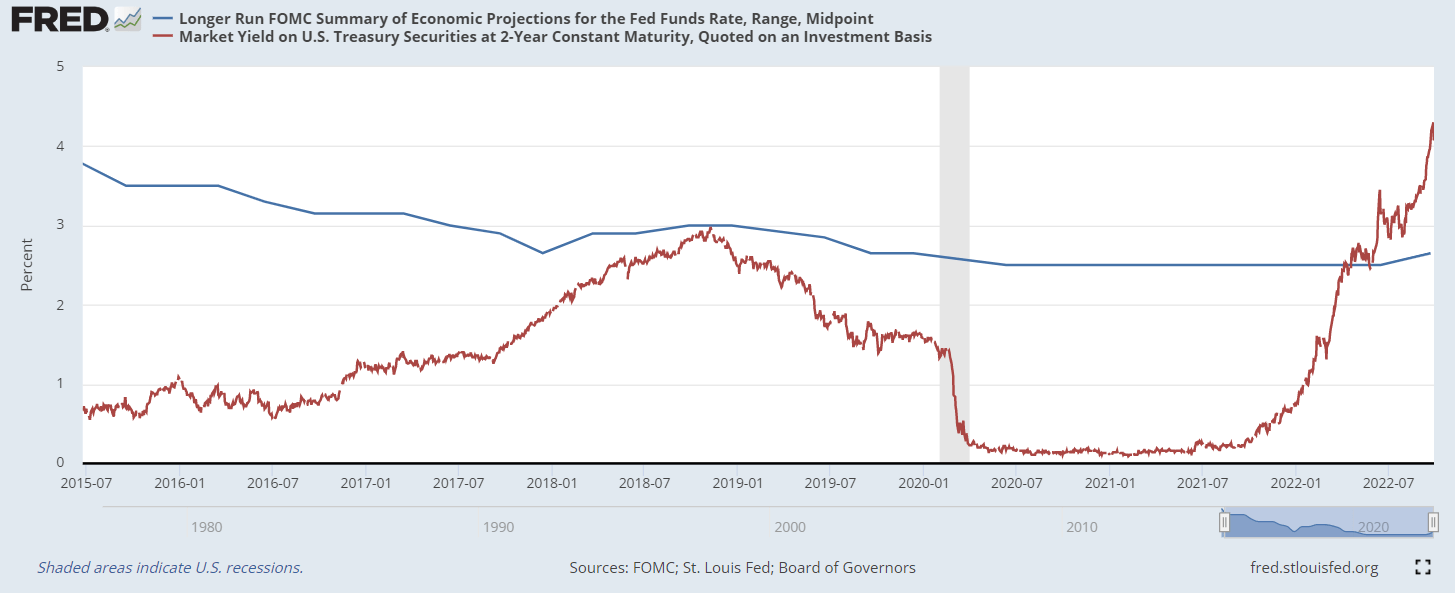
Margin contraction is expected to continue
I understand why the sentiment is bearish. I also believe that in the medium term we can see further contraction. Despite forward-looking indicators in the case of inflation revealing a negative trend, now it will push the market down from different sources. In my opinion, we also saw medium-term highs in real yields and a slight deceleration could push the stocks up. The “forces” which I’m talking about are EPS, which could merely drop because inflation comes with pain. Due to still increasing payments for debt due to increased interest, there is less money in the pocket for spending.
With the combination of still rising prices, it is an absolutely bad situation for EPS. There will be margin contraction as increased costs, on the one hand, will reduce the margins, and on the other hand, consumer demand will ease as every service goes up in price. The next reason is more expensive debt service for companies, which will also harm the margins. There will be an EBITDA margin contraction, which will lead to lowered EPS to the point where once again the supply side will deliver cheaper products. It has already started as many commodities slumped. Further decline, in my opinion, will follow. In the case of services, it is more complicated, but also subtle improvements can be noticed. Service prices could go up and take longer to change because of secondary effects of inflation. This is especially true now.
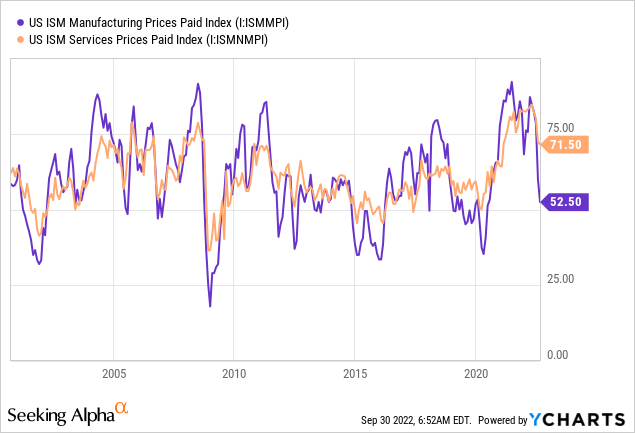
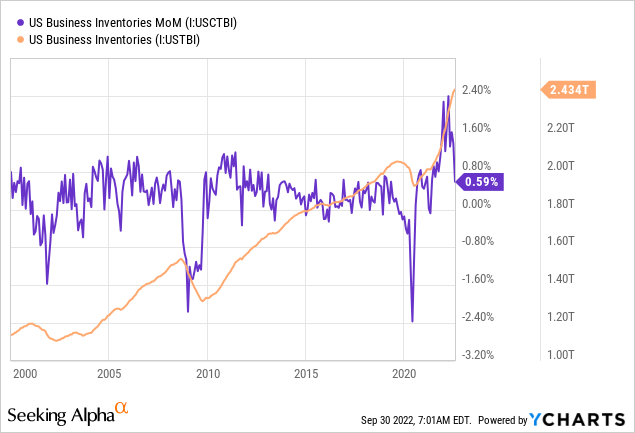
When we look at the general inventory levels, they also reflect the current macro cycle. The absolute level of inventories seems to be at an all-time high, and MoM change is still positive, while a deceleration in growth is notable. To get rid of such high levels of inventory on their balance sheets, companies will probably have to sell the products for less than they are worth right now. This could lead to discounts instead of more price pressures. But this process could also be another contributor to the margin contraction.
The sentiment is very bearish
Sentiment is absolutely bearish in many ways. The market priced in already high real yields, further EPS drops, and geopolitical risk. However, every situation can be much worse, and that is the key risk of this thesis. EPS can fall more than the market expects, inflation cannot slow, but it will, in my opinion, with great certainty. The housing market can crash, people can start to panic, and even geopolitical situations can get much worse. However, from the short-term view, I see the market as very oversold, totally exhausted, but despite that, I see the light at the end of the tunnel. For the reasons stated above, I’m convinced of a faster drop in inflation and then a faster Fed pivot. However, in the medium term, I see some risk as justified. In the short-term, there are signs that bears are exhausted. I’ll try to argue with each of them and deliver a clear message about why I see the market very differently right now and see short-term upside potential.
One of the strong bullish narratives is exactly the opposite one from when I revealed the bearish thesis in August. I look at the short-selling activity across SPY and its 10-day moving average is at 2022 extremes (just the extremes in the COVID bearish rally in 03/2020 were higher). At such levels, the market just needs a bullish trigger for most of the shorts to be closed, as we saw last month. However, I’m not convinced we will see a 20-25% rally out there, but a possible move of 5-10% upwards should be a good target.
Short-selling activity vs. SPY price (Author via Tradingview)
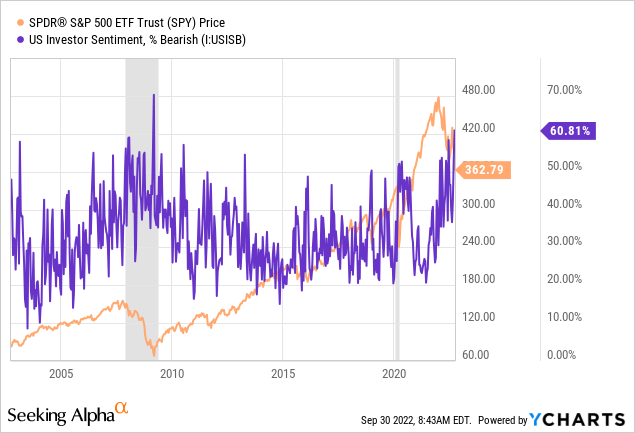
The second bullish and contrarian narrative stands behind the absolute bearish outcome of the AAII survey. Currently, there is the most bearish sentiment since 2009, when the total percent of bears is at 60.8%. This indicator, mainly monitored at extremes, leads to contrarian short-term moves. It also supports the short-term bullish thesis.
One of the most precise indicators, which reflects the short-term exhaustion, is the “percent of stocks above” 20/50/100/200-Day Average. It depends on the time horizon we want to analyze. And in the short-term, the 20/50-day moving average says that there are just nearly 11-12% of stocks above the 50-day moving average. Yes, the risk is that it can go lower, but it can also be considered as very extreme levels, which is also a great contrarian indicator.
Percent of Stocks Above 50 DMA (Tradingview)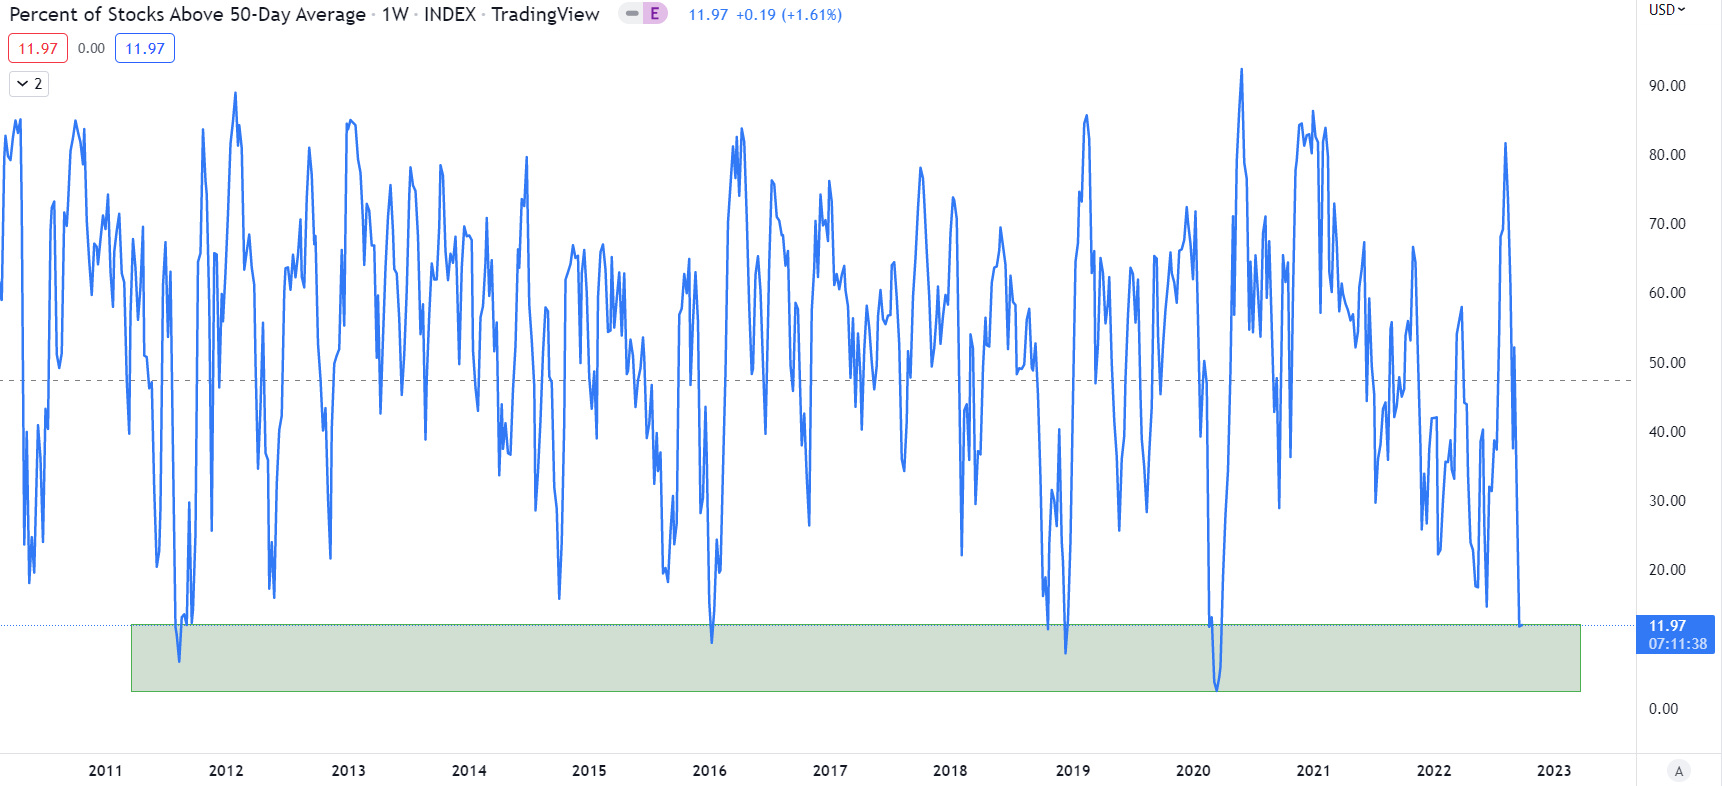
The following market positioning dataset is from the COT report and is based on S&P 500 futures. We keep an eye on non-commercial levels because they reflect a hedge fund’s positioning. And according to COT, they are mostly bearish, but not as bearish as in 2008/2009. However, as we can see from the chart, such positioning at similar extremes reflects a great medium-term reversal opportunity. The medium-term message from this chart is that hedge funds are bearish. It can be considered a contrarian sign in the medium term, but not as accurate as we revealed before. The issue is that there are many risks the market can face right now, and just positioning can still get more negative. However, it is also very good to look at what the big players are doing.
S&P 500 and Non-commercial positions (COT) (Author via Tradingview and COT)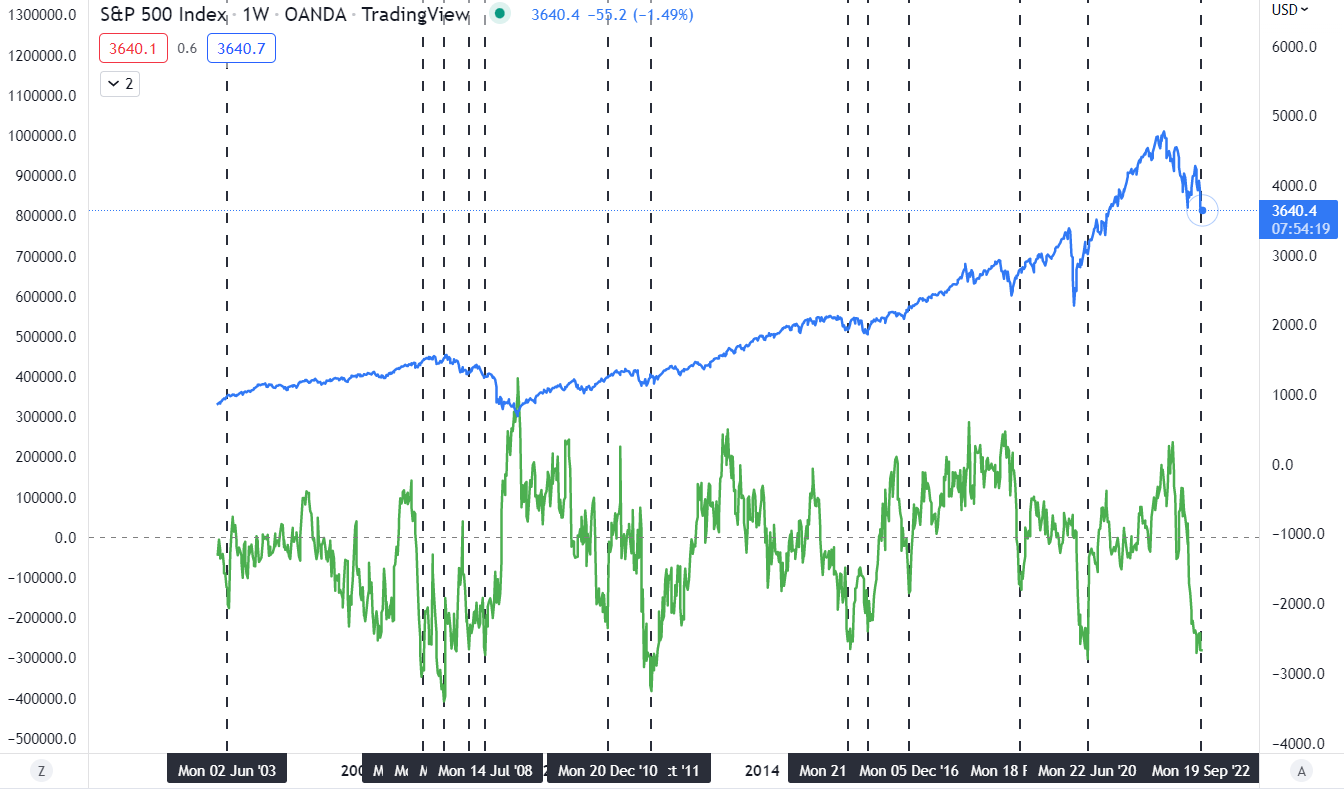
The last calculation (chart) provides the outlook of the very short-term market exhaustion measured by “number of days above/lower average”. In this scenario, we look at the short-term moving average, which is 30 DMA. The current 30 DMA for SPY stands at 394 USD, and the current price is 360 USD. The number of days below our average currently stands at 24, which is not the highest, but quite high. The more days the market will trade below its moving average, the higher the probability of a short-term reversal with the expectation of a reduction in the spread between short-term MA and price.
SPY and potential of short-lived rally (Author´s calculation)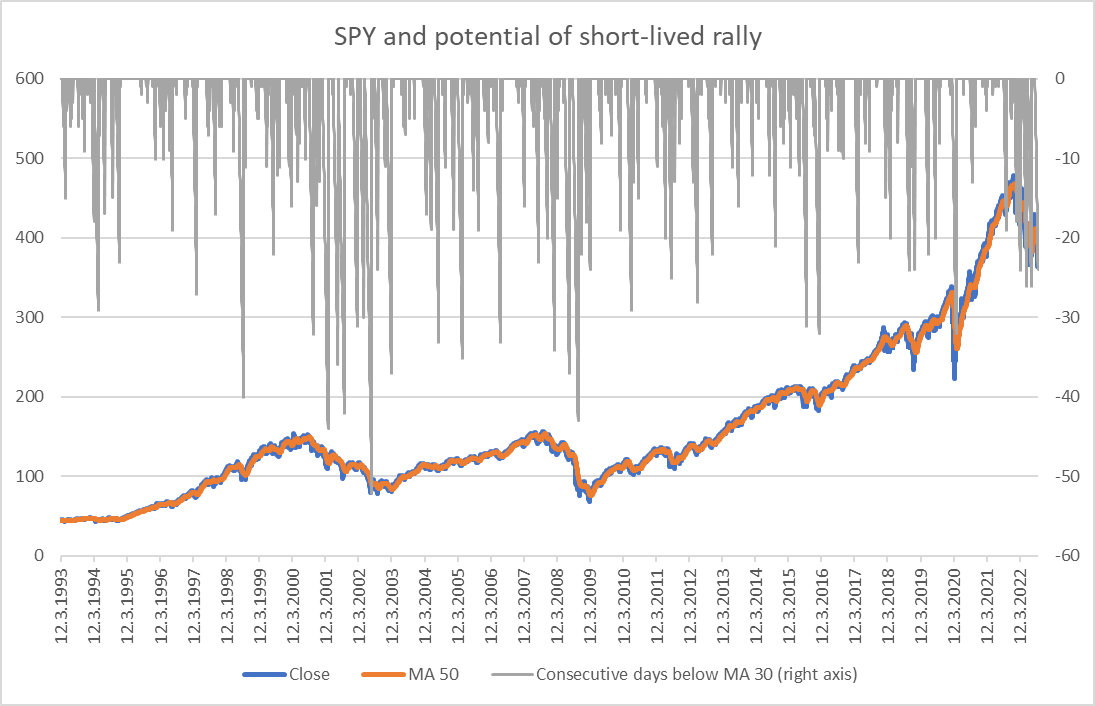
This analysis’ most recent implication is to calculate the percentage spread between price and MA (30) as a percentage of SPY price. I examined the area, which represents a very rare and rare bullish opportunity. This concept is based on the contrarian move, which means longing the market after a solid contraction and selling it when we are sufficiently above the short-term average. A very strong bullish opportunity can be spotted mainly in the last cycles of the bear market of 2002 and 2009. The odds of such a move are extremely low, but the potential of such a trade could be great. On the other hand, our examined opportunity, called “rare bullish opportunity,” is more likely to occur and the price could reverse in the short-term. SPY trades in such an area right now. The idea of the trade is based on the reduction of the spread between MA30 and the S&P 500 price.
Percent spread between price and MA (Author´s calculation.)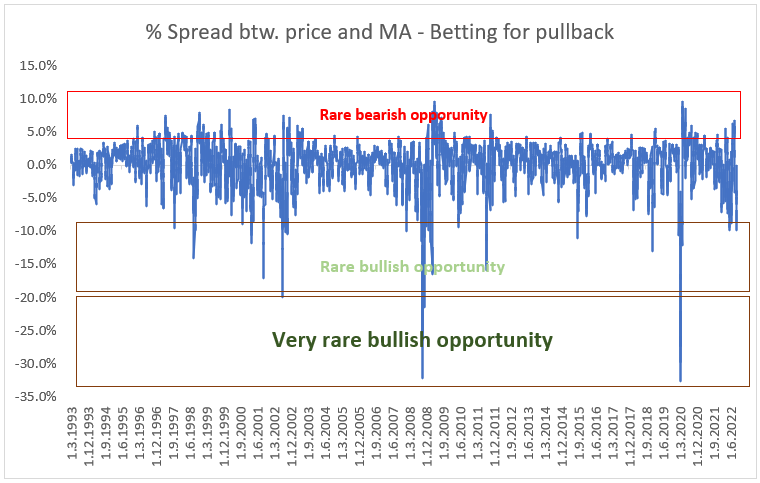
Summary and risks
I’m aware of negative sentiment and the risks to the overall economies with the current tightening cycle worldwide and current geopolitics, which could lead to further index declines. In this market cycle, we could see a solid destruction of all the markets. But many of them have already faced it. Look at the bond market and the stock market too. The real estate market reacts with lag, but I expect that we will see a price decline there as well.
Despite that, I see overshooting of monetary policy as well, which could lead to a hard landing, but I believe it will surely lead to an inflation calm-down. I firmly believe that inflation will be successfully bridged down more quickly than the market currently expects. In the medium term, I don’t have any idea where the market can go. It can go down as the situation could get worse due to EPS and margin contraction, and it can go up if something in the economy breaks and the Fed pivots. In my opinion, we will see a Fed pivot in 1Q2023-2Q2023 for the reasons mentioned in this analysis.
Back to our strategy and why I see the market as bullish in the very short-term. I monitor that there are many bearish bets, which can be noticed via short-selling activity or via the COT report. There is room for short-covering, as we saw in August, if some positive trigger gets into the market. According to my analysis, I see a solid deviation from normal in the case of “number of days” below our 30 DMA, which is a highly contrarian indicator. Moreover, I noticed there is an -8.9% spread between MA30 and the SPY price. In selected areas, it was, in historical concept, a very accurate contrarian signal.
The risk of such a strategy is enormous as the market could still drop even more. Risk management is crucial here. The further negative trigger could cause the market to drop, but it would deepen the view of this strategy to even more rare levels, which would be bullish. This is a more short-lived strategy than a medium-term outlook. In the medium term, my point of view is mixed as I see some improvement in the inflation outlook and do not believe the Fed will keep the words. But on the other hand, more pain could come mainly from EPS and margin contraction. But when it comes to holding and investing for the long term, these levels I consider as a bullish.
Editor’s Note: This article was submitted as part of Seeking Alpha’s best contrarian investment competition which runs through October 10. With cash prizes and a chance to chat with the CEO, this competition – open to all contributors – is not one you want to miss. Click here to find out more and submit your article today!
Be the first to comment