

Bitcoin, BTC/USD, Ethereum, ETH/USD Talking Points:
- Crypto appears relatively calm at the moment, as both Bitcoin and Ethereum hold on to bullish breakout potential with varying degrees of near-term strength.
- Bitcoin has continued to soften under the 60k psychological level after last week’s failed breakout test. Ethereum, on the other hand, appears a touch more bullish as prices have bounced from a prior zone of interest, with prices back above the 2k psychological level.
- The analysis contained in article relies on price action and chart formations. To learn more about price action or chart patterns, check out our DailyFX Education section.
Bitcoin continues to coil under the 60k psychological level after last week’s failed breakout. And that wasn’t the first failure at 60k, as there’ve been at least two other separate tests since price action pulled back below that line in the sand in mid-March.
As looked at on Tuesday, this keeps the door open for bullish breakout potential. Eventually, with bulls remaining persistent, that 60k level could be taken out as the cryptocurrency challenges the all-time-high set less than a month ago. But, for now, price action is coiling with the big figure looming ominously above.
But, also looked at on Tuesday was Bitcoin beginning to build-in similar to an inverse head and shoulders pattern. As I had opined, the shoulders were lacking, but given the quick return to 60k combined with the recurrent test, a similar type of theme was beginning to show.
To learn more about the inverse head and shoulders pattern, join us in DailyFX Education
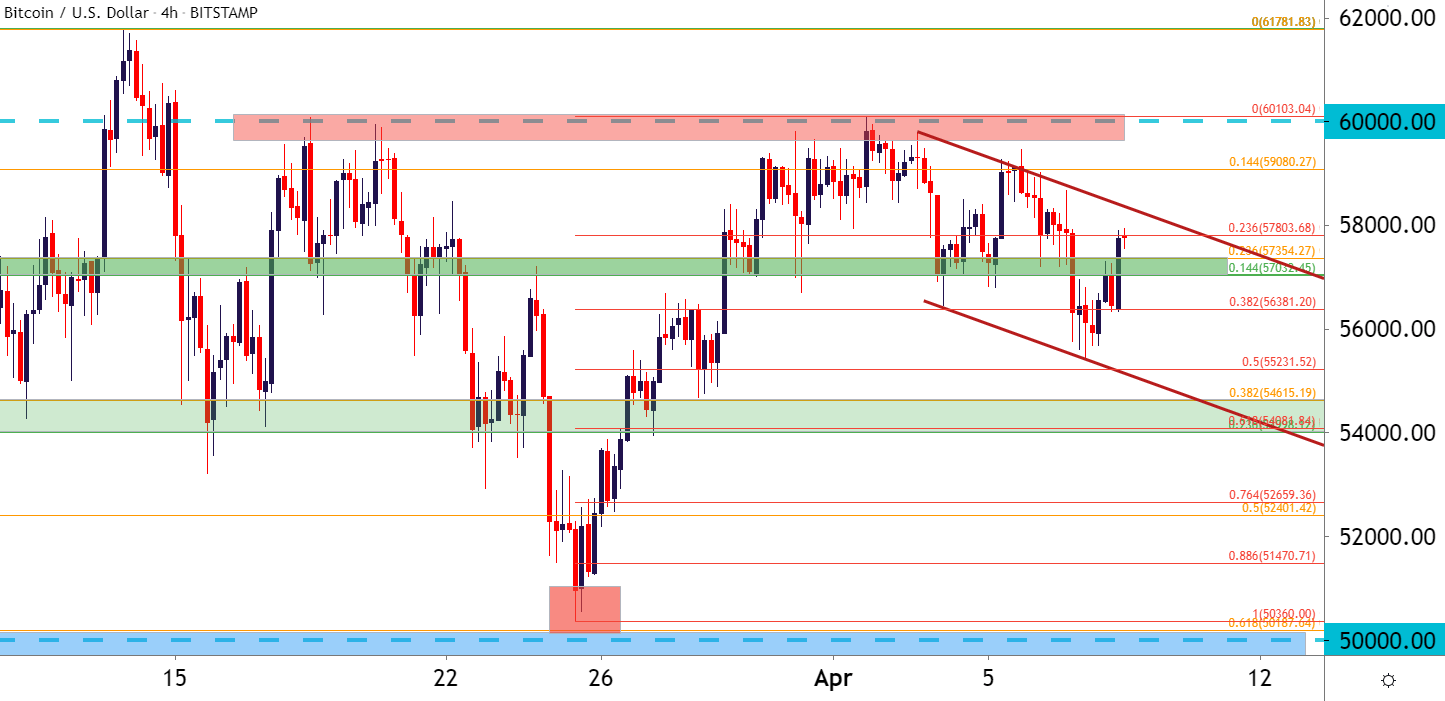
Since that last article on Bitcoin, BTC/USD has continued to pull back; but now there’s possibly another bullish quality as that pullback has shown in a rather orderly fashion, creating a bearish trend channel. And when that bearish channel is combined with the recent bullish trend, sparking from the support test two weeks ago, this could be looked at as a bull flag formation.
To learn more about bull flags and how to work with them, check out DailyFX Education
Bitcoin Four-Hour Price Chart
Chart prepared by James Stanley; Bitcoin on Tradingview
Contingency Plans
Should prices continue to coil and pullback, we may end up with a cleaner inverse head and shoulders pattern, which would similarly be bullish. On that front, there’s another support zone of interest, spanning from around 54k-54,615. A pullback to and hold of support there may give us the right shoulder we need to confirm the inverse head and shoulders pattern.

Recommended by James Stanley
Get Your Free Top Trading Opportunities Forecast
Bitcoin Eight-Hour Price Chart
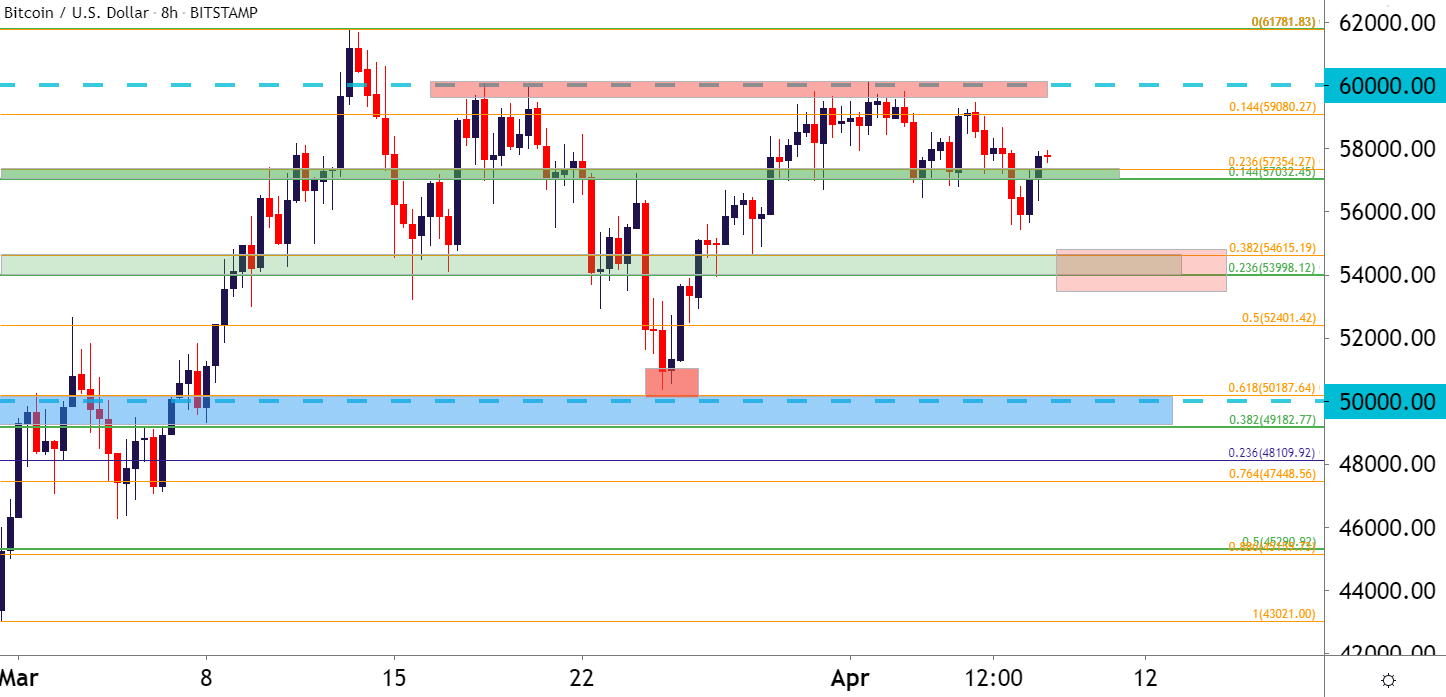
Chart prepared by James Stanley; Bitcoin on Tradingview
Ethereum Back Above 2k, Threatens Fresh Highs
At this point, Ethereum (ETH/USD) looks a touch more bullish to me. Similarly, prices pulled back in mid-March before developing into a range. That range breached to the downside, with prices finding support at a key trendline, highlighted below in green.
To learn more about trendlines, check out DailyFX Education
After that trendline inflection, bulls were on parade as prices jumped right back to resistance, and soon punched through the 2k psychological level.
Ethereum (ETH/USD) Daily Price Chart
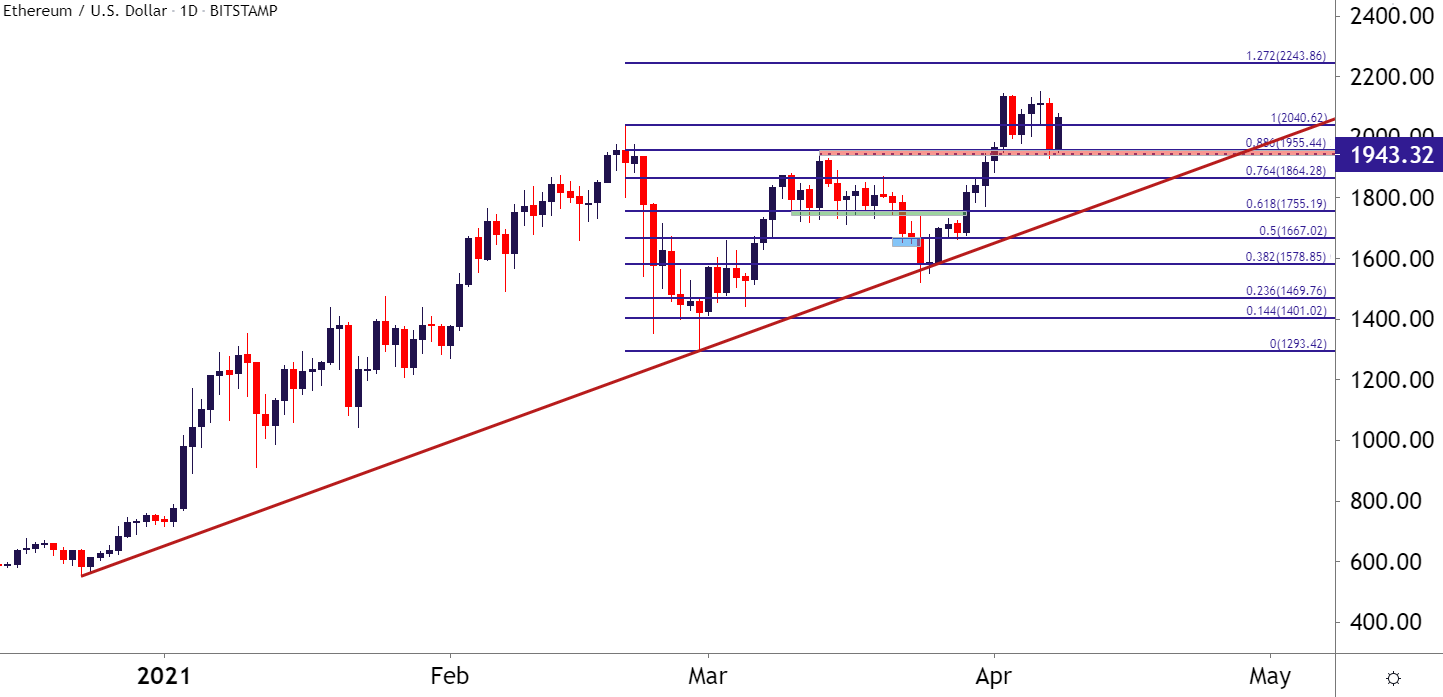
Chart prepared by James Stanley; Ethereum on Tradingview
What makes this appear more bullish to me is the recent reaction to this very key zone of prices. I had written about resistance in Ethereum at 1943-2000 in late-March, and prices broke above this level around the Q2 open.
And yesterday saw a significant amount of grind at that level until bulls were able to prevail, pulling prices back above 2k. This keeps the door open for bullish breakout potential upon prints of fresh highs. In the interim, traders should be cautious of getting caught at a lower high as we’re seeing a bit of short-term resistance around prior swing support.

Recommended by James Stanley
Forex for Beginners
Ethereum (ETH/USD) Four-Hour Price Chart
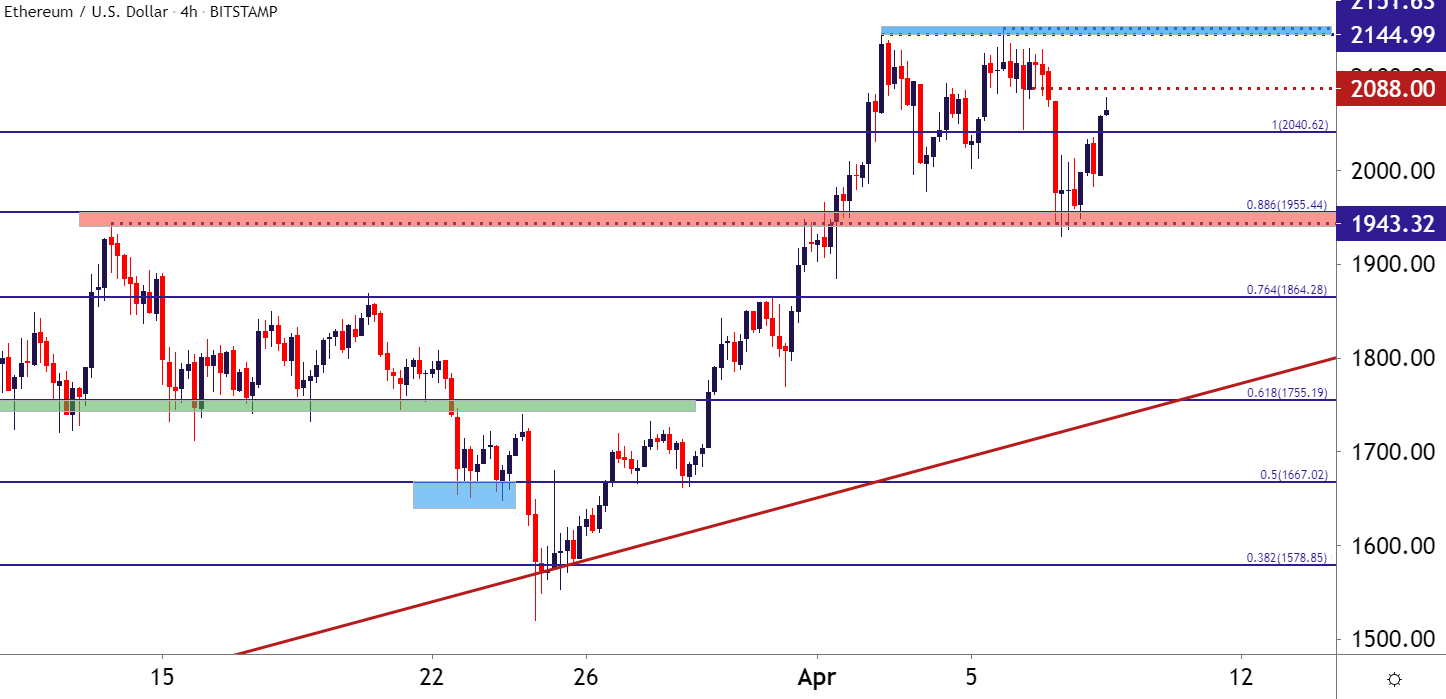
Chart prepared by James Stanley; Ethereum on Tradingview
— Written by James Stanley, Senior Strategist for DailyFX.com
Contact and follow James on Twitter: @JStanleyFX
Be the first to comment