

R.M. Nunes
Thesis
The goal of a long-term dividend investor is to invest in firms that have a high likelihood of maintaining growing dividend payments throughout the investors lifespan (perpetuity). JPMorgan Chase & Co (NYSE:JPM) has moved into “Buy” range with the possibility of moving into “Strong Buy” range if this bearish market continues pressuring equities down. Utilizing the quantitative methods demonstrated in this article support buying into the current negative movement as a contrarian investment.
Introduction
JPM has underperformed the S&P 500 with a total decrease of almost 35% YTD (Figure 1). The large negative sentiment and economic pressures this year have been affecting JPM and the larger financial markets. Fortunately for dividend investors, this creates opportunity for contrarians to establish or reinforce long-term focused positions securing their investment returns into the future.
Figure 1. JPM price return vs S&P 500 YTD (Seeking Alpha)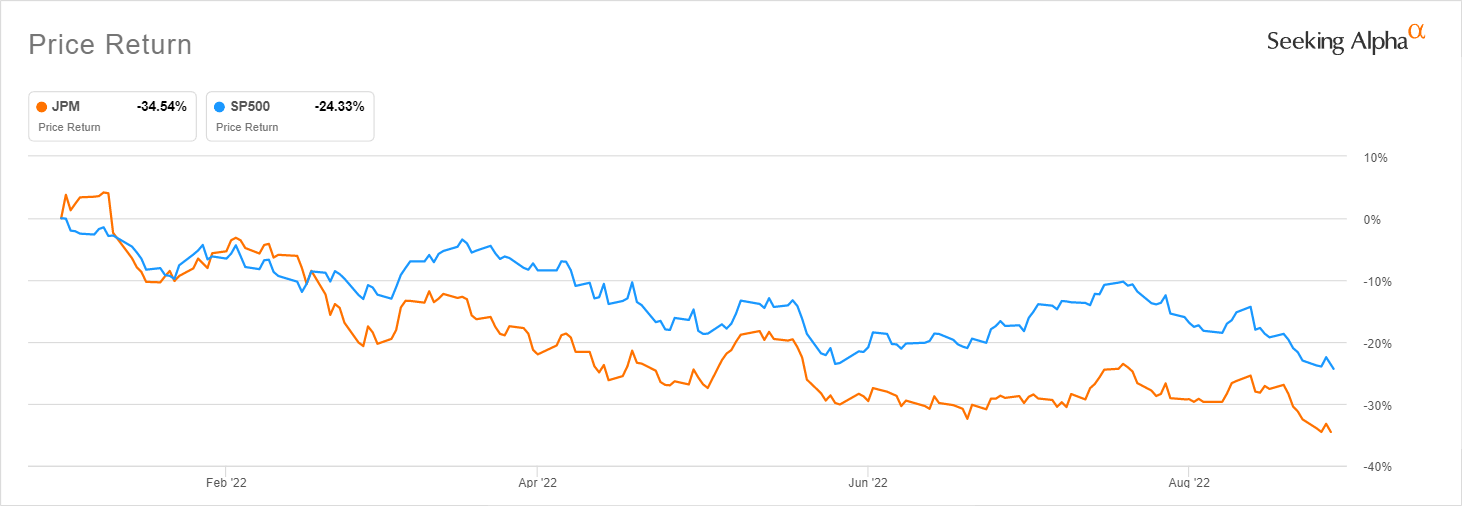
Intent
The intent of this article is to value JPM for long-term dividend focused investors. Investors can utilize quantitative methods augmented by investor expectations to determine a purchase price for JPM. To accomplish this, we will analyze historical data and perform Monte Carlo simulations to determine dividend growth rate expectations for multiple scenarios.
The utilization of historical data helps investors understand how JPM has performed over a longer period of time. Combining this with a Monte Carlo simulation allows for a virtual representation of future outcomes. The Monte Carlo simulations for this analysis are performed by creating a random sample of 5,000 data points based off historical inputs and predicting what a randomized future may look like for JPM investors.
Focusing on the Dividend
JPM is often showcased as a good dividend stock by many dividend focused investors. JPM is known as a dividend contender meaning it has increased its dividend every year for the past 10 years. They have maintained a dividend since 1973 while varying the growth and also having dividend cuts through financially turbulent times. JPM showcases a strong dividend grade according to Seeking Alpha (Figure 2) with a phenomenal 5 year growth rate and a very healthy payout ratio. This showcases a great starting point for dividend investors and portrays potential consistency for short-term to mid-term returns.
Figure 2. Dividend Scorecard (Seeking Alpha)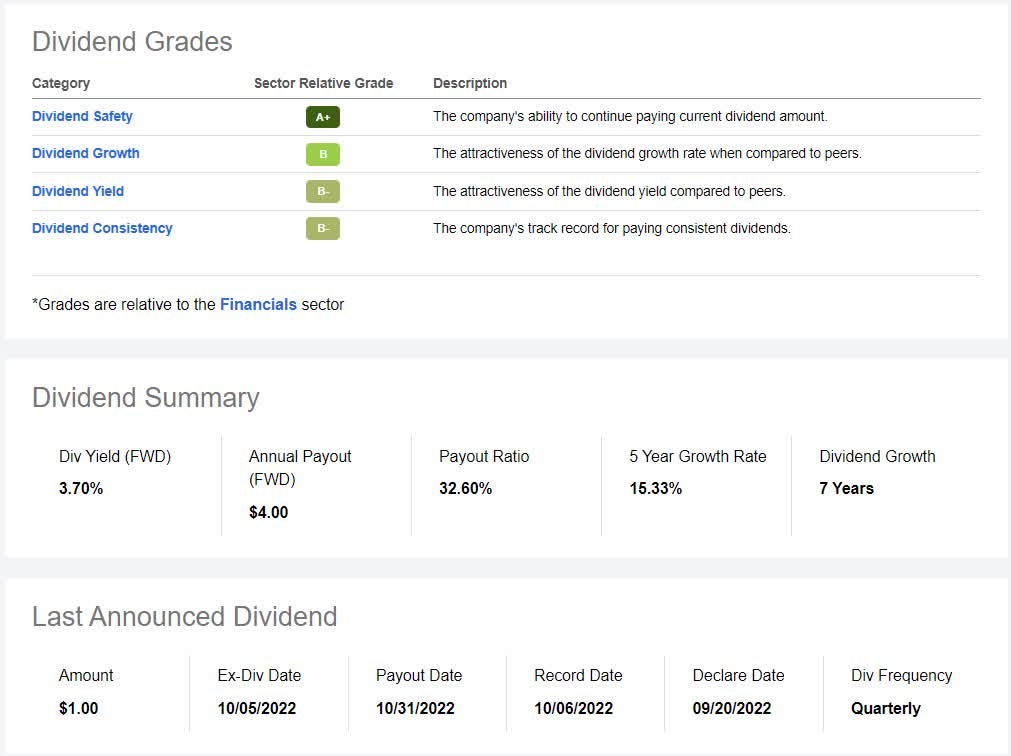
As a long-term investor, the focus is on holding a firm in perpetuity (excluding any catastrophic events). While utilizing short term scorecards is a beneficial starting point, the focus on long-term investments makes dividend performance over longer periods of time more challenging to predict and increases uncertainty for the future. Fortunately, with statistical models and conservative assumptions, investors can increase their likelihood of success.
The Dividend Statistics
The first step in modeling the future dividend of JPM is to analyze their historical performance. The dividend data in this analysis was pulled from the JPM dividend history on the firms website (Figure 3). There are notable observations that can be made from this data and the causes of the variance in JPM would have to be researched further. Between 1973 and 1980, the dividend remained very constant while the early 1980s were a fairly volatile time for the dividend which experienced large percentage changes. The first half of the 1990s experienced a decrease in dividends followed by large variance in dividend growth rate eventually becoming more consistent until 2008. 2009 through 2011 were challenging times for the financial sector as represented in the JPM dividend during that time period. Since its low in 2010, JPM shareholders have experienced exceptional dividend growth into the present times which has helped strengthen a reputation as a reputable dividend firm for investors and is well showcased in the Seeking Alpha Dividend Grade. It is important to observe these historical trends and note that the business of JPM has altered and developed over this representation of time.
Figure 3. JPM annualized dividend history (Author)
Moving forward into analyzing this statistical data creates two potential scenarios using Monte Carlo simulations relevant to dividend focused investors.
Scenario 1
The historical dividend data can be an important tool for analyzing potential future scenarios. The first step in the analysis is to determine the historical annual growth rate (Figure 4). This figure shows all of the growth rates through JPM’s dividend history from 1973 until 2022. It clearly shows that there have been extreme variations when the dividend was cut and reestablished. A good representation of the issues with this variance is the difference between the mean and median of the growth rates which are 13.82% and 4.82% respectively. This represents a large right skew since there are such large values on the positive side which signifies that the mean is not likely to be as accurate as the median for inputs. Also note that the standard deviation is 55.3% with a 95% confidence interval between -2.1% and 29.7%. This means that 95% of the historical data should fall between those values and the large standard deviation suggests a very large potential range of outcomes.
Figure 4. JPM annual dividend growth rate – Scenario 1 (Author)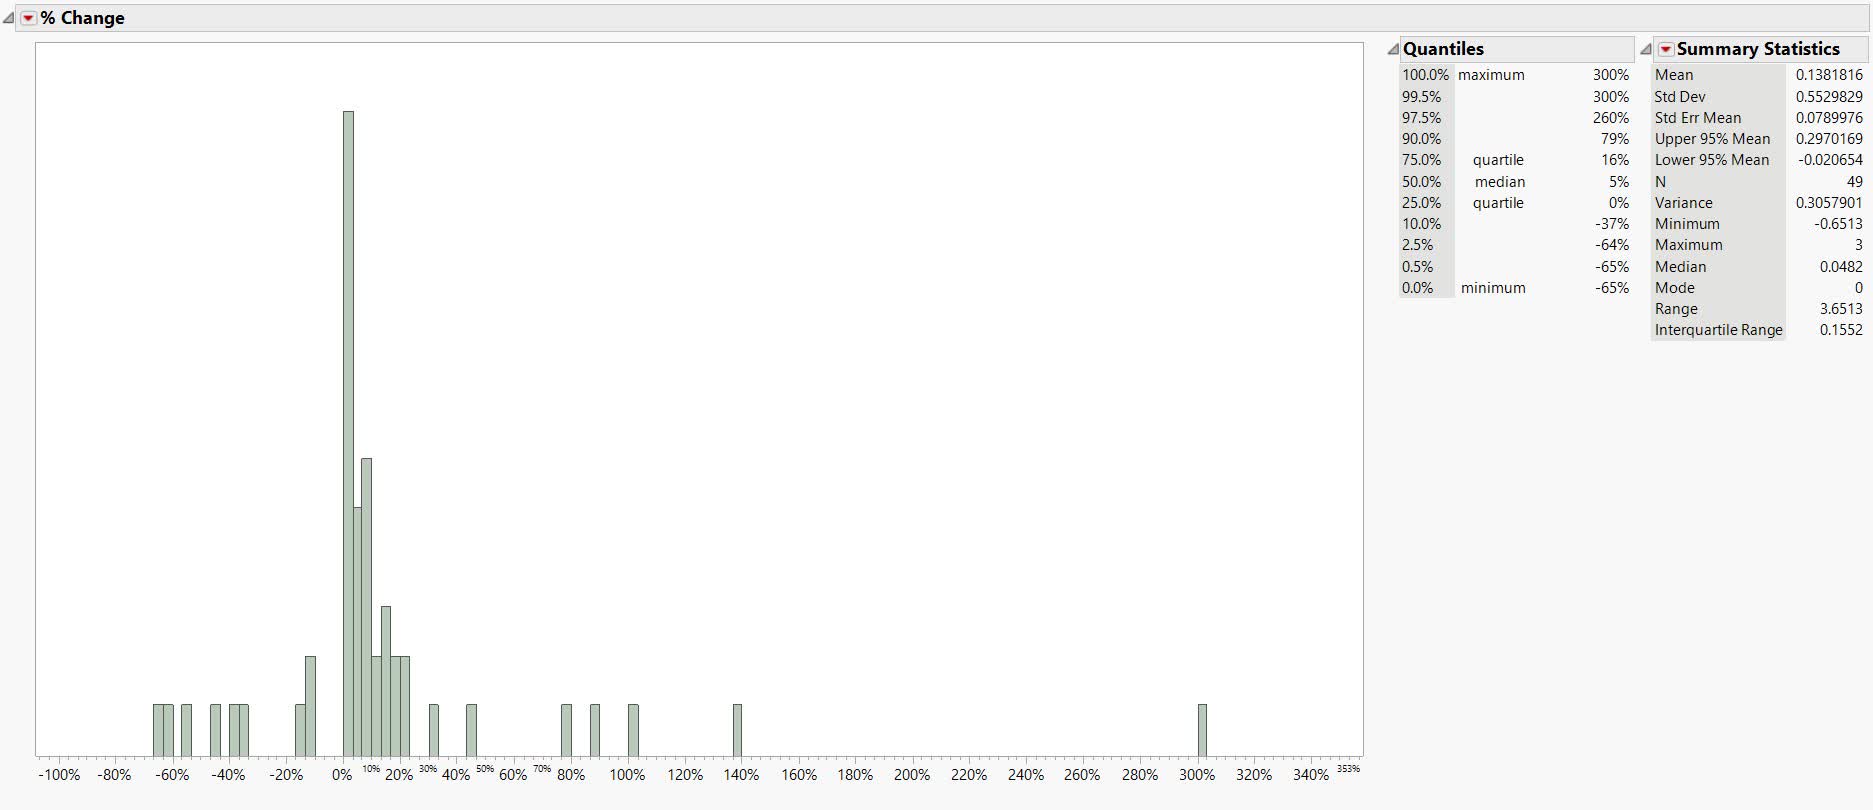
The Monte Carlo simulation for Scenario 1 inputs the median and standard deviation from the historical data of Scenario 1 (Figure 5). The median is chosen because in distributions with large skews like this, it is a better representation of the truer middle. The Monte Carlo simulation was ran through 5,000 iterations and the results show that a forecasted median and mean (3.16% and 2.96%) dividend growth rate can be expected into the long-term future. The simulation also showed a 52.28% probability for a positive integer meaning that it is a slightly positive probability that JPM increases their dividend based off this model.
What this means for investors is that using the inputs from the historical data and 5,000 randomized iterations, JPM has an expected growth rate median of 3.16% and 52.28% of the time will be a positive integer. The flaw with this specific scenario is that the large variance due to the standard deviation creates a much less consistent expectancy for JPM going forward. We suggest that this is a useful scenario for investors who anticipate extreme volatility through their perpetual holding period and can use the 3.16% median dividend growth rate to determine their entrance price for JPM.
Figure 5. Monte Carlo dividend simulation results – Scenario 1 (Author)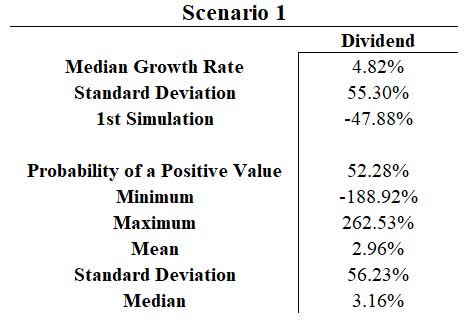
Scenario 2
In order to normalize the assumptions for modeling, we can re-run the model to find the dividend growth rate while removing everything outside of the 95% confidence interval which are the variables outside of -2.1% to 29.7% (Figure 6). The Scenario 2 data shows a much closer mean and median growth rate which are 7.12% and 5.56% respectively. This represents a much smaller right skew since the values are closer together. Also note that the standard deviation is 6.87% with a 95% confidence interval between 4.69% and 9.56%. This means that the normalized data 95% of the time fell between those values.
Figure 6. JPM annual dividend growth rate – Scenario 2 (Author)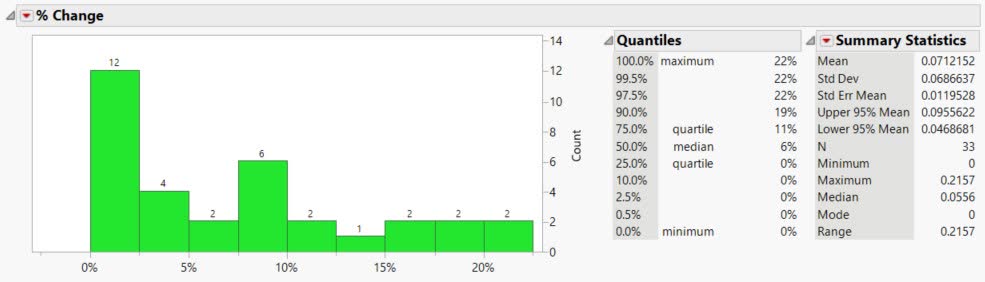
The Monte Carlo simulation for Scenario 2 show a much more normalized result (Figure 7). The Monte Carlo simulation was ran through 5,000 iterations and the results show that a forecasted median and mean (5.35% and 5.44%) dividend growth rate can be expected into the future. The simulation also showed a 77.6% probability for a positive integer meaning that it is a likely probability that JPM increases their dividend when considering their normalized historical trends.
What this means for investors is that based off the inputs from the historical data and through 5,000 randomized iterations, JPM has an expected dividend growth rate median of 5.35% and 77.6% of the time will be a positive integer. The flaw with this specific scenario is that it omits potentially devastating “Black Swan” events that fall outside of the 95% confidence interval and the JPM dividend reaction to these events. We suggest that this is a fair scenario for investors who anticipate less volatility through their perpetual holding period and can use the 5.35% median dividend growth rate to determine their entrance price for JPM.
Figure 7. Monte Carlo dividend simulation results – Scenario 2 (Author)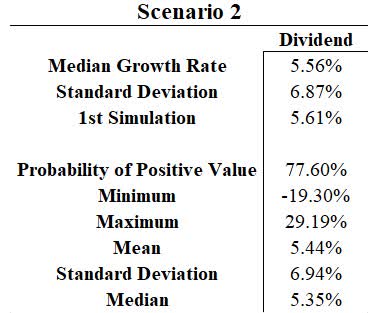
Growth Rate Summary
Figure 8 represents a summary of JPM dividend growth rates that investors can use to form their inputs into their investments. It represents how utilizing different calculations, investors can determine different formulations for their cash flow perpetuity formulation. The Scenario 1 and 2 median growth rates were calculated earlier using Monte Carlo simulations with values of 3.16% and 5.35% respectively.
Figure 8. JPM dividend growth rate summary (Author)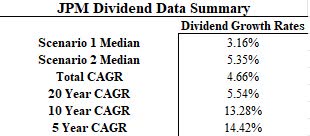
The Compounded Annual Growth Rate (CAGR) formula can also be utilized over different time periods to show potential trends (Figure 9). A CAGR formula considers the annual growth with a beginning and ending period and is a more accurate way of measuring returns. The summary above shows the results of a CAGR calculation since 1973, and the past 20, 10, and 5 years. This summary shows that there is a large difference between the CAGR for JPM dividends since 1973 and over the past 20 years in comparison to the 5 and 10 year CAGR. This is important because some investors may only see the 5 and 10 year data assuming that the trend is going to continue but having an understanding of the economics and volatility of JPM dividend history shows a much more conservative growth rate for long term dividend investors.
Figure 9. Compounded annual growth rate formula (Investopedia)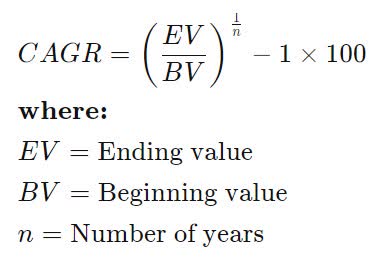
Sensitivity Analysis for Dividend Investors
The final step is to determine how investors can utilize this information to determine entrance points for JPM based off their expectation of returns. We can utilize a Sensitivity Analysis combined with a Gordon Growth Model to determine purchase prices (Figure 11). A Gordon Growth Model can determine the intrinsic value of constantly growing payments. It utilizes a constant cash flow (dividend), an expected growth rate (shown in the dividend growth rate summary), and the investors expected return to derive a purchase price for a position (Figure 10).
Figure 10. Gordon Growth Model formula (Investopedia)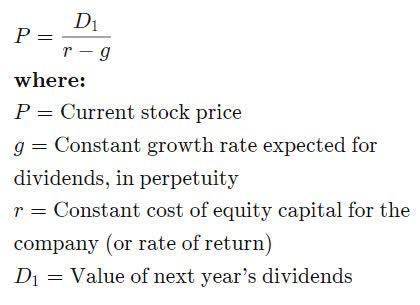
Orienting and understanding a Sensitivity Analysis is useful for investors to determine their ideal purchase price (Figure 11). The left column shows a scale of different Dividend Growth Rates ranging from 2% to 15% and the highlighted rates are representative of the different approximate rates represented in the JPM Dividend Data Summary above (Figure 8). The Desired Return shows a scale of different investor return expectations ranging from a 5% to 17% return. The tabulated data shows the purchase price of JPM stock needed given an expected dividend growth rate and the investors desired return. As of this writing, JPM is trading around the $106 price range and prices within 2% are highlighted in green.
Example 1: If an investor utilizes the Monte Carlo simulation from Scenario 2 expecting a median growth rate of 5.35% (rounded down to 5%, yellow row) while expecting a 9% return on dividend stocks, then that investor would have a purchase price of $105 which places JPM currently around an appropriate buying range.
Example 2: If an investor utilizes the Monte Carlo simulation from the Scenario 1 results and expects a median growth rate of 3.16% (rounded down to 3%, blue row), then the current pricing of JPM would allow for almost a 7% return for perpetuity.
This sensitivity analysis allows for an investor to utilize their choice of the potential dividend growth outcomes and their expected return to determine their buying price and removes behavioral aspects encouraging better investment decisions.
Figure 11. Dividend sensitivity analysis (Author)
The CAGR rates discussed could also be used for investors to determine their buying price in exactly the same manner based on their personal assumptions.
Risks
There is currently large uncertainty and volatility in financial markets. Utilizing quantitative methods for investment decisions is intended to help mitigate risk. The Sensitivity Analysis shows that as the growth rate declines given a constant return expectation, the purchase price decreases for JPM. In times of exceptional uncertainty and risk (present economic conditions), it is beneficial to increase the return expectation as a way of factoring in a margin of safety. As an example, an investor who normally expects a 6% return may expect a 7% return as a Margin of Safety and change their purchase price accordingly. Dividend investors can specifically focus on decreasing their risk by increasing their return expectation and estimating future dividend growth conservatively.
Summary
As a dividend investor, the goal is to invest in firms that have a high likelihood of maintaining growing dividend payments throughout the investors lifespan. JPM is a dividend contender and a large firm that is embedded into American businesses making it an ideal candidate. Utilizing conservative expectations for a perpetual dividend growth of 3% combined with a long term dividend return expectation of 7% leads to rating JPM a “Buy” around the $105 trading range. Monitoring through the remainder of the year as a bearish market continues to pressure equities down may present opportunities to invest into JPM around the $85 range which would change the rating to a “Strong Buy”. These bearish markets provide ample opportunity for contrarian and long-term focused investors.
Editor’s Note: This article was submitted as part of Seeking Alpha’s best contrarian investment competition which runs through October 10. With cash prizes and a chance to chat with the CEO, this competition – open to all contributors – is not one you want to miss. Click here to find out more and submit your article today!
Be the first to comment