

wildpixel/iStock via Getty Images
Pullback, Correction, or Bear Market?
A market pullback is commonly defined as a 5-10% retracement of its most recent high, if the retracement deepens further between 10-20%, we talk about a market correction, while a bear market is usually seen as a decline of over 20%. While those thresholds should be seen as rather arbitrary indicators, a bear market can also be defined as the situation when investors are increasingly risk-averse than risk-tolerant. Statistically, we can estimate that a 10% pullback happens approximately every 11 months, a 20% correction every 4 years, while a 40% drop is likely to happen every 15-30 years, and a drop of over 50% every 30-50 years.
Author, with data from Ned Davis Research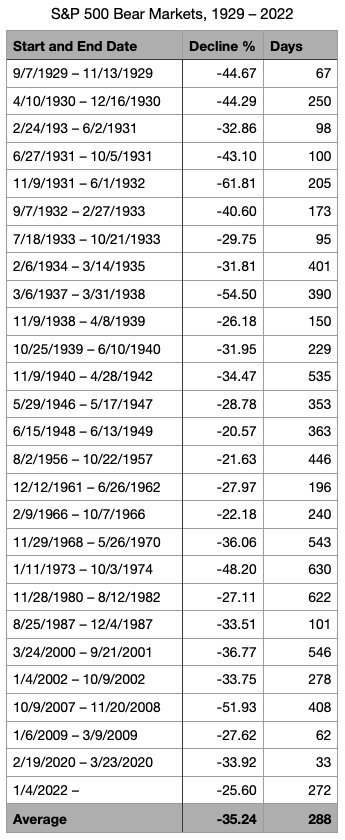
There have been 27 bear markets since 1928, including the one ongoing, lasting on average 288 days, with stocks dropping on average 35%. A bull market instead typically begins with a gain of 20% or more from the latest low, with stocks having on average gained 114%, and the average length being 991 days. Between 1928 and 1956 there have been 12 bear markets, or approximately one every 17 months, while since the Second World War, bear markets have been less frequent, with only two since the market crash during the financial crisis, while there have been multiple strong and long-lasting bull markets.
Yardeni Research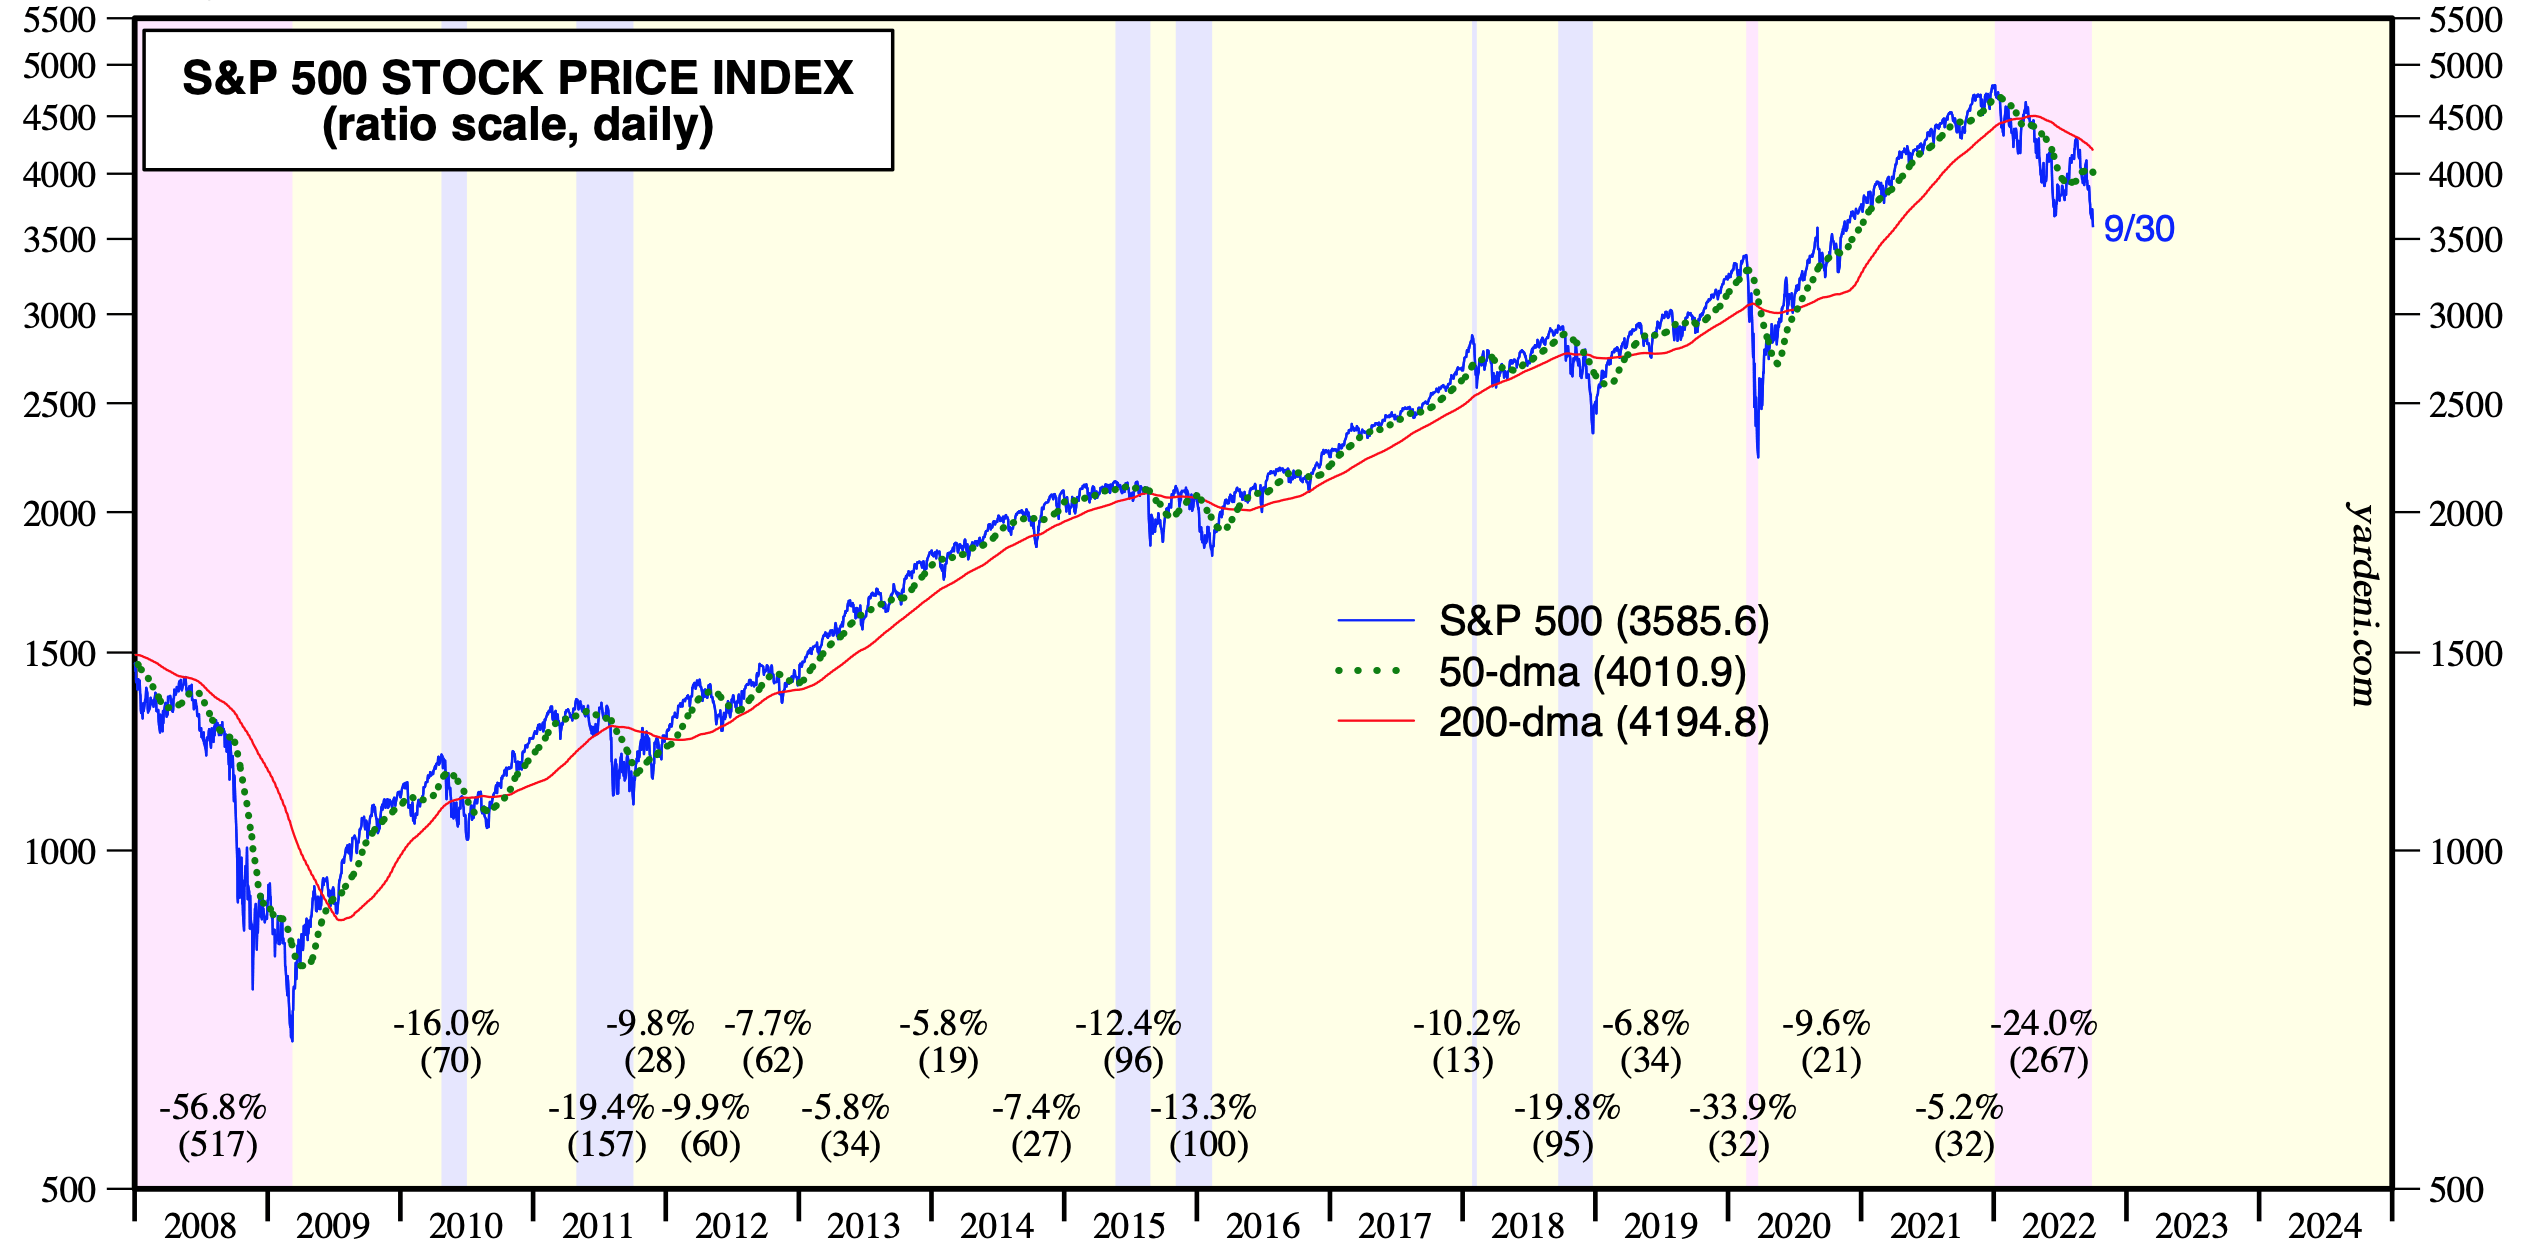
Stock market corrections are fairly common, there have been pullbacks of 10% or more in 10 of the past 20 years, and despite its cycles, the market tends to grow significantly over the years.
Morningstar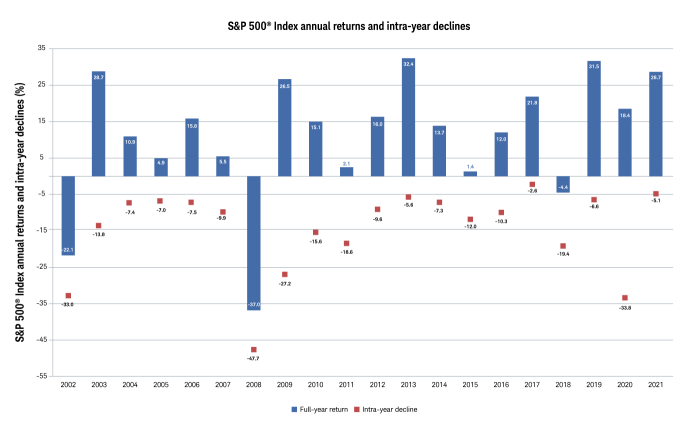
But this doesn’t mean that there are no long-term risks and that it’s safe to stay continuously invested in the equity market, as it also doesn’t make economic sense looking at the portfolio losing 30-50% while taking charge of high opportunity costs and the risk of being wiped out of the market.
Morningstar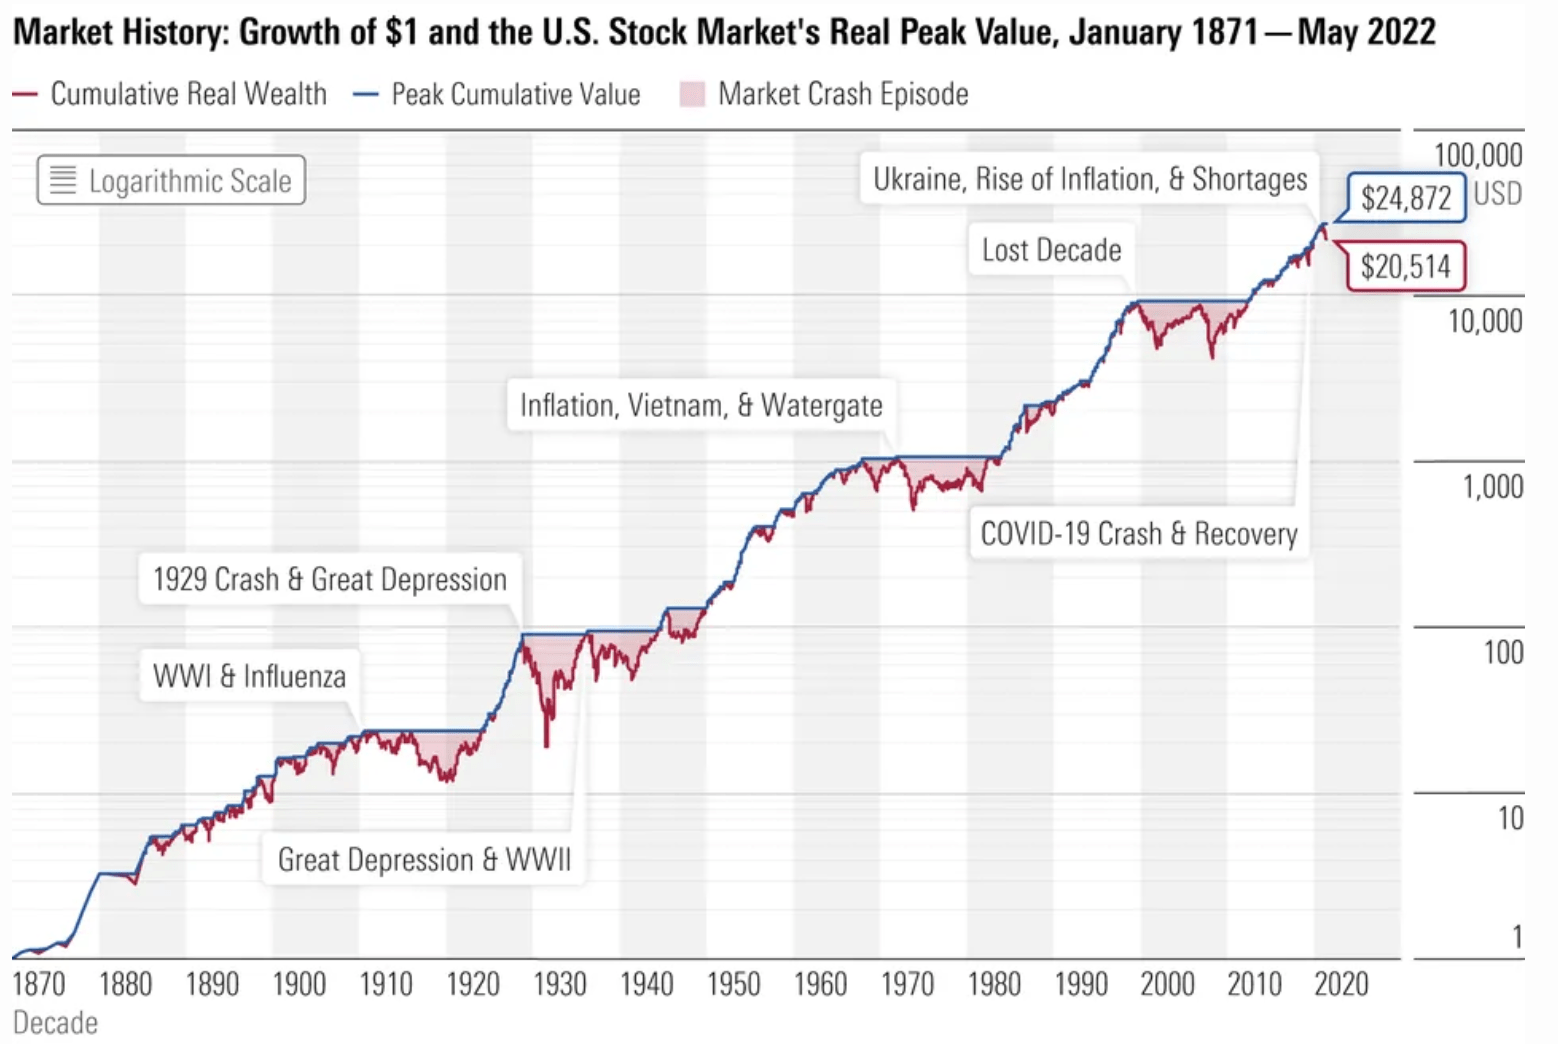
As important downturns can take several months or years to recover, and single stocks potentially not recovering for decades or never reaching the investor’s break-even again, it is of primary importance to be aware of the market’s situation at any given moment and have an overview not only of the main indexes but also of the individual sectors and industries, to be able to act consequently and minimize the risks while optimizing the investment performance.
PL Research, CFRA FactSet 05/20/22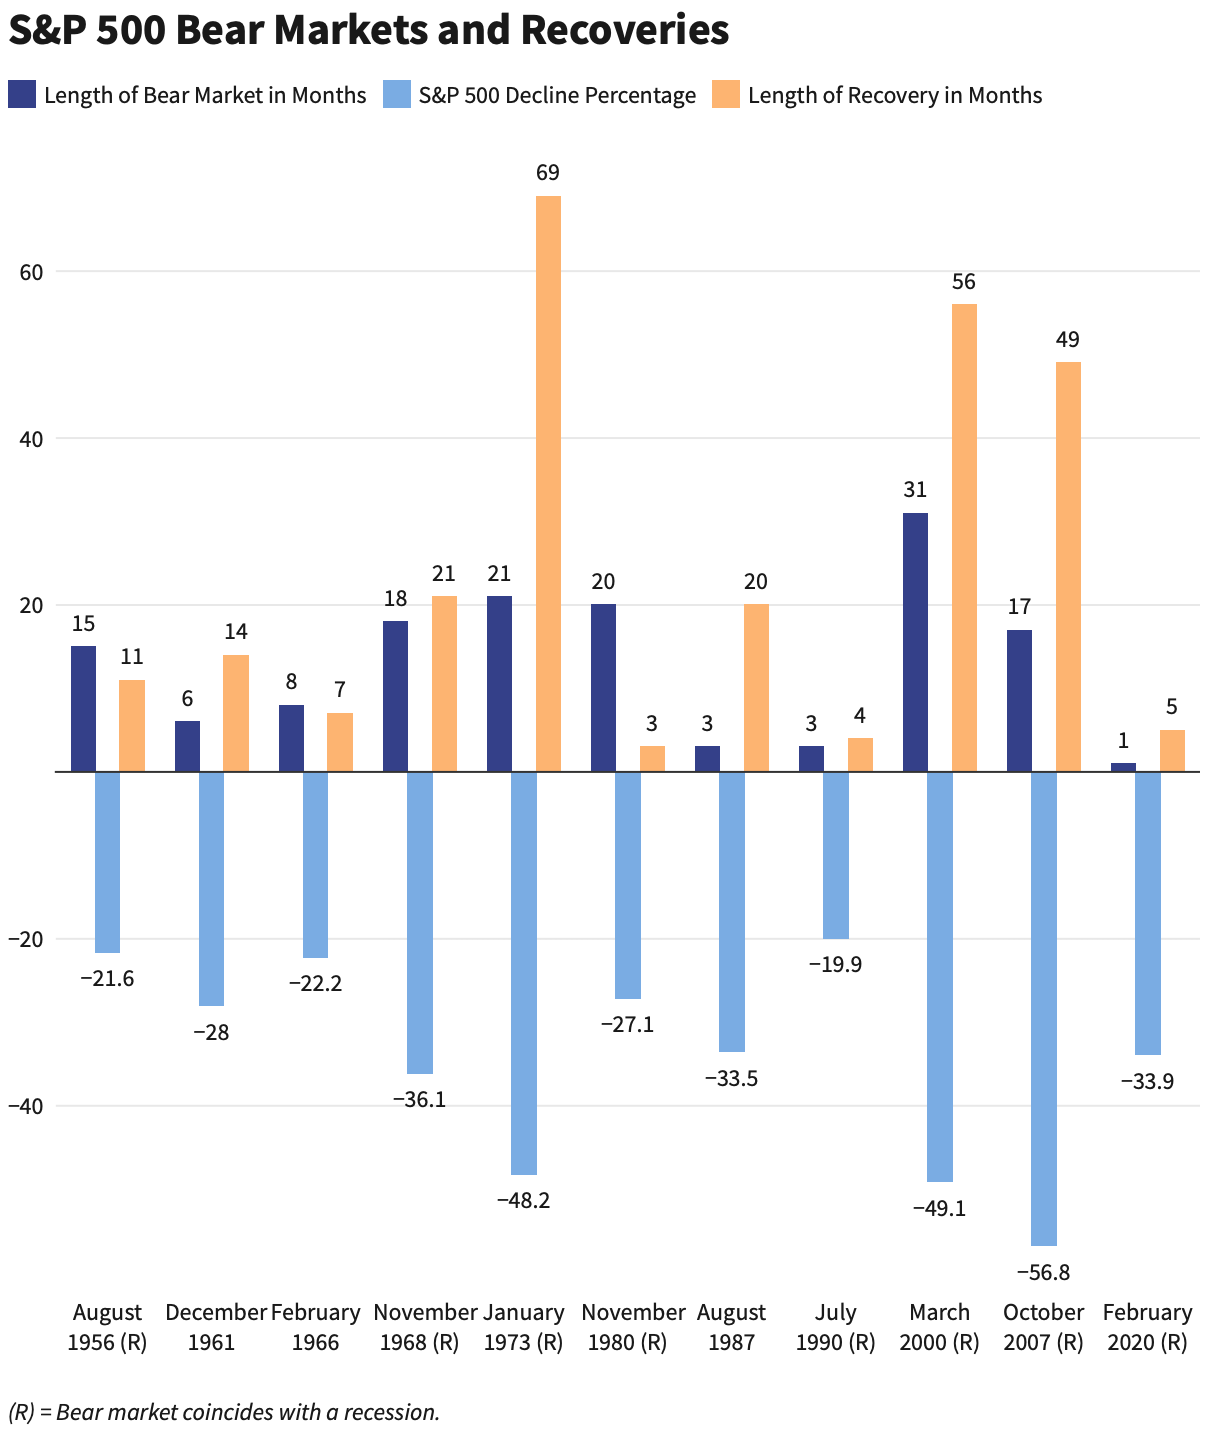
What is moving the markets?
Without surprise, looking at the sectors and industries on a yearly basis shows a quite gloomy picture in most parts of the economy; while some relative strength in the single industry groups has built up in the past months with energy and basic materials leading and some strength also seen in the healthcare sector, but most of the other industry groups still couldn’t give signs of a major recovery.
finviz finviz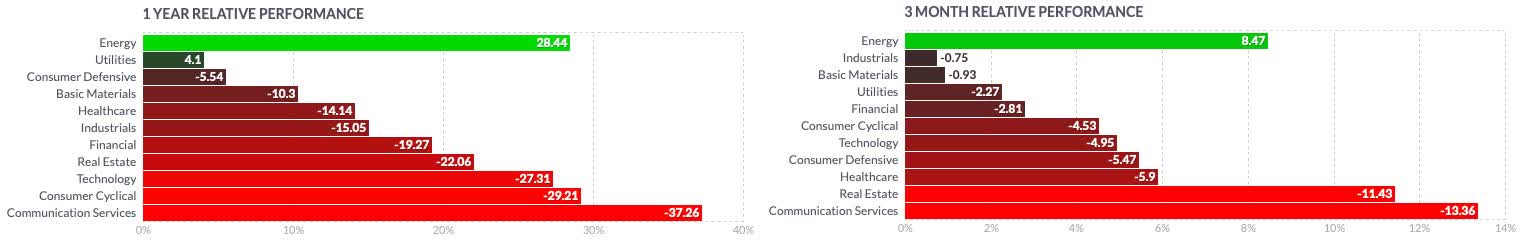
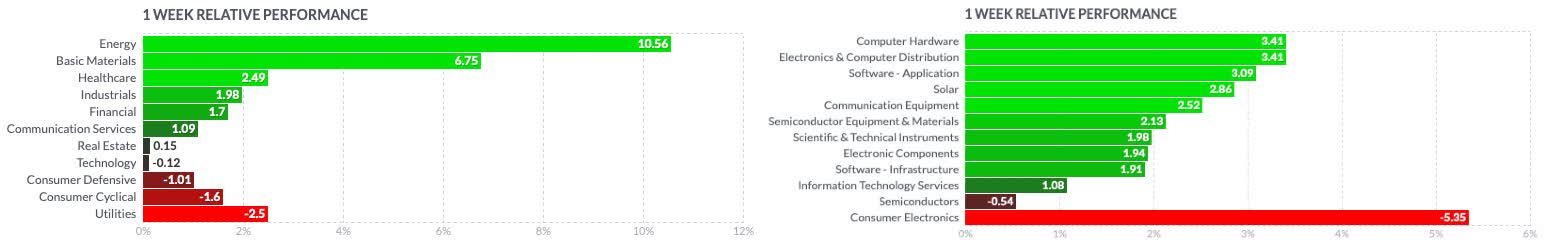
The heavily down beaten technology sector still looks like one of the less resilient, but valuations have come down significantly, while the market opportunities in many industries are still intact and oriented on secular growth trends. At one point the sector rotation will take place, and the allocation will flow into the most promising industries again. When energy, basic materials, utilities, and consumer defensive products may offer better protection in the ongoing market downturn, I see stocks in the technology, healthcare, and industrial sectors being the most likely to profit from the sector rotation, with a great potential to be the most advancing leaders once the market will turn and form a new uptrend.
A look at the big picture
The S&P 500 tracked by the SPDR S&P 500 Trust ETF (SPY) was almost sliding into a bear market on May 20, 2022, and finally entered the bear market on June 13, while failing in its attempt to form a new bull market during its rally lasting until mid-August, extending the ongoing bear market to 272 days. When compared to the broader small-cap market tracked by the iShares Russell 2000 ETF (IWM), the SPY has since shown increasing relative weakness, as the sell-off in larger companies typically happens in a later stage of a downturn. In the past month, the SPY fell 9.6%, the worst September on record since the burst of the dot-com bubble in 2002.
Author, using TradingView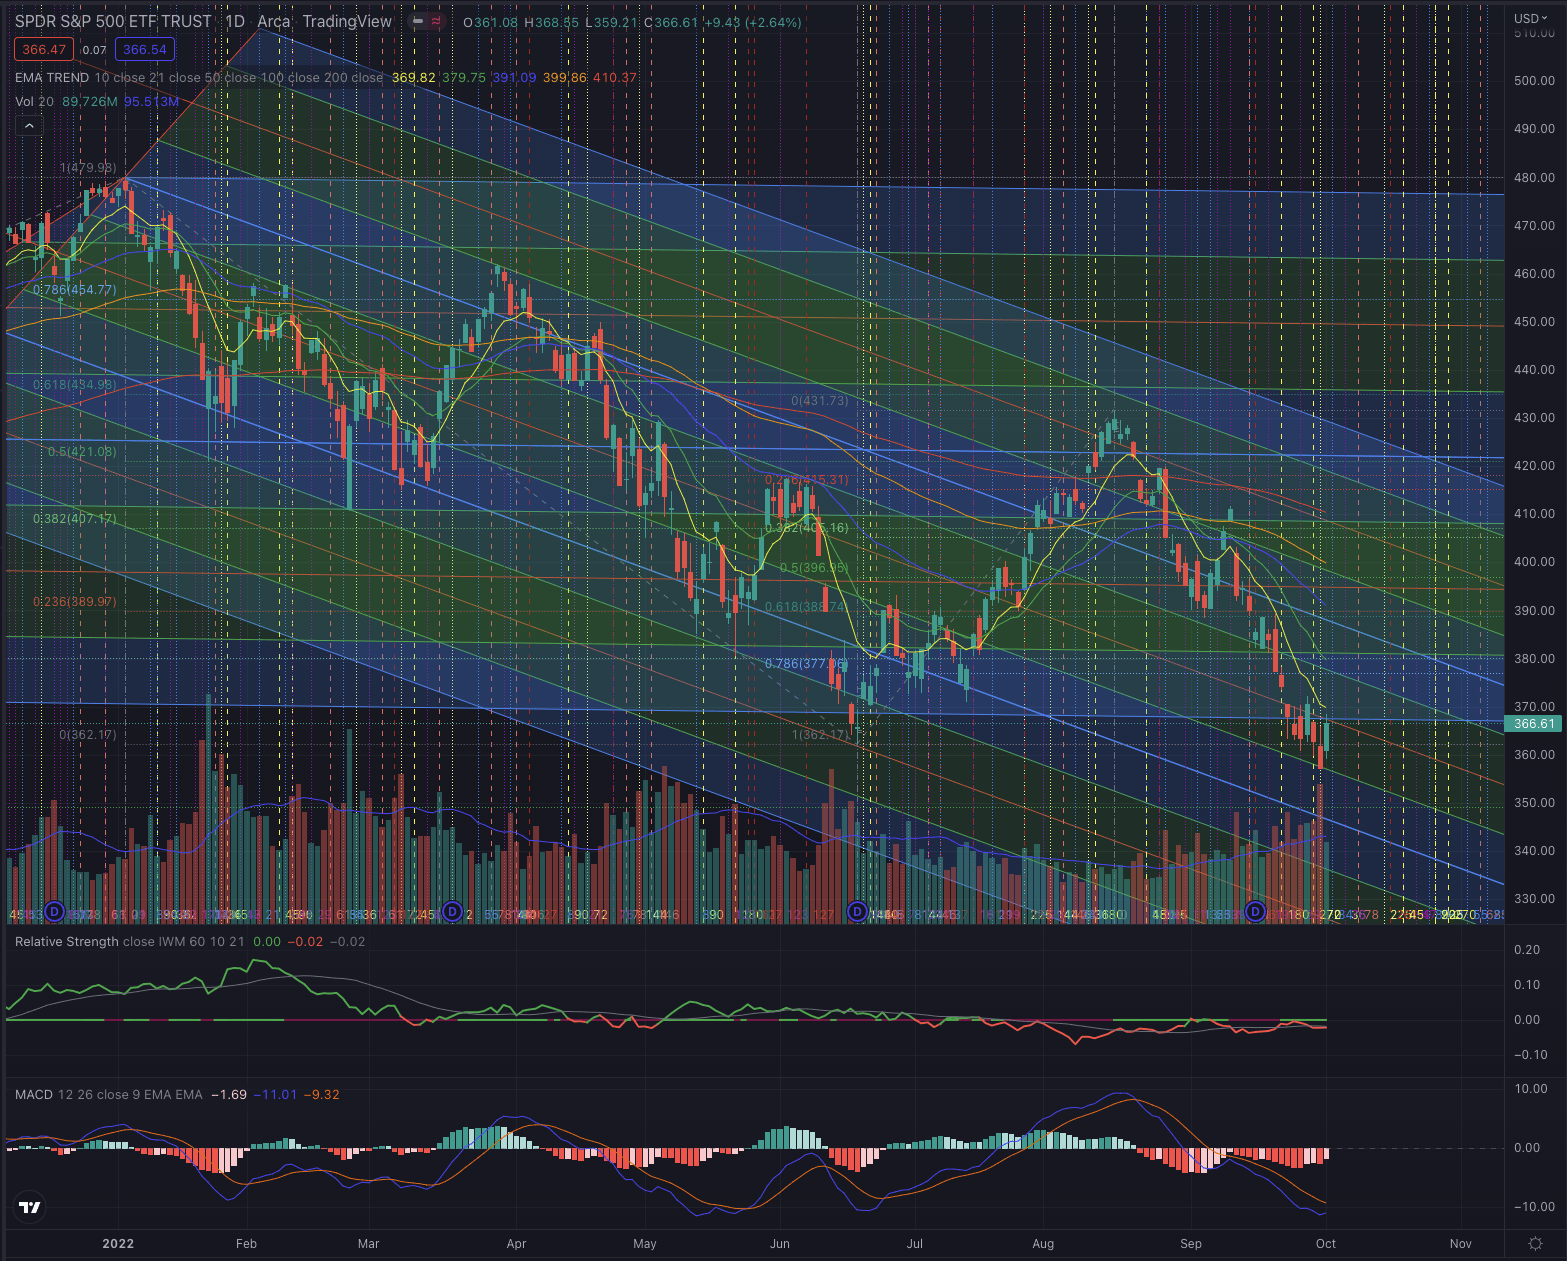
On a weekly scale, the index just dropped under its EMA200 and is now testing it as resistance, a situation that is typically critical and could lead to lower lows or mark a bottoming attempt.
Author, using TradingView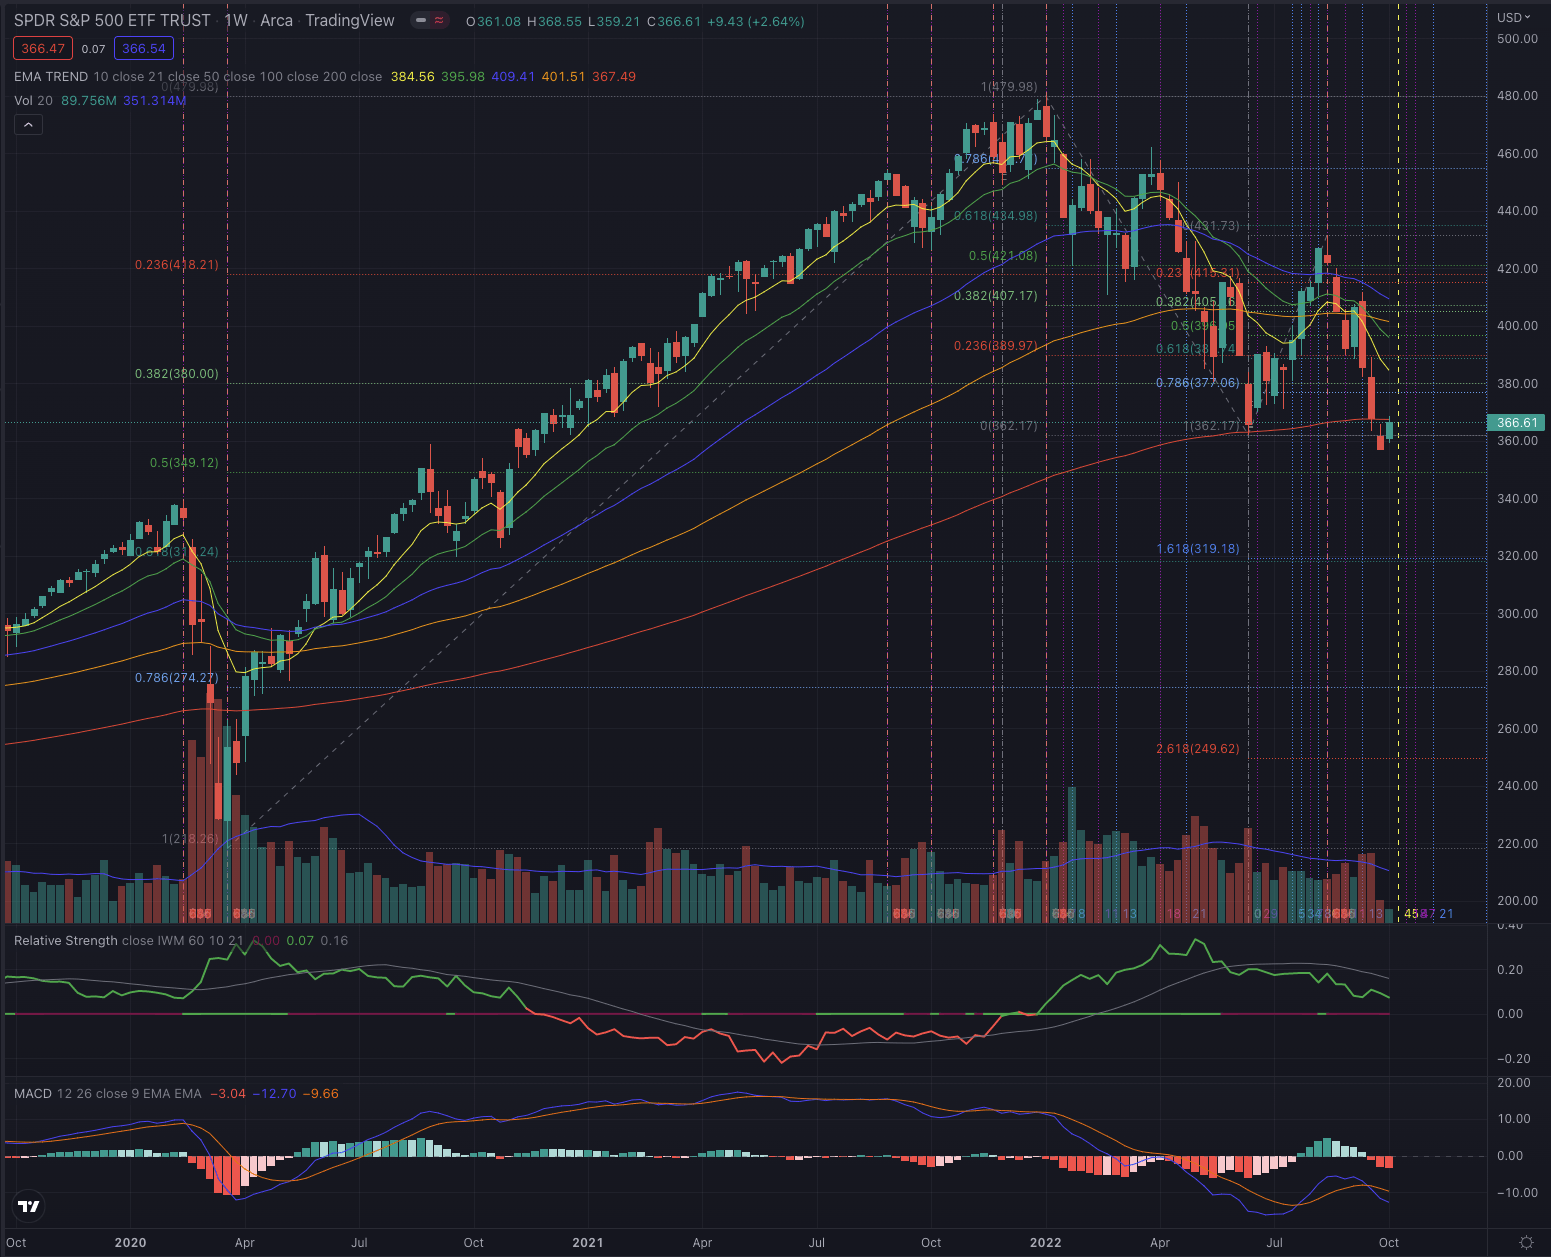
The Nasdaq 100 tracked by the Invesco QQQ ETF (QQQ) already attempted to enter a bear market on February 24, 2022, that finally began on March 7, while it has since performed a strong rally from mid-June to mid-July, which technically interrupted the bear market on August 10 after 261 days. The index technically almost fell into bear market territory again on September 30, but if we consider the downturn as a whole bear market, it already extends over 315 days.
Author, using TradingView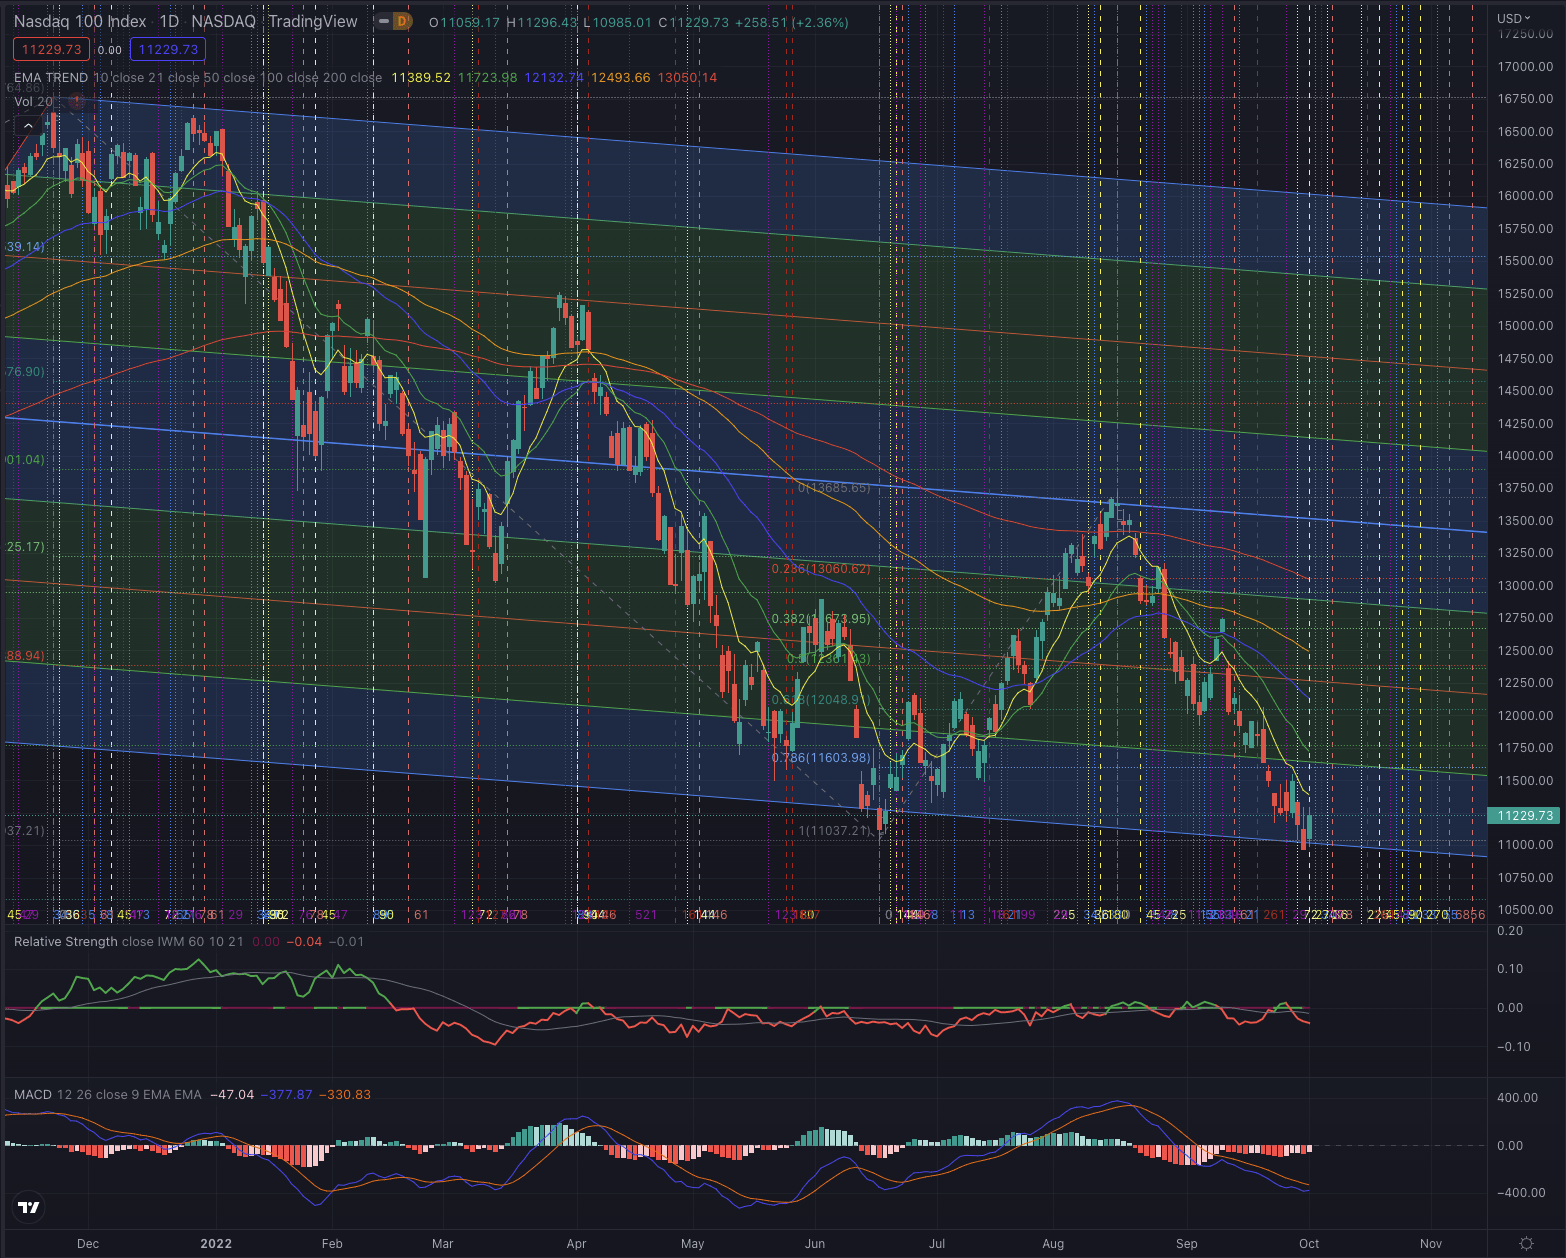
When compared to the broader market, the technology index has suffered relative weakness since entering the bear market, and has also shown more weakness than the S&P 500, while breaking under its long-term moving average on a weekly scale, a situation not seen since September 2, 2008, during the financial crisis, when it took the index 335 days to break again over its EMA200.
Author, using TradingView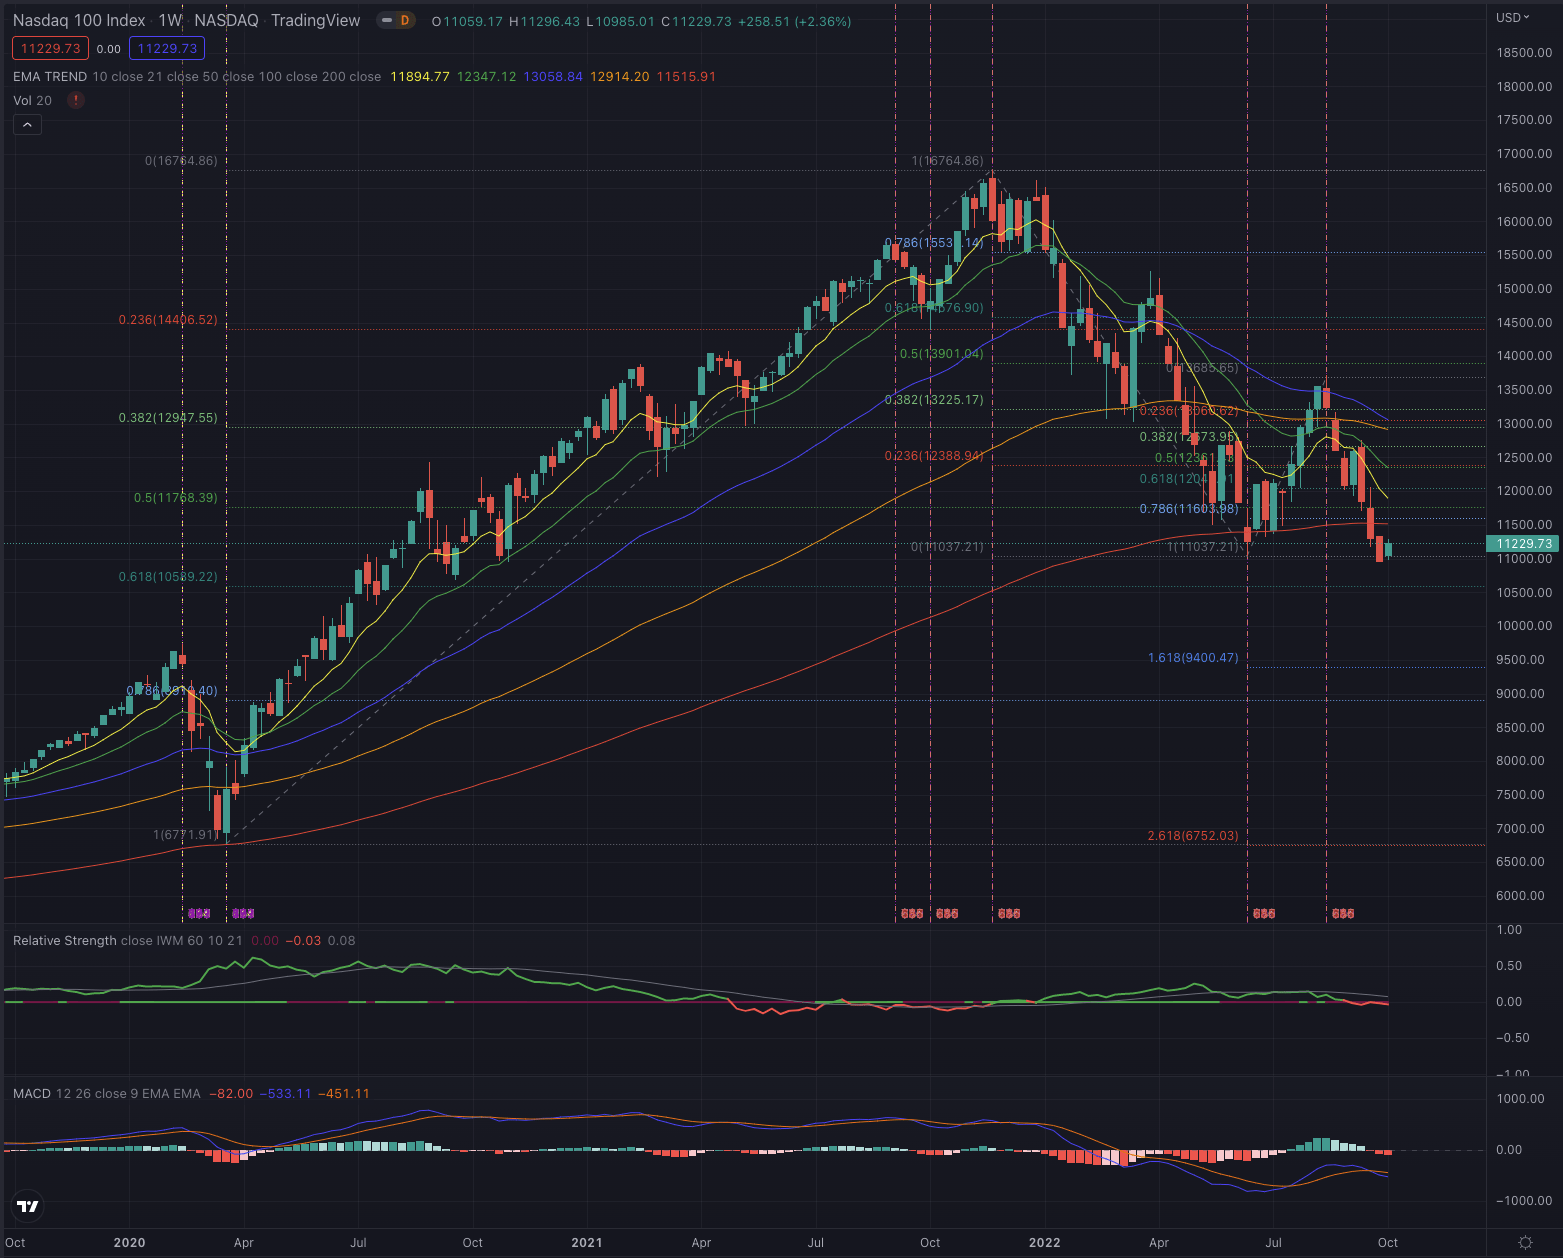
Key factors to watch
To assess the actual bear market and spot an eventual bottom and possible reversal, I focus on a few key indicators. The Market Breadth is one of my favorite indicators to track the general market’s sentiment and momentum, as it refers to how many stocks are participating in a given move in an index or on a stock exchange. For this purpose, I consider two indicators. The MMFI index shows the percentage of stocks over their 50-day moving average (MAV), while the MMTH reports those over their 200-day MAV at the NYSE.
Author, using TradingView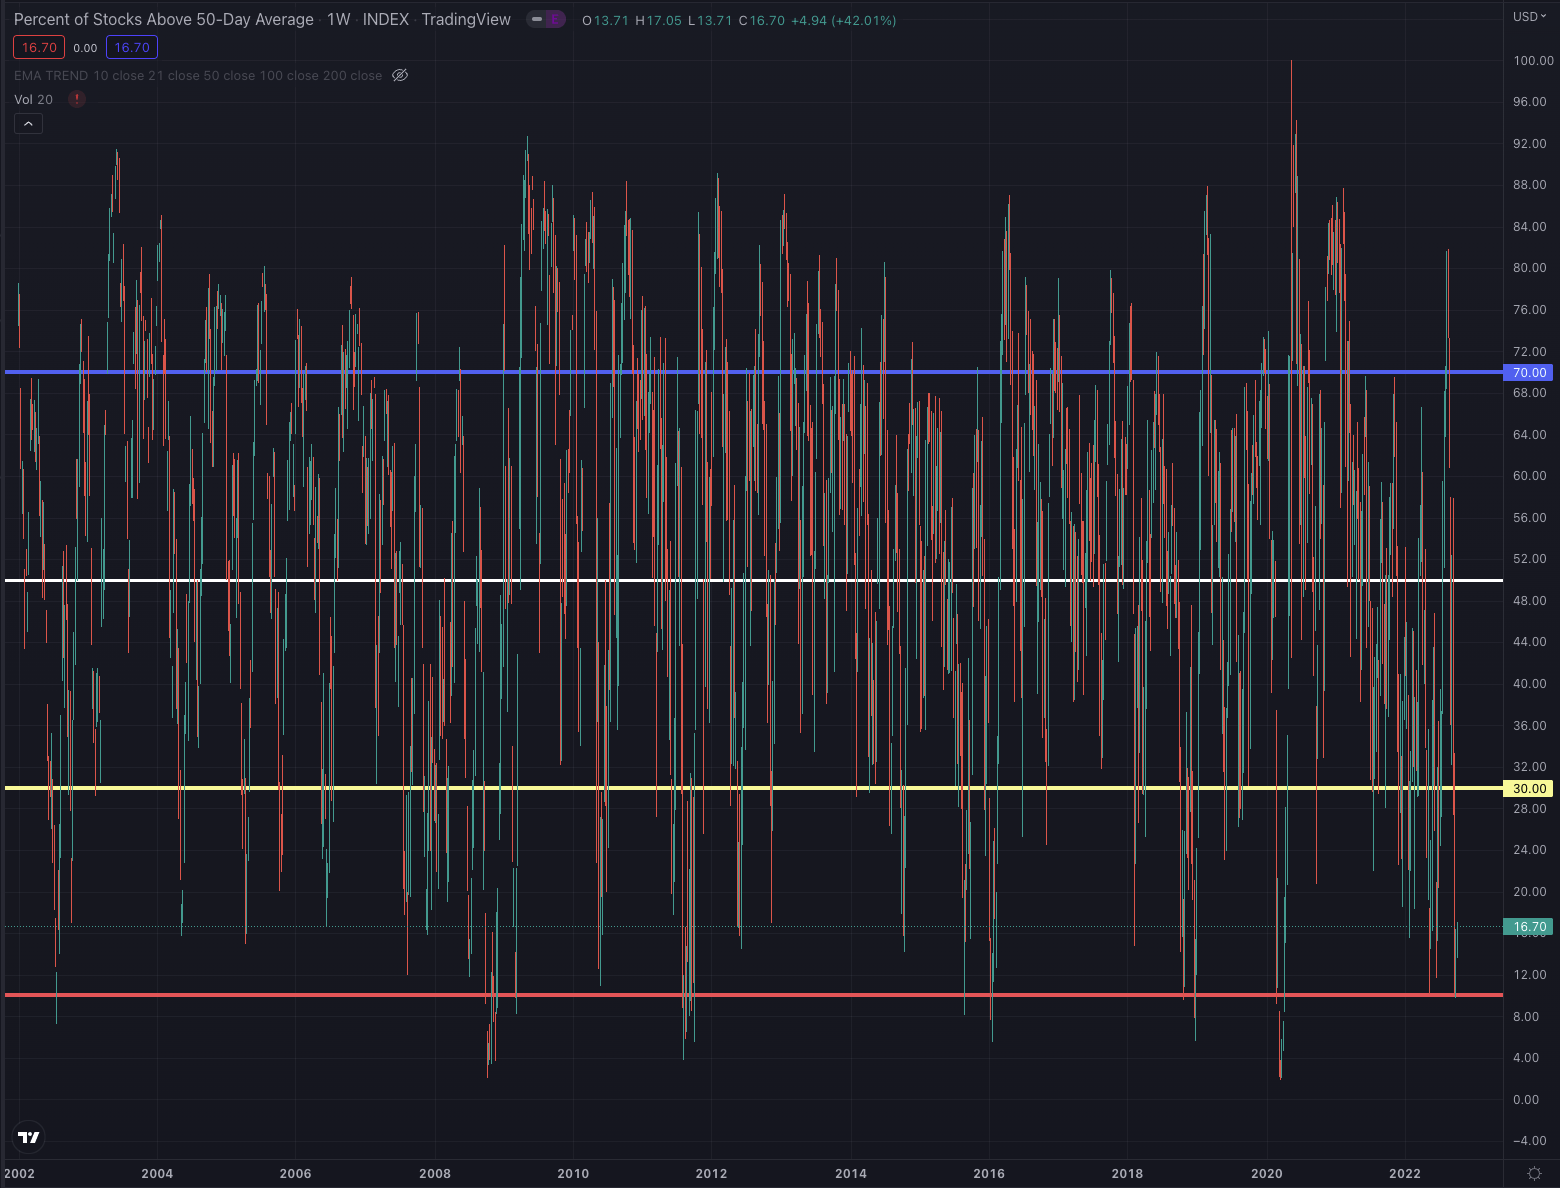
The two weekly charts show the most important market tops and bottoms in the past 20 years and how the bull and bear markets have been forming over time.
Author, using TradingView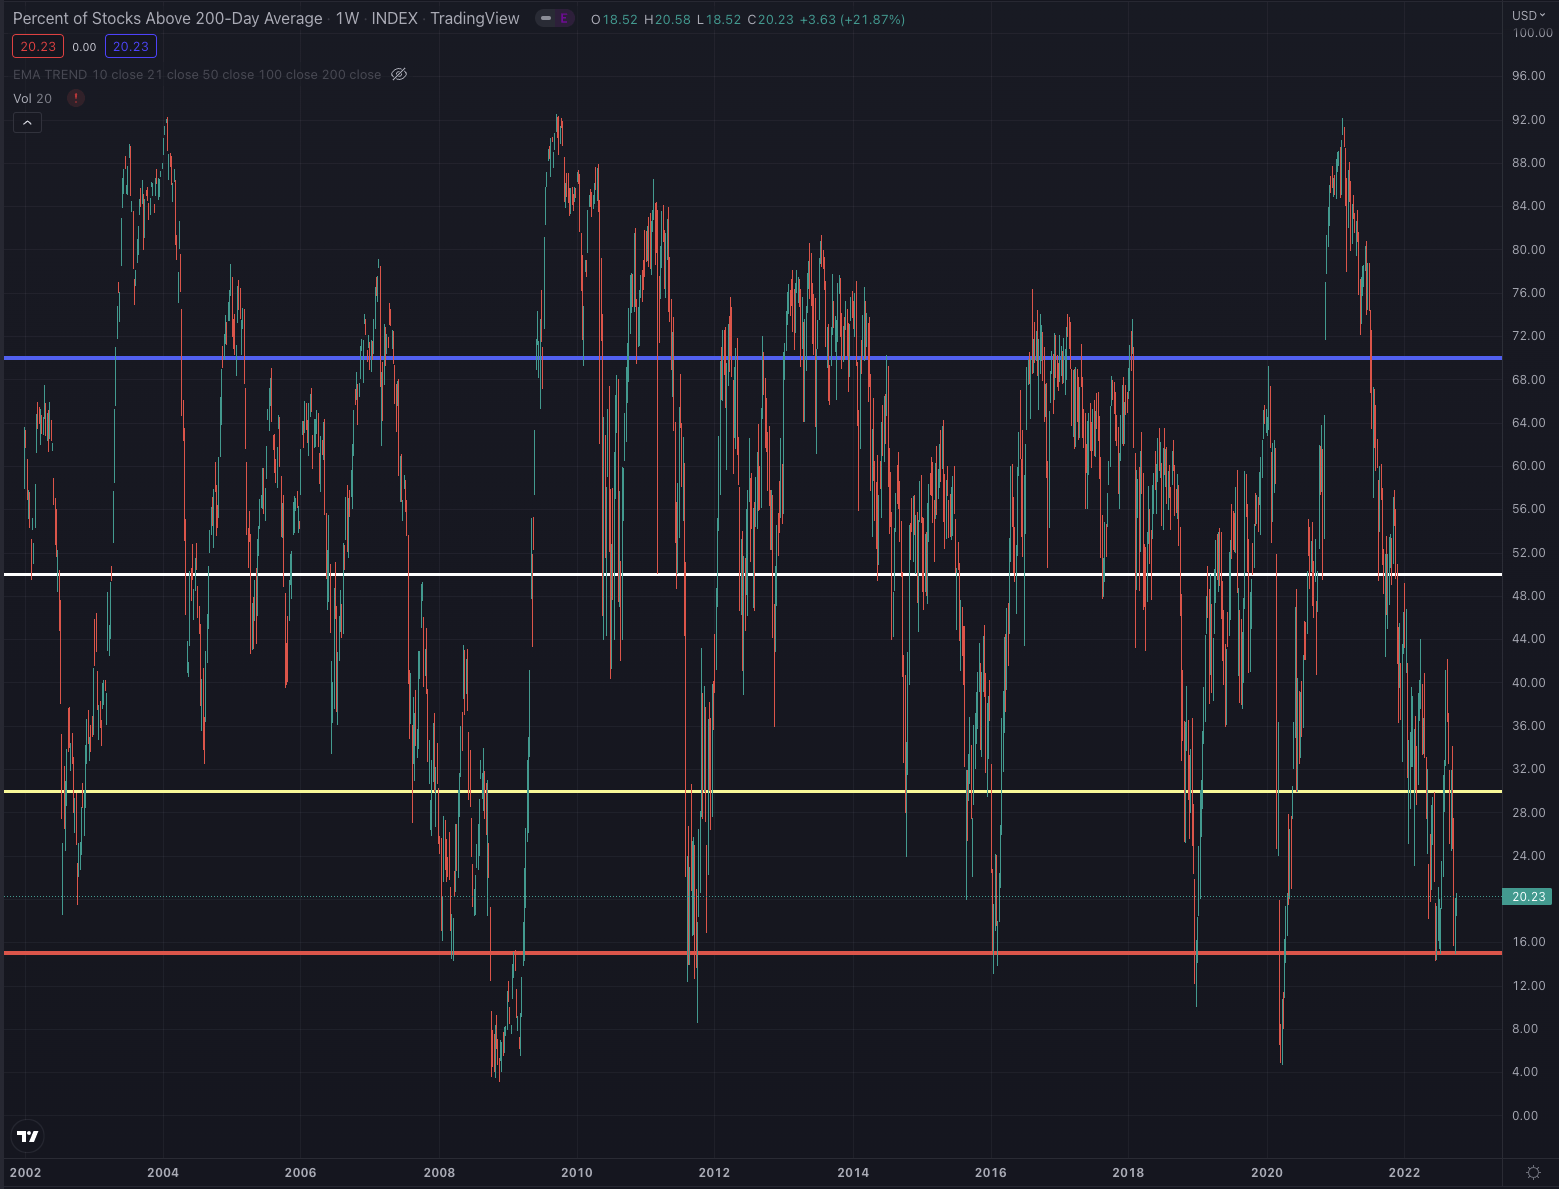
A reading of 30% and less, hints at an oversold market, while a reading of 70% and more suggests a rather overbought market. Historically a market bottom has been formed when the MMFI reached values under 10%, and the MMTH dropped under 15%, extreme values that have been followed by market capitulation and a reversal led by the new leaders in the most advancing groups.
Author, using TradingView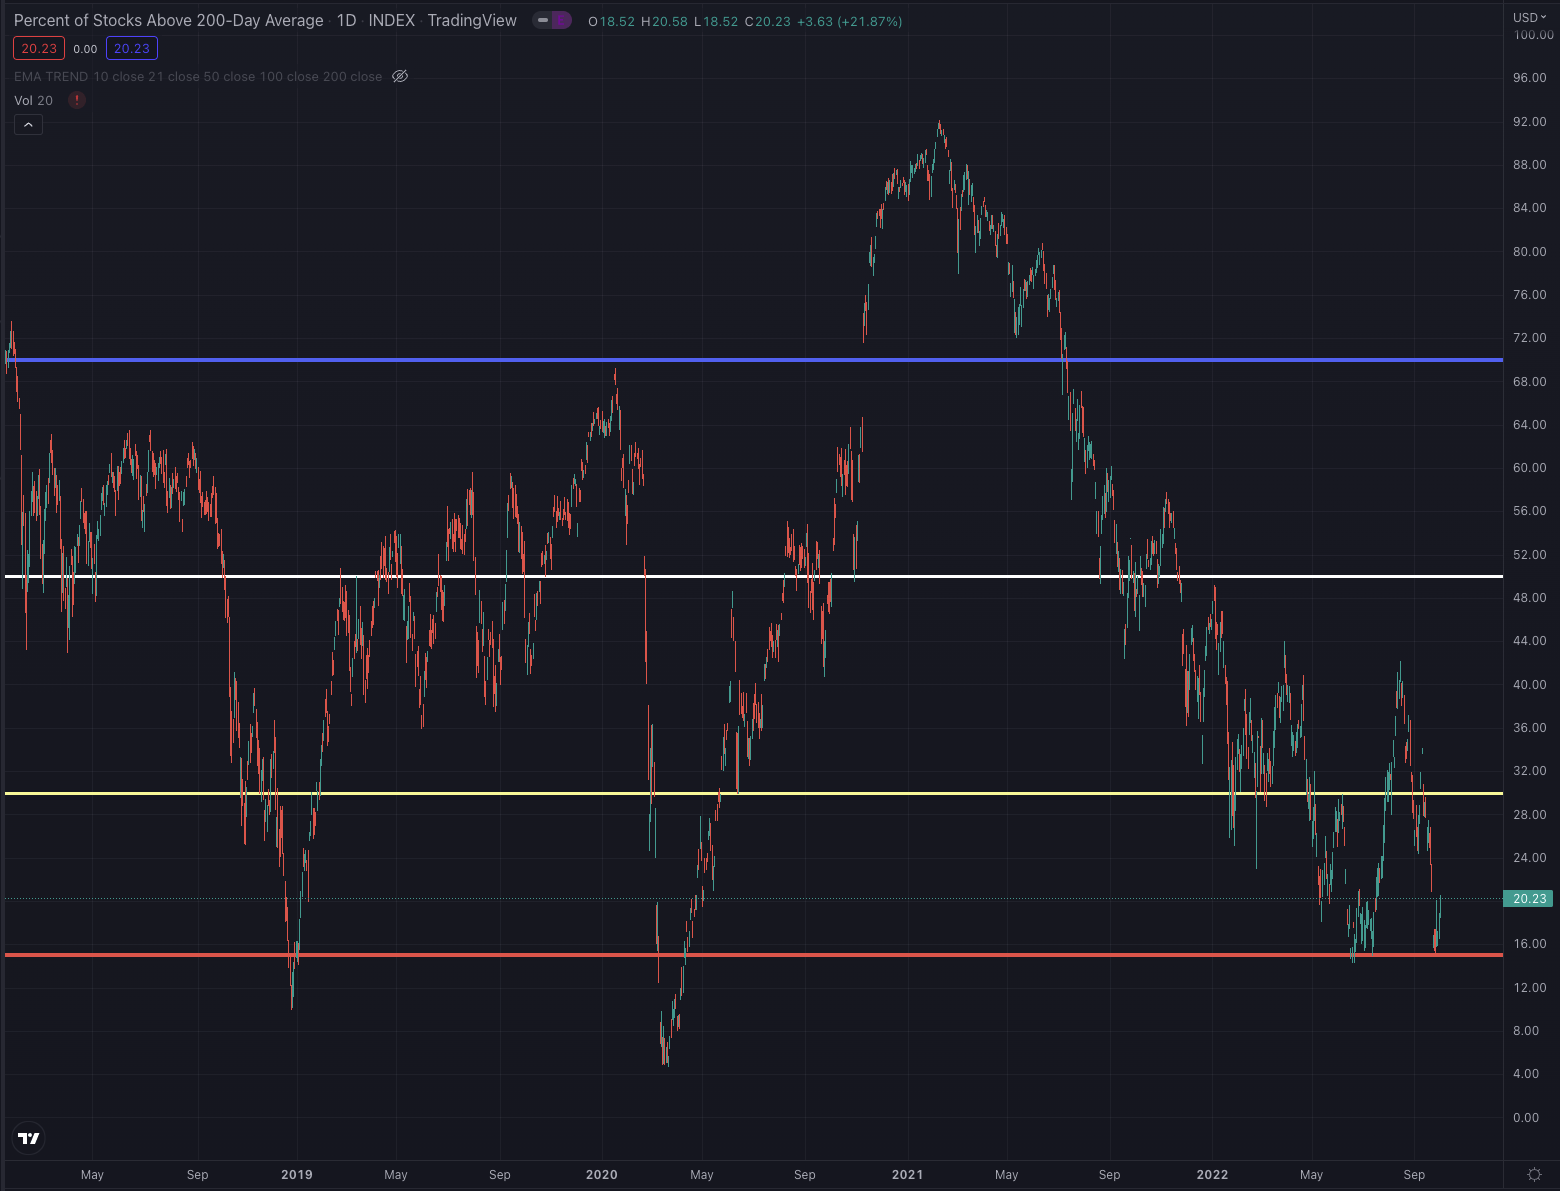
On a daily basis, it’s interesting to observe how the latest bottoming processes took place in 2019 and during the pandemic market crash in March 2020. In the actual downturn, the market tested twice the 15% level, where it has for now rebounded.
The CBOE Volatility Index (VIX) essentially projects the expected annualized volatility of the S&P 500 for the next 30 days. Derived from real-time prices of call and put options on the index with near-term expiration dates, it tends to be lower in bull markets and higher in bear markets, often dropping when the broader market rallies and soaring when stocks plunge.
Author, using TradingView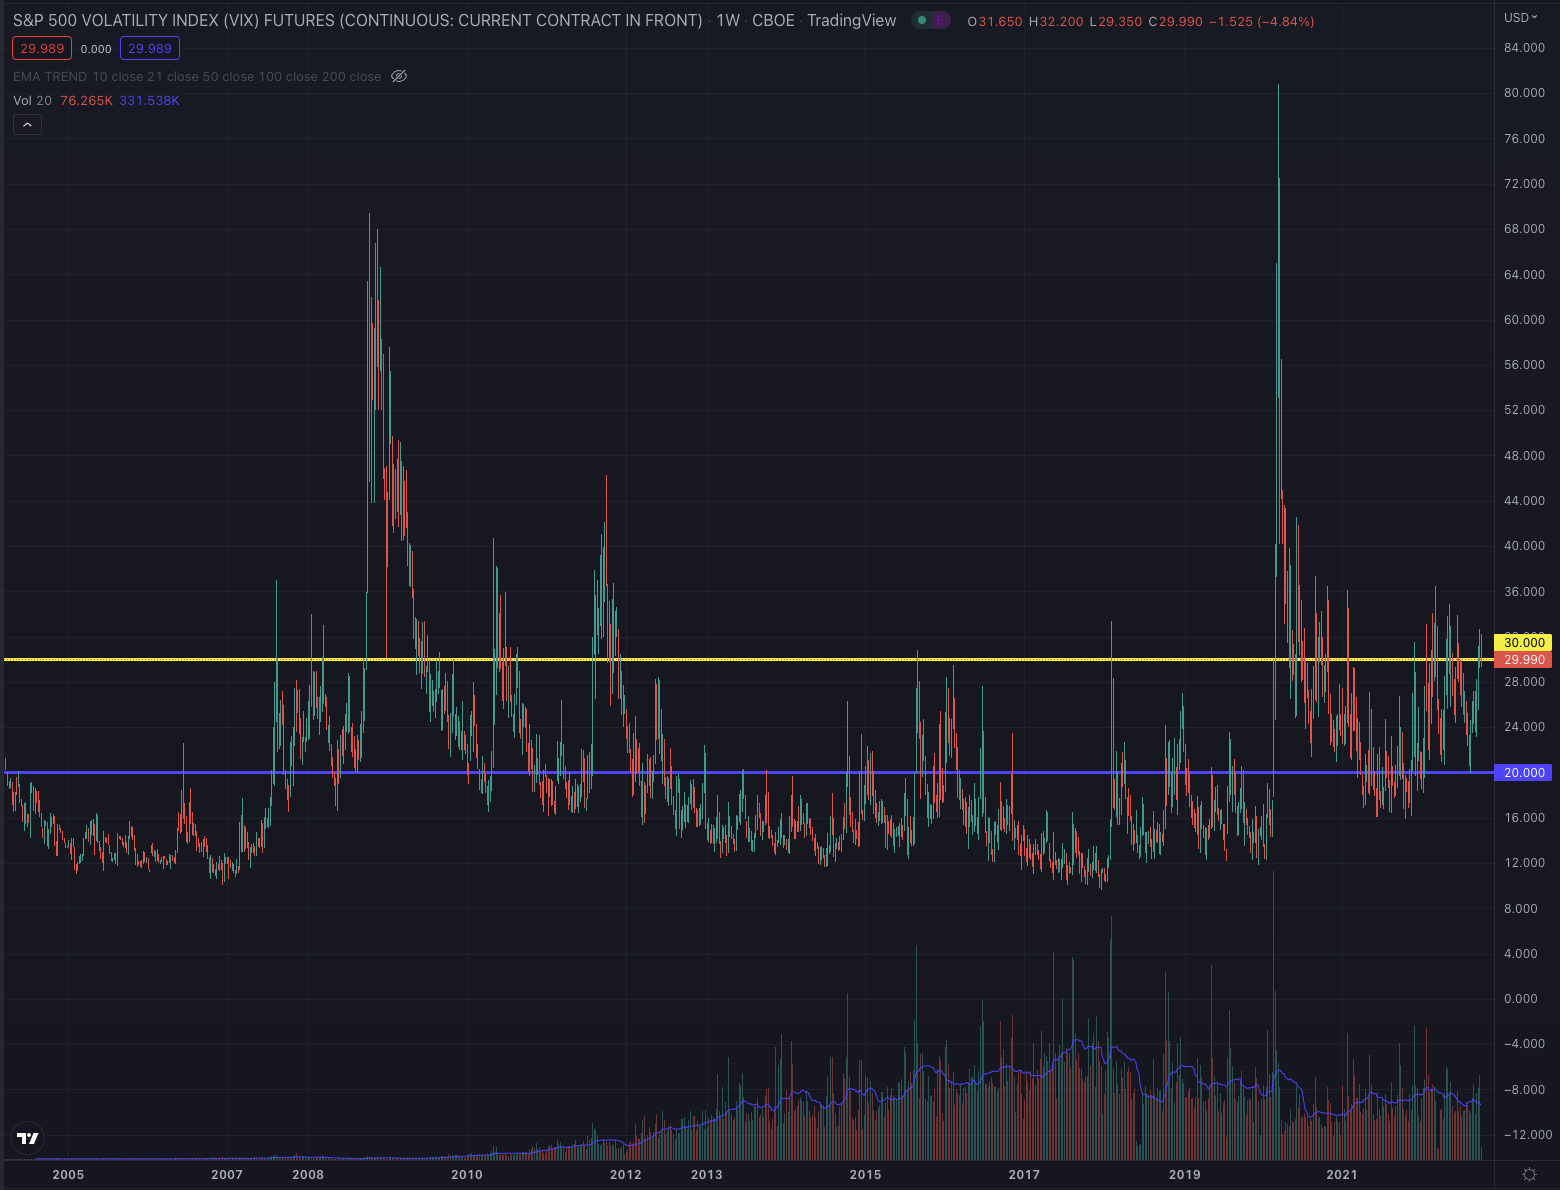
A reading of greater than 30 is considered to signal intensified volatility from increased uncertainty, risk, and investors’ fear. Values below 20 are generally associated with more stable, less uncertain periods in the markets. The index has been hovering between 20 and 30 since November 2021, reporting a recent spike, after bottoming on August 16 at a value of exactly 20.
The SPDR Bloomberg Barclays High Yield Bond ETF (JNK), which tracks highly liquid, high-yield, US dollar-denominated corporate bonds, is another indicator I observe to determine the risk appetite in the broader market, as more risk-averse investors tend to sell high-risk corporate debt, causing the price of the bonds to drop as their yield increase. The recent levels are showing a high-risk aversion and are close to the bottom levels recorded during the pandemic market crash.
Author, using TradingView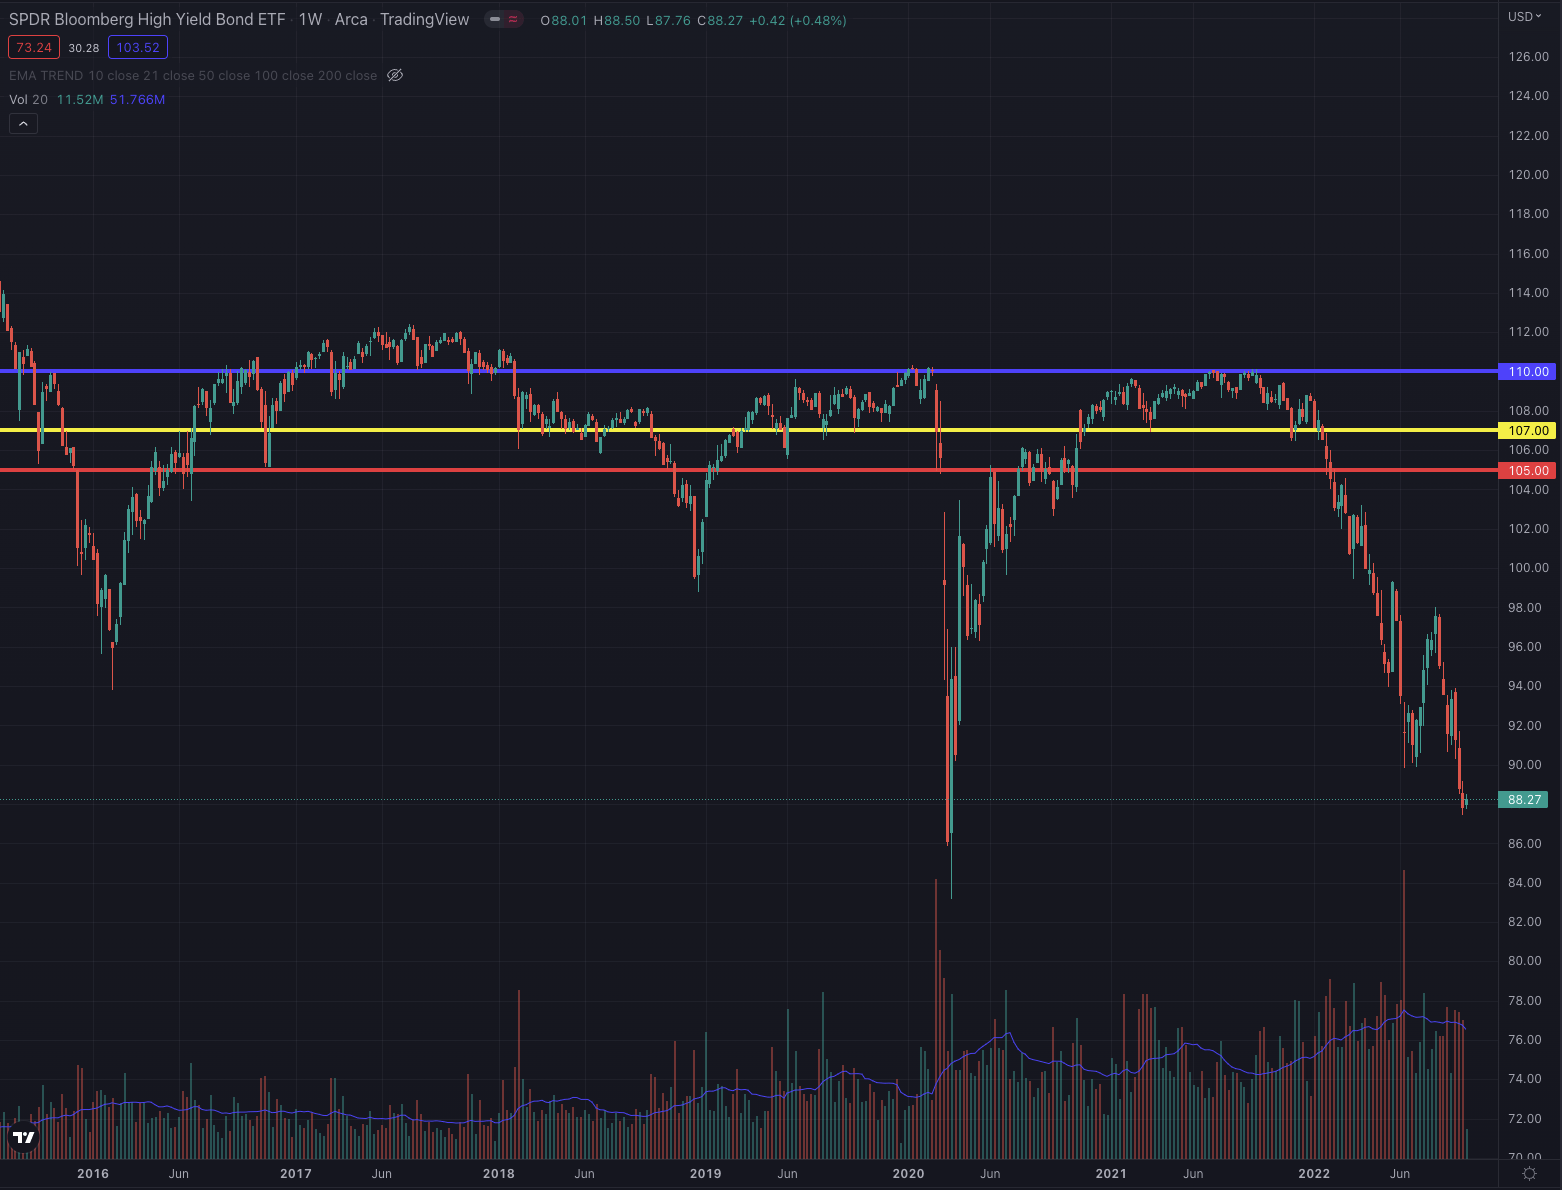
Other relevant indicators
The markets are now particularly sensitive to changes in the reported inflation rate and the US Core Consumer Price Index, two measures I monitor closely as they are significantly influencing the market sentiment. While inflation may have topped in June 2022, and the Core CPI reading is seemingly slowing down, the international crisis caused by the war in Ukraine could still negatively affect those indicators in the coming months, as the conflict seems to escalate to unprecedented levels of tension.
Author, using TradingView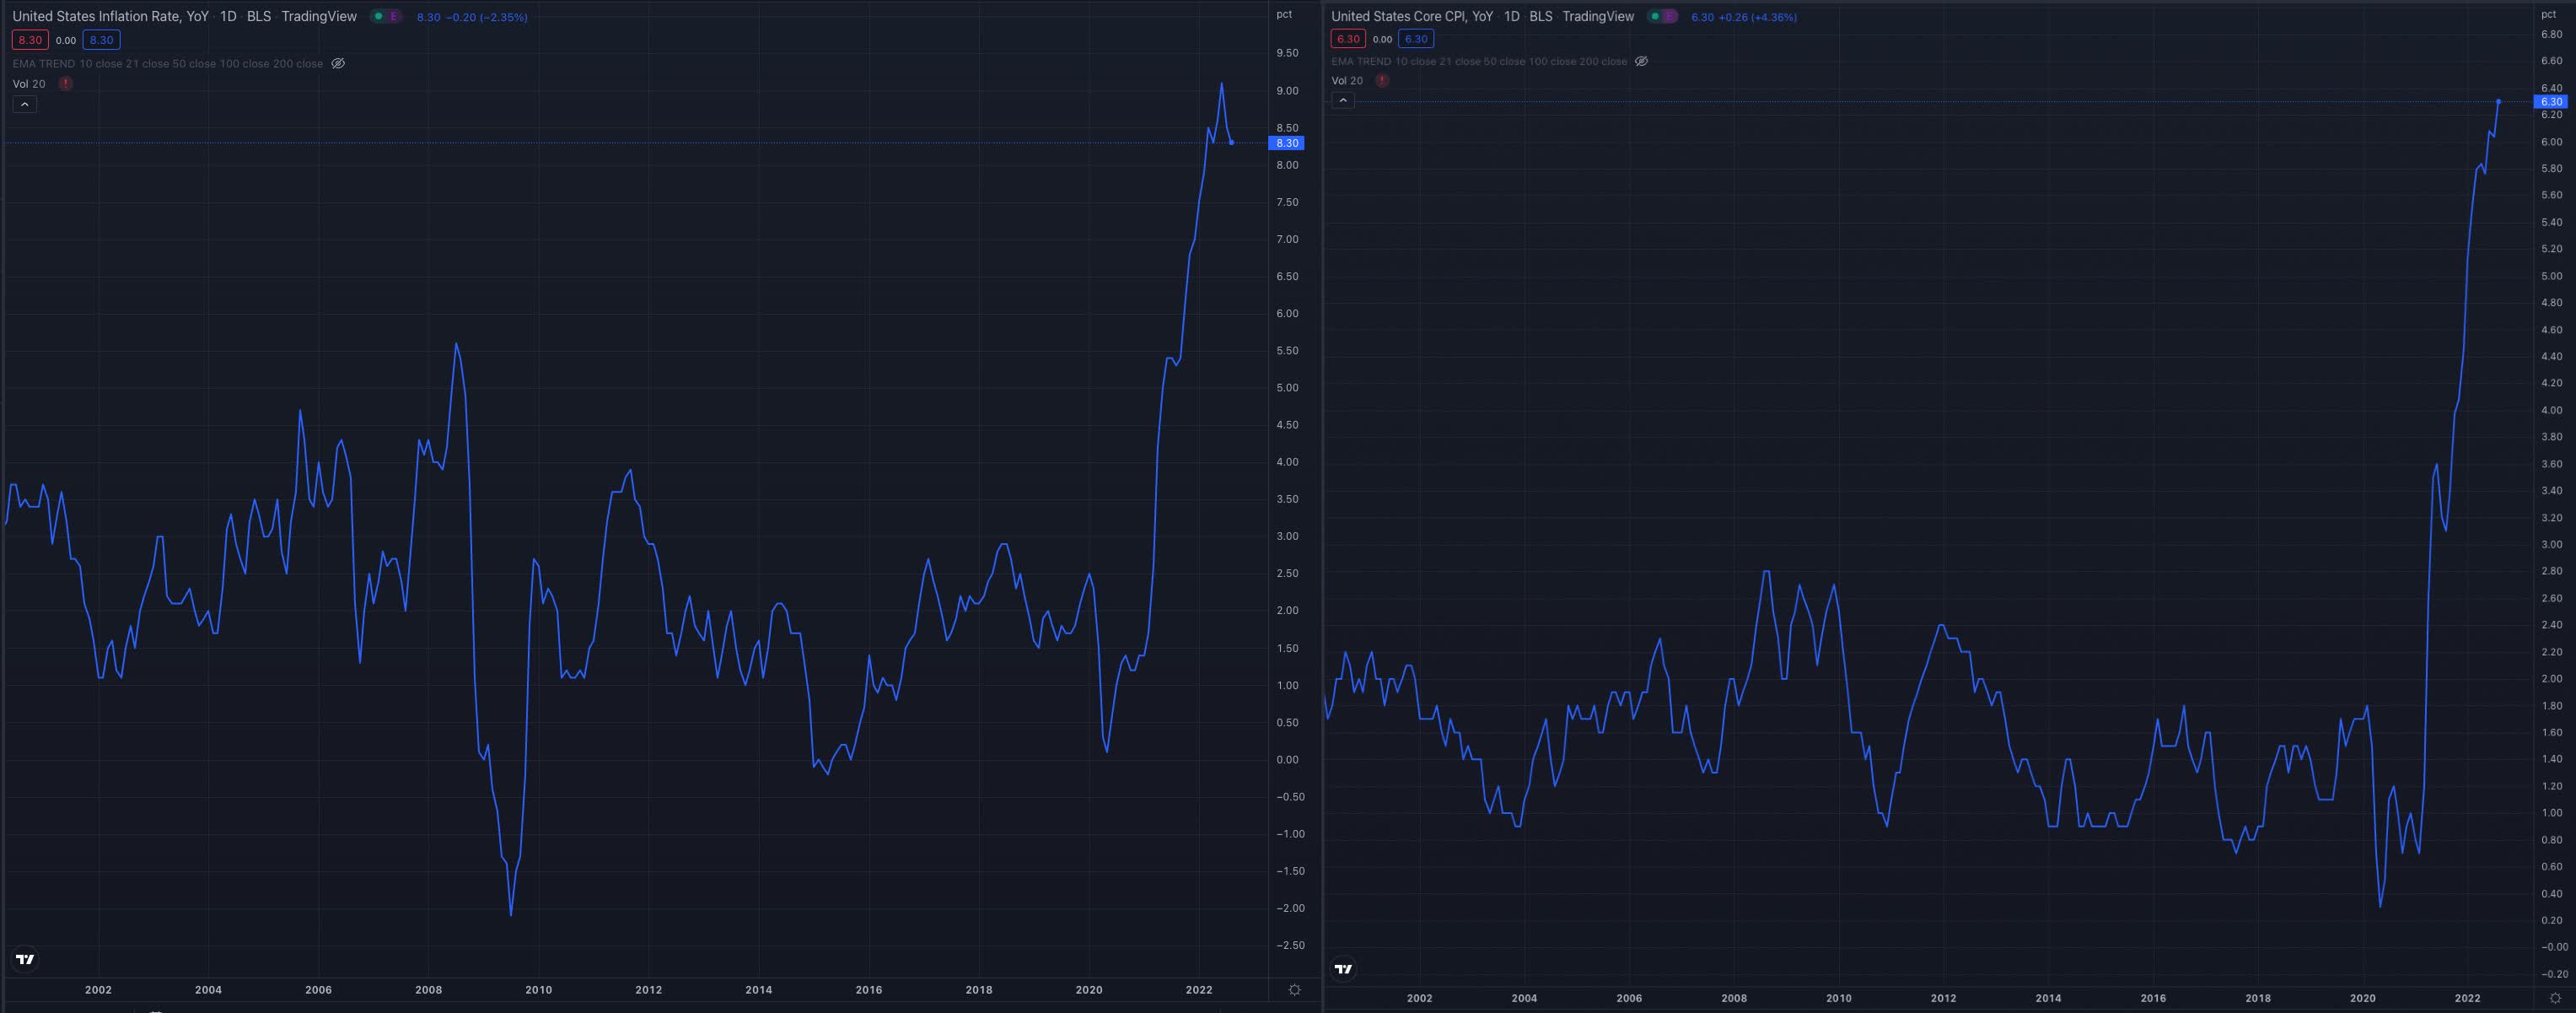
The 3 months short interest in both the SPY and the QQQ could have reached a top, as short positions seemingly start to be covered after the extended sell-off. Although this indicator individually may not be quite as important as some of the others I mentioned, it’s appropriate to observe how the sell-side is behaving as the pressure on short positions can rapidly increase in a reversal or a bear-market rally.
docoh.com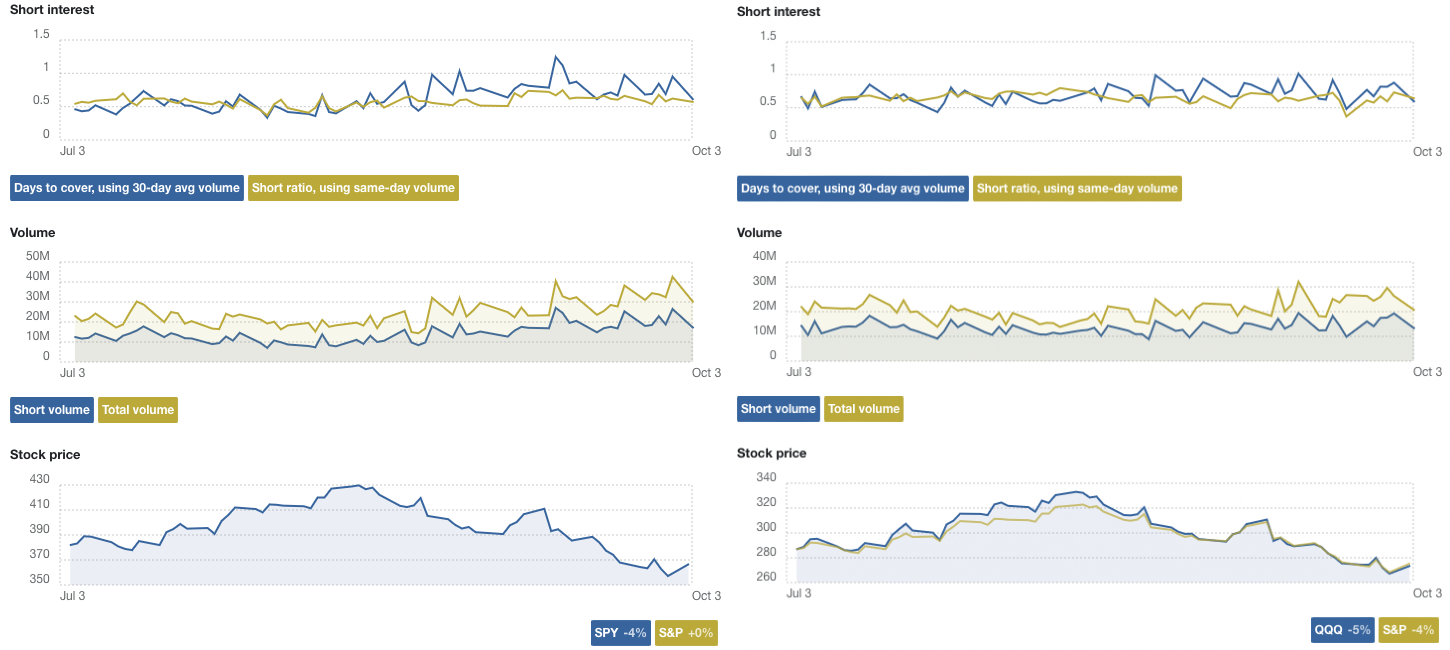
Finally, as the markets are seemingly looking forward 9-12 months, I closely observe the US consumer sentiment and the unemployment rate, as a recession now seems to be relatively priced in, and those indicators are quite important when it comes to determining the situation in the US economy and the market expectations.
Author, using FRED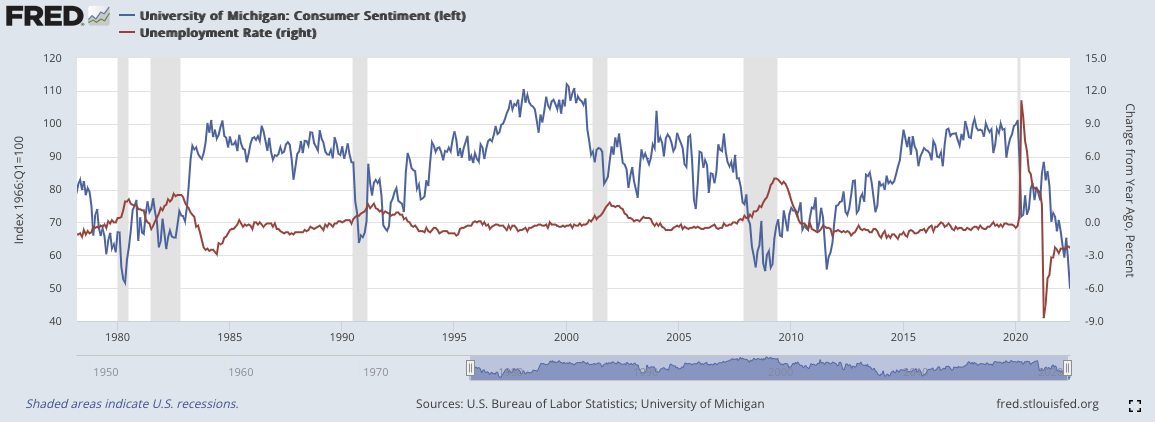
The bottom line
The S&P 500 has recently suffered its worst week since March 2020, with the index reporting a three-week losing streak and the worst September since 2022, pushing the SPY under its EMA200 which is now being tested as possible resistance. The Nasdaq 100 dropped even more, as its heavy-weight stocks are being sold off recently, hinting at a late stage of the ongoing downturn. The average bear market extends over 288 days and despite more indicators needing to be observed, the likelihood of being already over the worst part of it is increasingly high.
The key indicators I observe are suggesting that we may have seen a short-term bottom in both the SPY and the QQQ, especially as the stocks in the US seem to be oversold at the moment and the risk aversion may have peaked, offering up both as a great contrarian opportunity. This strategy offers the best returns in moments of panic in the markets and after an intense and extended sell-off but can bear significant risk, as it notoriously goes against the prevailing market trend. Risk-tolerant investors could attempt to open a long position in either the SPY or the QQQ or both ETFs, to participate in a likely rally, that could lead both underlying indexes to test their EMA50 and EMA200, projecting the SPY until 10% and the QQQ until 15% higher from their last closing price, while I would in any case set up appropriate stop-losses to limit my downside risk, as the risks are still considerably high.
“Editor’s Note: This article was submitted as part of Seeking Alpha’s best contrarian investment competition which runs through October 10. With cash prizes and a chance to chat with the CEO, this competition – open to all contributors – is not one you want to miss. Click here to find out more and submit your article today!”
Be the first to comment