

mixmotive
(This article was co-produced with Hoya Capital Real Estate)
Introduction
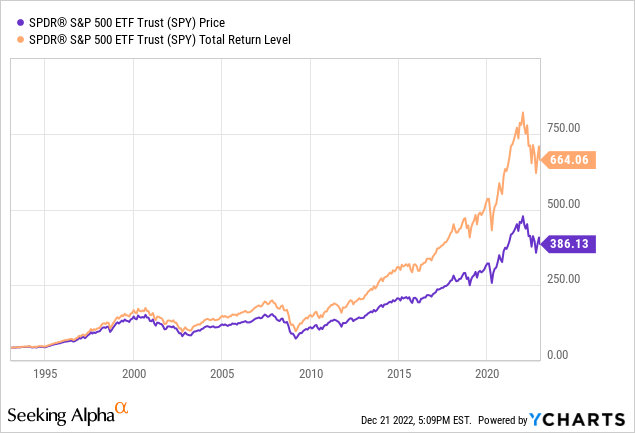
I cannot imagine any investor beyond novice status has not heard about the S&P 500 Index, which dates back to the 1950s, and is favored over the older Dow Jones Industrial Average, mostly due to the larger number of stocks included and its market-cap weighting verses DJIA’s price-weighting. The SPDR S&P 500 ETF (NYSEARCA:SPY), while not the largest by AUM, is probably the best-known ETF based on that index.
If an investor only owns funds like SPY, beating the “market” as it seems to be defined, is naturally impossible. Large fund sponsors know of this “better mouse trap” desire, and thus funds like the Invesco S&P 500 Momentum ETF (NYSEARCA:SPMO) were formed to see if that goal is achievable. Some do for short periods, few over extended time. While SPMO is achieving that goal since inception, it has done so annually only 50% of the time. Hopefully by researching both ETFs, investors can determine when (if) they should allocate some of their US equity exposure away from funds like SPY and into a fund like SPMO.
Invesco S&P 500 Momentum ETF review
Seeking Alpha describes this ETF as:
The investment seeks to track the investment results (before fees and expenses) of the S&P 500 Momentum Index. The fund generally will invest at least 90% of its total assets in the securities that comprise the underlying index. The underlying index is designed to measure the performance of approximately 100 stocks in the S&P 500® Index that have the highest “momentum score.” In general, momentum is the tendency of an investment to exhibit persistence in its relative performance; a “momentum style” of investing emphasizes investing in securities that have had better recent performance compared to other securities. SPMO started in 2015.
Source: Seeking Alpha
SPDR S&P 500 ETF review
Seeking Alpha describes this ETF as:
The investment seeks to provide investment results that, before expenses, correspond generally to the price and yield performance of the S&P 500® Index. The Trust seeks to achieve its investment objective by holding a portfolio of the common stocks that are included in the index (the “Portfolio”), with the weight of each stock in the Portfolio substantially corresponding to the weight of such stock in the index. Benchmark: S&P 500 TR USD. SPY started in 1993.
Source: Seeking Alpha
SPY has $386b in AUM and comes with 9bps in fees. Investors currently get a yield around 1.7%.
Index review
While most readers have heard of the S&P 500 Index, they might not be aware of the details involved so here is some background as provided by Standard & Poors.
The S&P 500® is widely regarded as the best single gauge of large-cap U.S. equities. According to our Annual Survey of Assets, an estimated USD 15.6 trillion is indexed or benchmarked to the index, with indexed assets comprising approximately USD 7.1 trillion of this total (as of Dec. 31, 2021). The index includes 500 leading companies and covers approximately 80% of available market capitalization.
Source: spglobal.com indices
The document provides these high-level descriptions of the methodology used.
- Universe: All constituents must be U.S. companies.
- Eligibility Market Cap: To be included, companies must have an unadjusted market cap of USD 14.6 billion or greater, and must have a float-adjusted market cap that is at least 50% of the unadjusted minimum market cap threshold. Public Float. Companies must have an investable weight factor of at least 0.10.
- Financial Viability: Companies must have positive as-reported earnings over the most recent quarter, as well as over the most recent four quarters (summed together).
- Adequate Liquidity and Reasonable Price: Using composite pricing and volume, the ratio of annual dollar value traded (defined as average closing price over the period multiplied by historical volume) to float-adjusted market capitalization should be at least 1.00, and the stock should trade a minimum of 250,000 shares in each of the six months leading up to the evaluation date.
- Sector Representation: Sector balance, as measured by a comparison of each GICS® sector’s weight in an index with its weight in the S&P Total Market Index, in the relevant market capitalization range, is also considered in the selection of companies for the indices.
- Company Type: All eligible U.S. common equities listed on eligible U.S. exchanges can be included. REITs are also eligible for inclusion. Closed-end funds, ETFs, ADRs, ADS, and certain other types of securities are ineligible for inclusion.
Some basic information provided by S&P for this index includes:
spglobal.com Index PDF spglobal.com Index PDF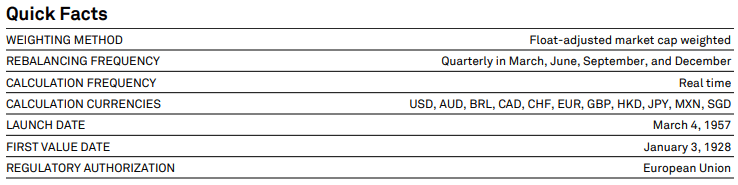
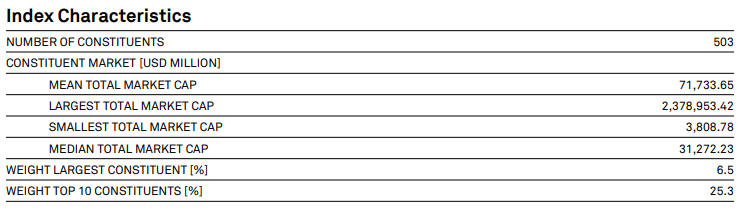
Despite the name, the Index seldom hold exactly 500 stocks anymore. Beside sector balancing or a rule violation, a major reason changes are made is a stock stops trading, usually the result of a takeover. About 20 to 25 stocks leave the S&P 500 and are replaced with other stocks that meet the guidelines for index membership annually, with changes usually are announced five trading days before the index changes. The latest change was Steel Dynamics (STLD) replacing Abiomed (ABMD), which was acquired by Johnson & Johnson (JNJ).
I will include information on sectors when I compare both ETFs.
SPY holdings review
ssga.com sectors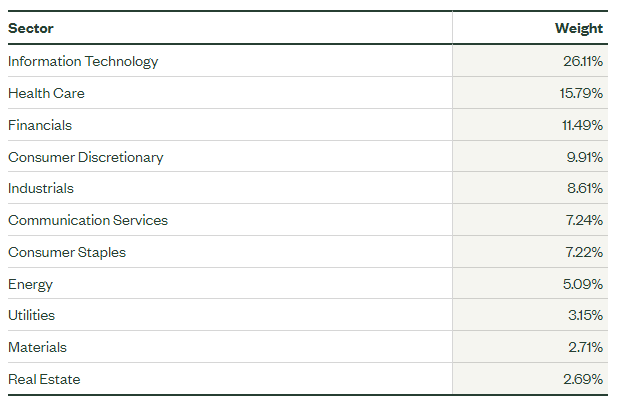
I’m sure to no one’s surprise, even after a poor performance year for the sector, Technology stocks still account for almost 26% of the portfolio. Two other sectors have a 10%+ weighting; the smallest three combined are less than that level.
ssga.com holdings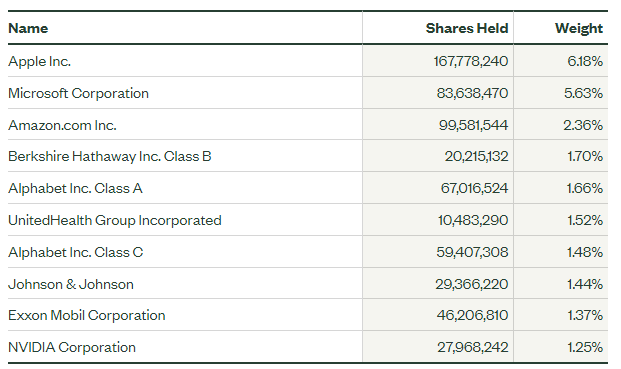
These large allocations account for 25% of the portfolio but are only 2% of the holdings. The smallest 50% of the holdings account for under 12% of the portfolio!
SPY distribution review
seekingalpha.com SPY DVDs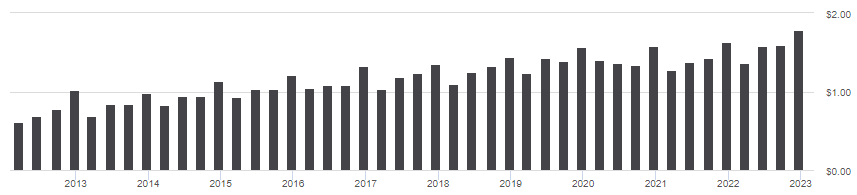
Unlike what we see for SPMO, SPY holders have seen their payout grow over the years, earning this ETF an “A+” rating for this factor.
seekingalpha.com SPY scorecard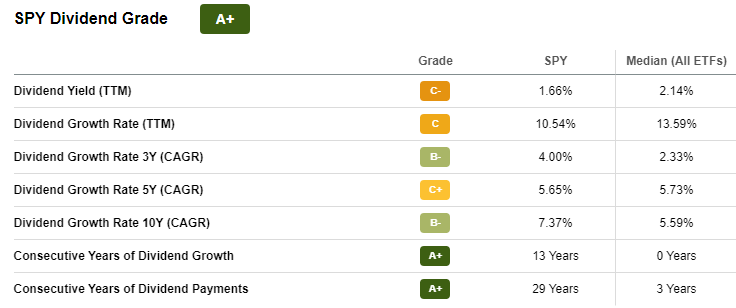
Invesco S&P 500 Momentum ETF review
Seeking Alpha describes this ETF as:
The S&P 500 Momentum ETF seeks to track the performance of the S&P 500 Momentum Index, which measures the performance of approximately 100 stocks in the S&P 500® Index that have the highest “momentum score.”. SPMO started in 2015.
Source: Seeking Alpha
SPMO has $195m in AUM and has a slightly higher fee of 13bps. The yield here is also 1.7%.
Index review
S&P describes the index and its purpose like this:
The S&P 500 Momentum is a part of the S&P Momentum Index series, which is constructed from the constituents of the S&P Global BMI or other headline benchmark indices. The index solely comprises constituents with high risk-adjusted price return momentum scores. The objective is to provide exposure to the momentum factor (the tendency of investments to exhibit persistence in their relative performance) in various markets using a transparent and rule-based methodology, and at the same time ensure reasonable level of liquidity, capacity, and turnover. The S&P Momentum Index series complements the S&P single factor indices family and can be used by investors within a strategic allocation portfolio of alternative beta strategies, as well as a tactical strategy when market conditions are favorable.
Source: spglobal.com Index
Along with the rules associated with the full S&P 500 Index, the document provides these high-level descriptions of the methodology used.
• Universe: Constituent must be a member of the S&P 500.
• Security Selection: Securities are first ranked in descending order by momentum score into five quintiles. Securities with the highest scores (quintile 1) are then selected to be included in the index.
• Weighting: Constituents are weighted by the product of the market capitalization in the eligible index universe and their momentum score, subject to security constraints. The maximum weight of each security is the lower of 9% and three times its market capitalization in the eligible index universe. Investable weight factors, which define the available float for each stock, are reviewed annually. The float-adjusted shares are used in the calculation of each stock’s momentum weight.
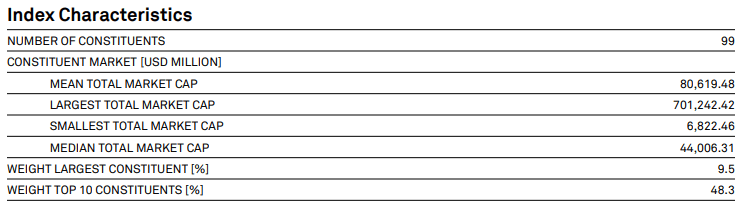
Some basic information provided by S&P for this index includes:
spglobal.com Index PDF spglobal.com Index PDF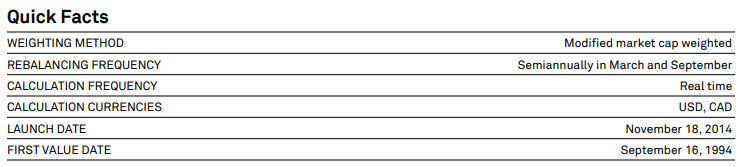
SPMO holdings review
invesco.com sectors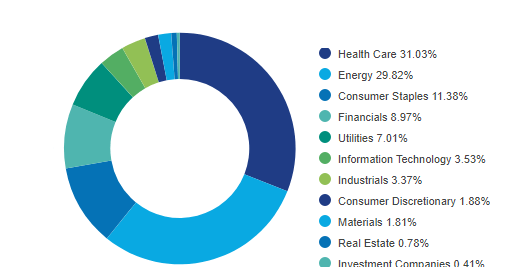
These will be discussed later when the ETFs are compared and in the Portfolio strategy section of this article. By market-cap and style, we see:
invesco.com MC/Style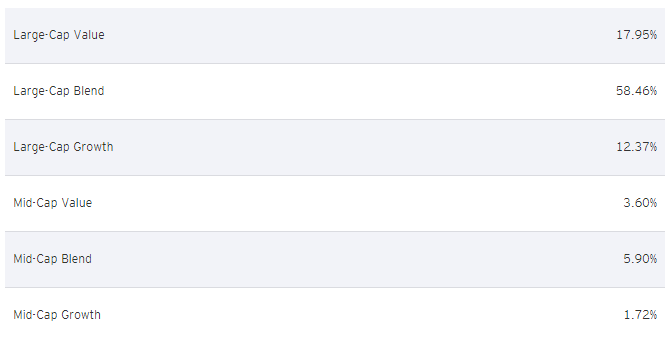
Considering several sites classify this as a Large-Cap Growth ETF, the current allocations seem to reflect more of a Blended style. The top 20 holdings, accounting for 64% of the portfolio are:
invesco.com; compiled by Author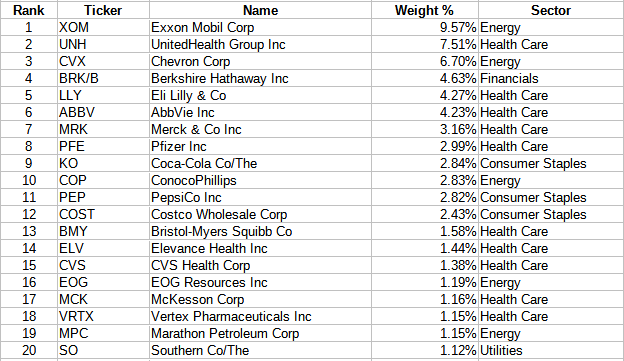
In SPMO, the bottom half of the portfolio accounts for just under 14%, just slightly more than that share of SPY’s portfolio.
SPMO distribution review
seekingalpha.com SPMO DVDs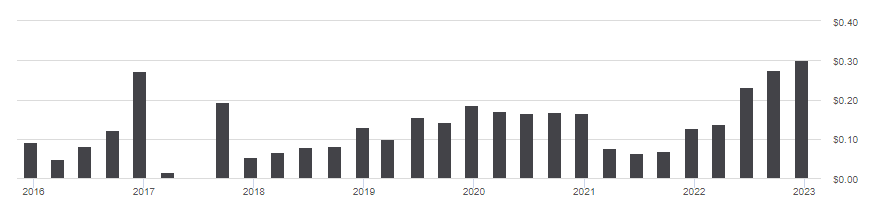
The payout pattern I am sure is driven by the constantly changing turnover, which has been above 70% in each of the last four years. Seeking Alpha’s grading system give SPMO a respectful “B+”.
seekingalpha.com SPMO scorecard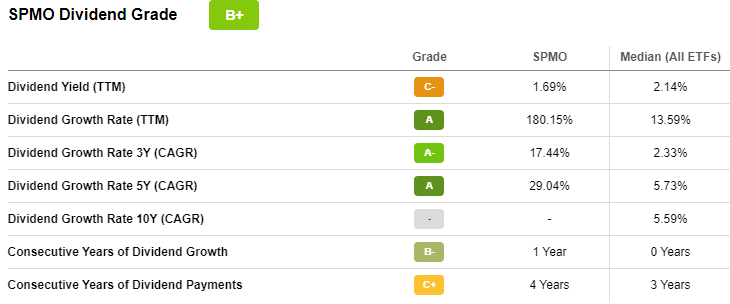
Comparing ETFs
First, some basic data points for each ETF:
Fidelity.com; compiled by Author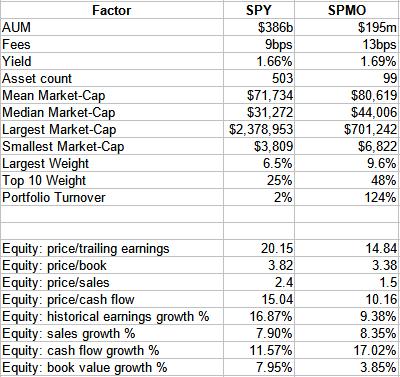
As expected, SPMO is more concentrated with only 20% of the holdings that SPY allocated to. Price ratios favor SPMO, with the Growth ratio split as to who has the better set. SPMO’s allocation seems to eliminate more of the smaller market-cap stocks as its Mean and Medians are larger.
As for how they match up sector and largest holdings, the ETFRC.com website was used. There are major differences that need to be evaluated by any potential investor choosing between these ETFs.
ETFRC.com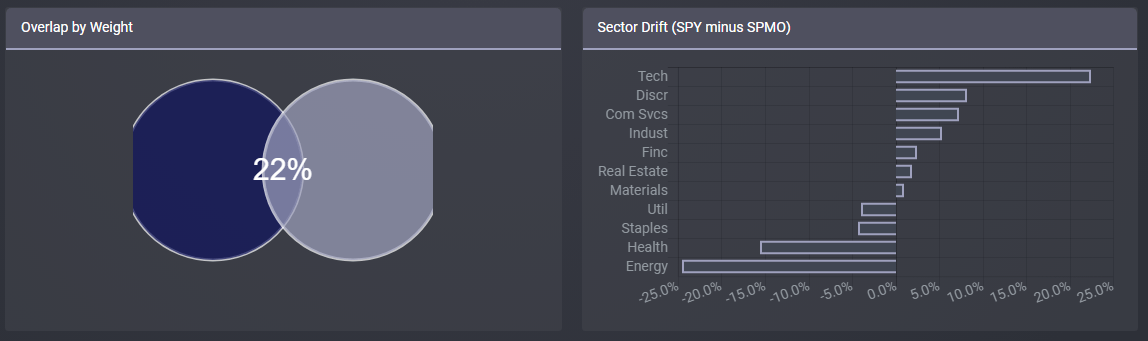
SPMO’s Technology weight under 4%, versus over 26% for SPY. SPMO is most overweight, compared to SPY, in Health Care (30.6% vs 15.2%) and Energy (30.5% vs 11.6%), even though they represent the 2nd and 3rd largest allocation in SPY! There are large differences in almost all the other sectors too. This is how that effects the largest holdings in each ETF.
ETFRC.com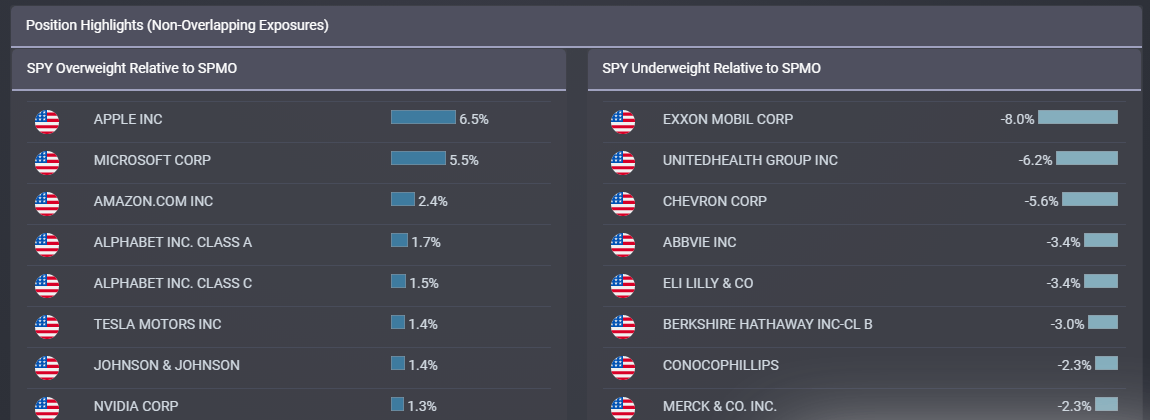
While the above are current snapshots, the following is history from when SPMO started in 2015 until the start of December 2022.
PortfolioVisualizer.com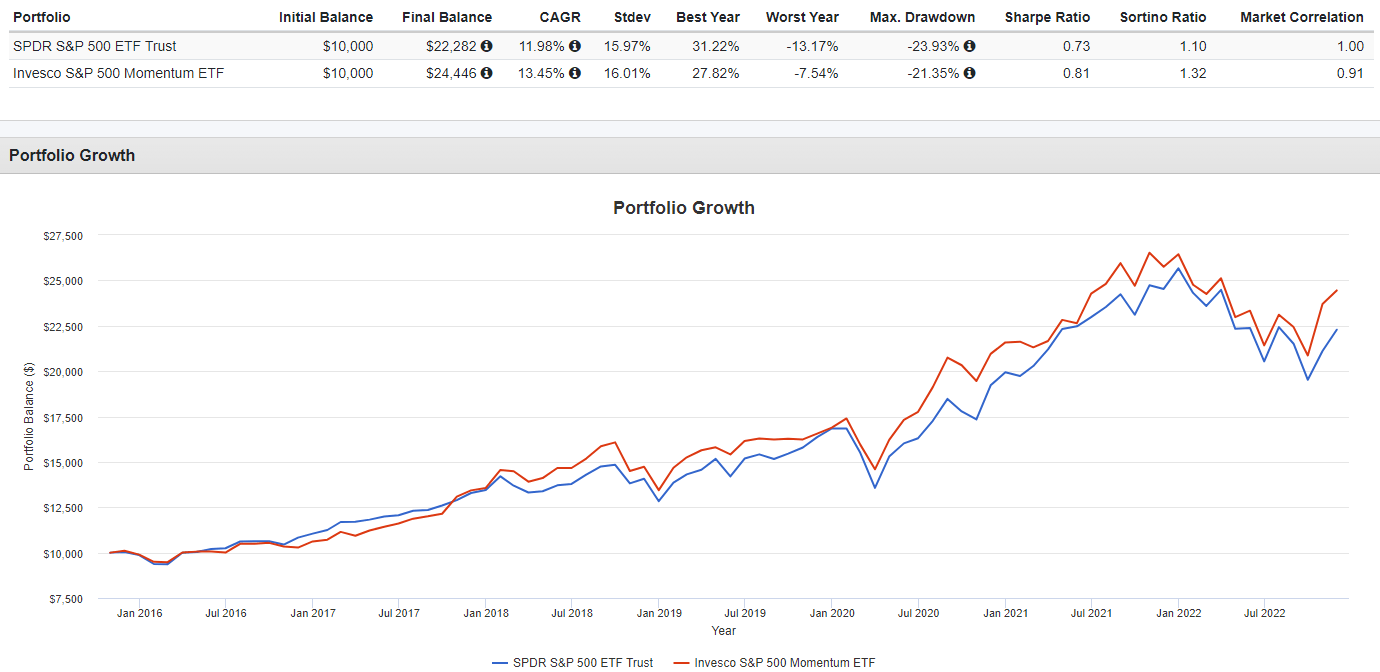
Along with its 147bps CAGR lead, SPMO’s slightly higher StdDev still results in superior ratios as measured by Sharpe and Sortino. Another benefit for SPMO is the ETF is only 91% correlated to the US stock market.
The next table compares both ETFs on all the ratings provided by Seeking Alpha.
seekingalpha.com ETF homepages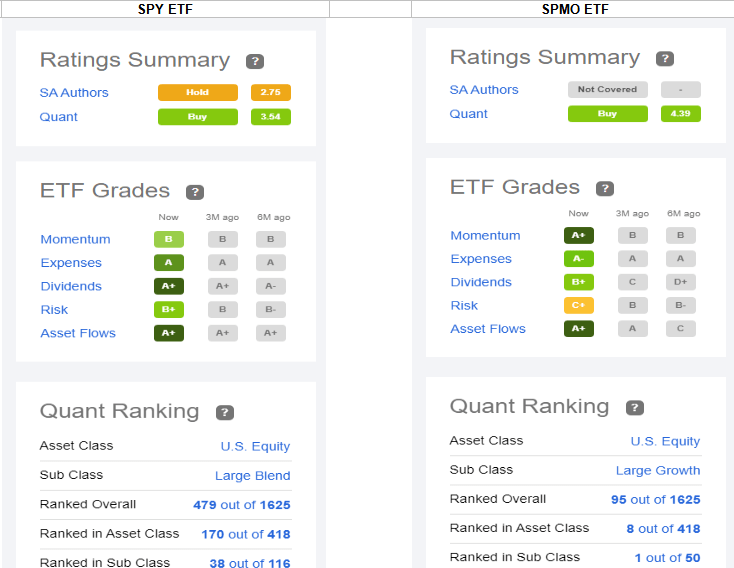
An important distinction is, like other sites, SPY is classified as a Large-Cap Blend ETF; whereas SPMO is a Large-Cap Growth ETF. At the top level, US Equity Asset Class, SPMO ranks #95 versus SPY at #479.
Portfolio strategy
Having more than seven years of history would be great in having to truly evaluate the momentum strategy compared to the full S&P 500 Index one. Backtesting the SPMO Index to 2012 shows the TR index 140bps ahead of the S&P 500 TR index. Investors are betting that the momentum algorithm will continue to work. I did find sector weight for SPMO from 2/28/22; they differ greatly from todays, while I would assume SPY’s changed mostly based on market movement (I couldn’t find a matching sample).
multiple pages: compiled by Author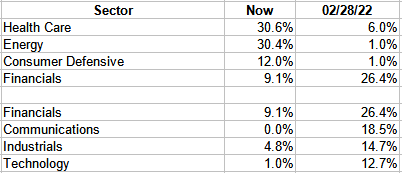
The top set compares the today’s top four sectors with the 2/28/22 allocations; the bottom set does that based on the top four sectors from last February. Both show how SPMO is very dependent on the benchmark rules continuing to perform. It is definitely a choice between two difference approaches.
Related articles
I have done other articles on funds going for that “better mousetrap” than SPY. While most, long-term, fail, the articles give clues as what to look for in this search.
Be the first to comment