

John Kevin
As we do each Monday in our Closer report, we reviewed the latest data from Friday’s release of the CFTC’s Commitments of Traders (CoT) Report. This data shows how speculators are positioned in various assets based on positions in the various futures contracts. One asset that has seen some of the most notable changes in the report in recent weeks has been the S&P 500. As recently as one month ago, that data showed a net 1.29% of open interest was positioned long. Even though the S&P 500 has managed to come off the lows in the past month, positioning has collapsed with a massive move lower meaning there are far more speculators positioned short than long.
Whereas one month ago the reading was net long, in the latest data as of last Tuesday a net 9.3% of open interest was short. That made for the lowest reading since October 2015. In other words, speculators are positioned more pessimistically now than they were during the COVID crash, in late 2018 near a bear market, or any other time over the past several years. The change in positioning has also been rapid. As shown in the second chart below, that net positioning reading has fallen over 10 percentage points in just 4 weeks. Earlier this year in March there was an even larger 12.5 percentage point decline but prior to that, looking back through the history of this data, such large moves have been much rarer over the past decade than was the case in the 2000s before. In fact, prior to this year, the last time positioning in S&P 500 futures fell double digits in four weeks was all the way back in August 2011. On the other hand, the early 2000s frequently saw moves of this size if not larger.
Author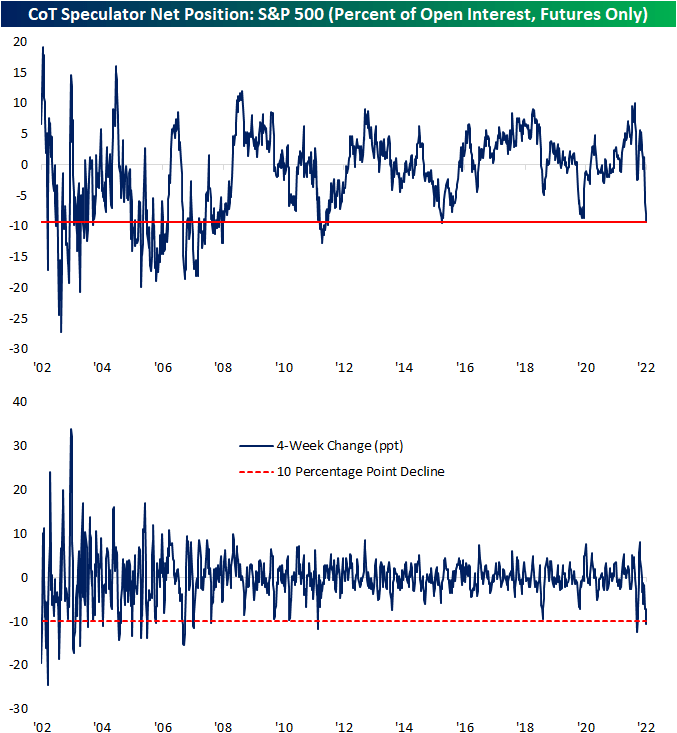
Typically, sentiment data is considered contrarian in nature. In other words, pessimistic sentiment readings are followed by a stronger forward performance of equities and vice versa. That has not exactly been the case for this CoT positioning data. Following past declines of at least 10 percentage points, returns have been mixed.
After declines of similar magnitude, the S&P 500 has experienced modest outperformance over the next week. One and three months out, however, have tended to be weaker with positive returns only half the time with negative returns on an average basis. Over the next month, each of the past four instances has been followed by declines.
Six and twelve months out have seen the S&P 500 higher two-thirds of the time, but average and median returns are not significantly better relative to all periods.
Author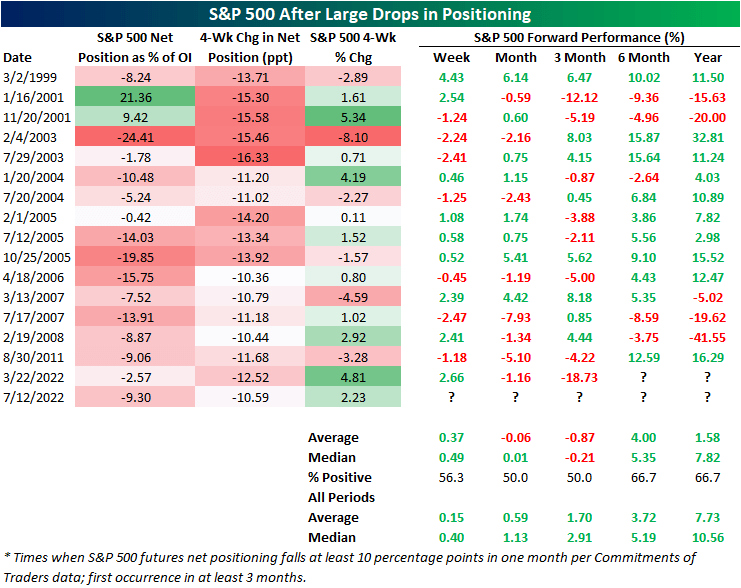
Editor’s Note: The summary bullets for this article were chosen by Seeking Alpha editors.
Be the first to comment