

martince2
As many of my followers know, I have a passion for the boardgame Monopoly, and perhaps that’s also the reason I love owning shares in real estate investment trusts (“REITs”).
As a kid I would love circling the board in pursuit of owning the trophy properties like Boardwalk, Park Place, and Pennsylvania Avenue.
Of course, the obvious reason for owning these properties is because they pay more rent than the more affordable (cheapest) properties – Baltic Avenue and Mediterranean Avenue.
By playing Monopoly, I learned a lot about the strategy for winning and thus building powerful scale advantage so that I could crush my opponents.
Now you know why I love REITs!
The first version of Monopoly was actually called “The Landlord’s Game,” developed in 1906 by American anti-monopolist Lizzie Magie.
According to Wikipedia, at the age of 26 she received a patent for her invention that made the typewriting process easier by allowing paper to go through the rollers more easily.
She also worked as a news reporter for a brief time in the early 1900s, and later she applied to the US Patent Office for a patent on her board game (she was granted a U.S. Patent on January 5, 1904).
Original version of The Landlord’s Game wikipedia.org
Today I wanted to begin a series called The Landlord’s Game and start with the Apartment REIT sector.
One terrific thing about REITs today, and I’m certain that Mrs. Magie would agree, is that there are so many different ways to roll the dice and build a monopoly of dividends.
I find it interesting that Mrs. Magie was “Georgist,” which means she believed that:
“people should own the value they produce themselves, the economic rent derived from land—including from all natural resources, the commons, and urban locations—should belong equally to all members of society.”
Similarly, the REIT vehicle was designed for individual investors in which these businesses must payout at least 90% of their taxable income in the form of dividends. So these “economic rents derived from the land” are shares with the stakeholders – similar to Mrs. Magie’s beliefs in the early 1900s.
So, without further ado, let’s start the first series of “The Landlord’s Game” with a look at three popular Apartment REITs.
Apartment REIT #1 – AvalonBay Communities, Inc. (AVB)
Let’s begin with the largest apartment REIT by market cap, which is AvalonBay Communities. AvalonBay currently trades at a market cap of $28.9 billion.
On the year, shares of AVB are down 17%.
YCharts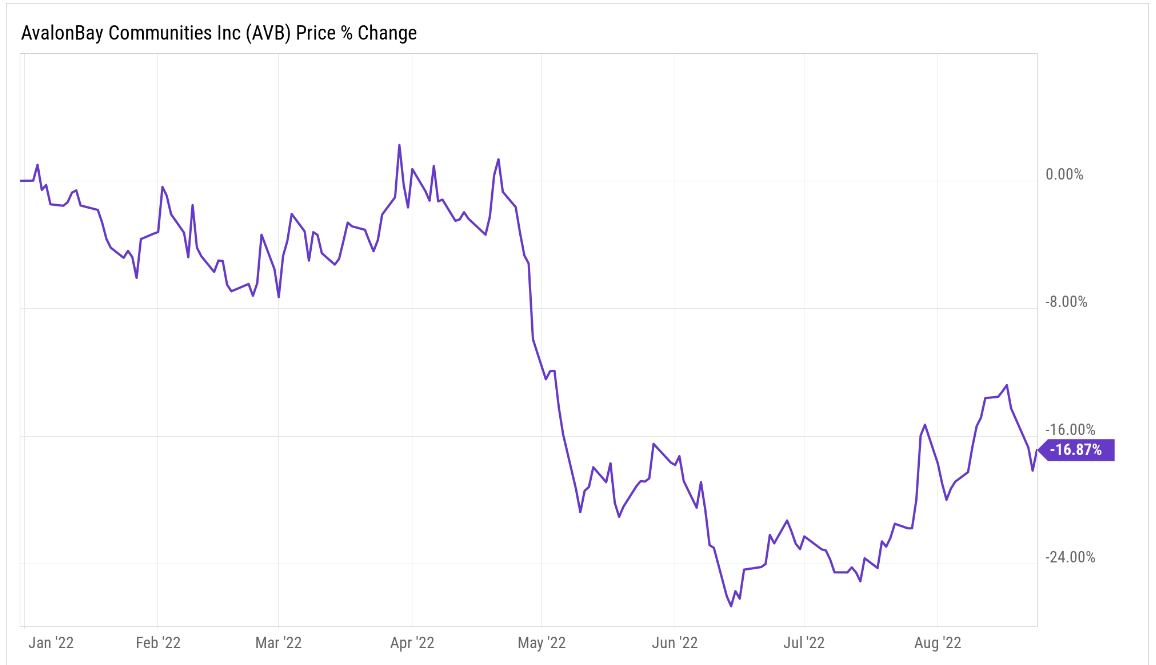
AvalonBay has a multi-family portfolio that is well-diversified across the entire United States.
- New England region has 9.774 apartment homes and accounts for 15.2% of AVB’s rental revenue.
- Metro New York & New Jersey region has 11,641 apartment homes and accounts for 20.1% of AVB’s rental revenue.
- Mid-Atlantic region has 12,931 apartment homes within the region. In terms of rental revenue, this region accounts for 15.0% of AVB’s rental revenue.
- Northern California has 12,126 apartment homes and accounts for 17.7% of AVB’s rental revenue.
- Southern California has 16,768 apartment homes and accounts for 22.7% of AVB’s rental revenue.
- The remaining 9.3% of the portfolio is spread across regions such as Southeast Florida, Denver, CO, and the Pacific northwest.
Having a portfolio that is not focused in one general region helps solidify a portfolio and protect it from certain disasters that could go on within a particular region, whether it is a natural disaster, economic, or even political disaster.
As of June 30, 2022, the Company owned or held a direct or indirect ownership interest in 299 apartment communities containing 89,037 apartment homes in 12 states and the District of Columbia, of which 17 communities were under development and two communities were under redevelopment.
AvalonBay has benefited greatly under recent inflationary market conditions. The price of owning a home continues to rise, as has the price of many necessities, such as food and gas. Thus, the demand for apartment rentals has increased driving up the price of rents as well.
During the company’s most recent quarter, AVB saw rental revenues for same-store communities rise 13%. Much of this was directly related to lease rates rising 7.6% during the quarter when compared to prior year. Net Operating Income was positively impacted as well, as NOI increased 17% year over year.
AVB Q2 Investor Presentation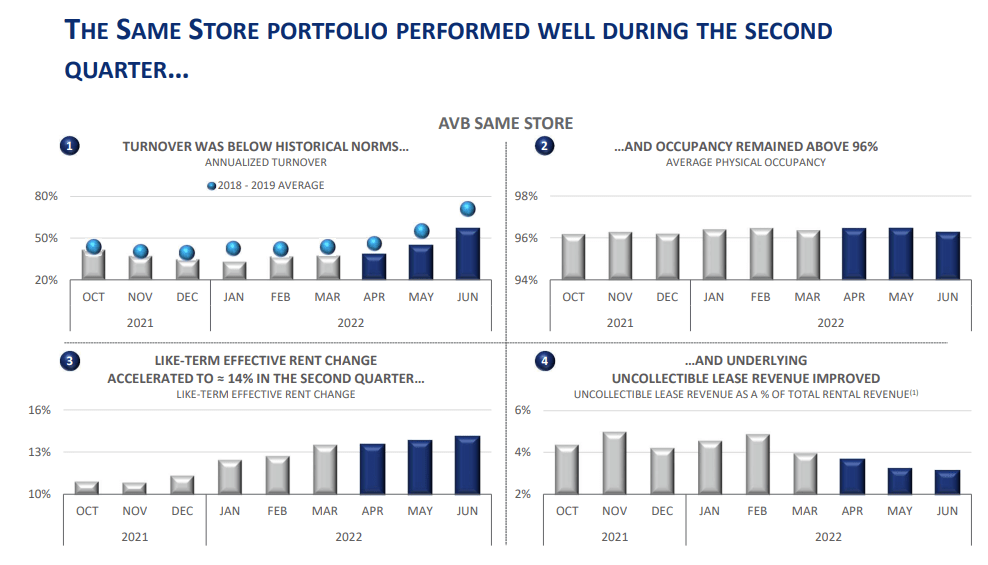
Occupancy during the quarter remained above 96%, ticking higher by 10 basis points over Q1. Turnover remained below historical norms and uncollectible leases remained very low, all pointing to a very strong tenant base as it currently stands.
One area where AvalonBay’s acquisition team has excelled is in their ability to scope out properties with potential. Potential to redevelop a property or give it a face lift in order to make it more attractive and increase rents.
A few roadblocks for the company could be a worsening economic backdrop, which could result in an uptick in uncollectibles. Also, rising interest rates could also slow down the company moving forward.
However, you can take solace knowing the company has an A- rated balance sheet, something only a handful of REITs can claim fame to. This supports not only the overlapping business but also the company’s 3.1% dividend yield. The dividend is well covered by a low payout ratio of only 69%.
AvalonBay is not only one of the best apartment REITs you can buy, but they are also one of the highest quality REITs in general. In terms of valuation, shares appear to be fairly valued. AVB shares are not screaming buy as they currently trade at a forward P/AFFO multiple of 21.1x. Over the past five years, the company has traded closer to an adjusted funds from operations (“AFFO”) multiple of 22x.
FAST Graphs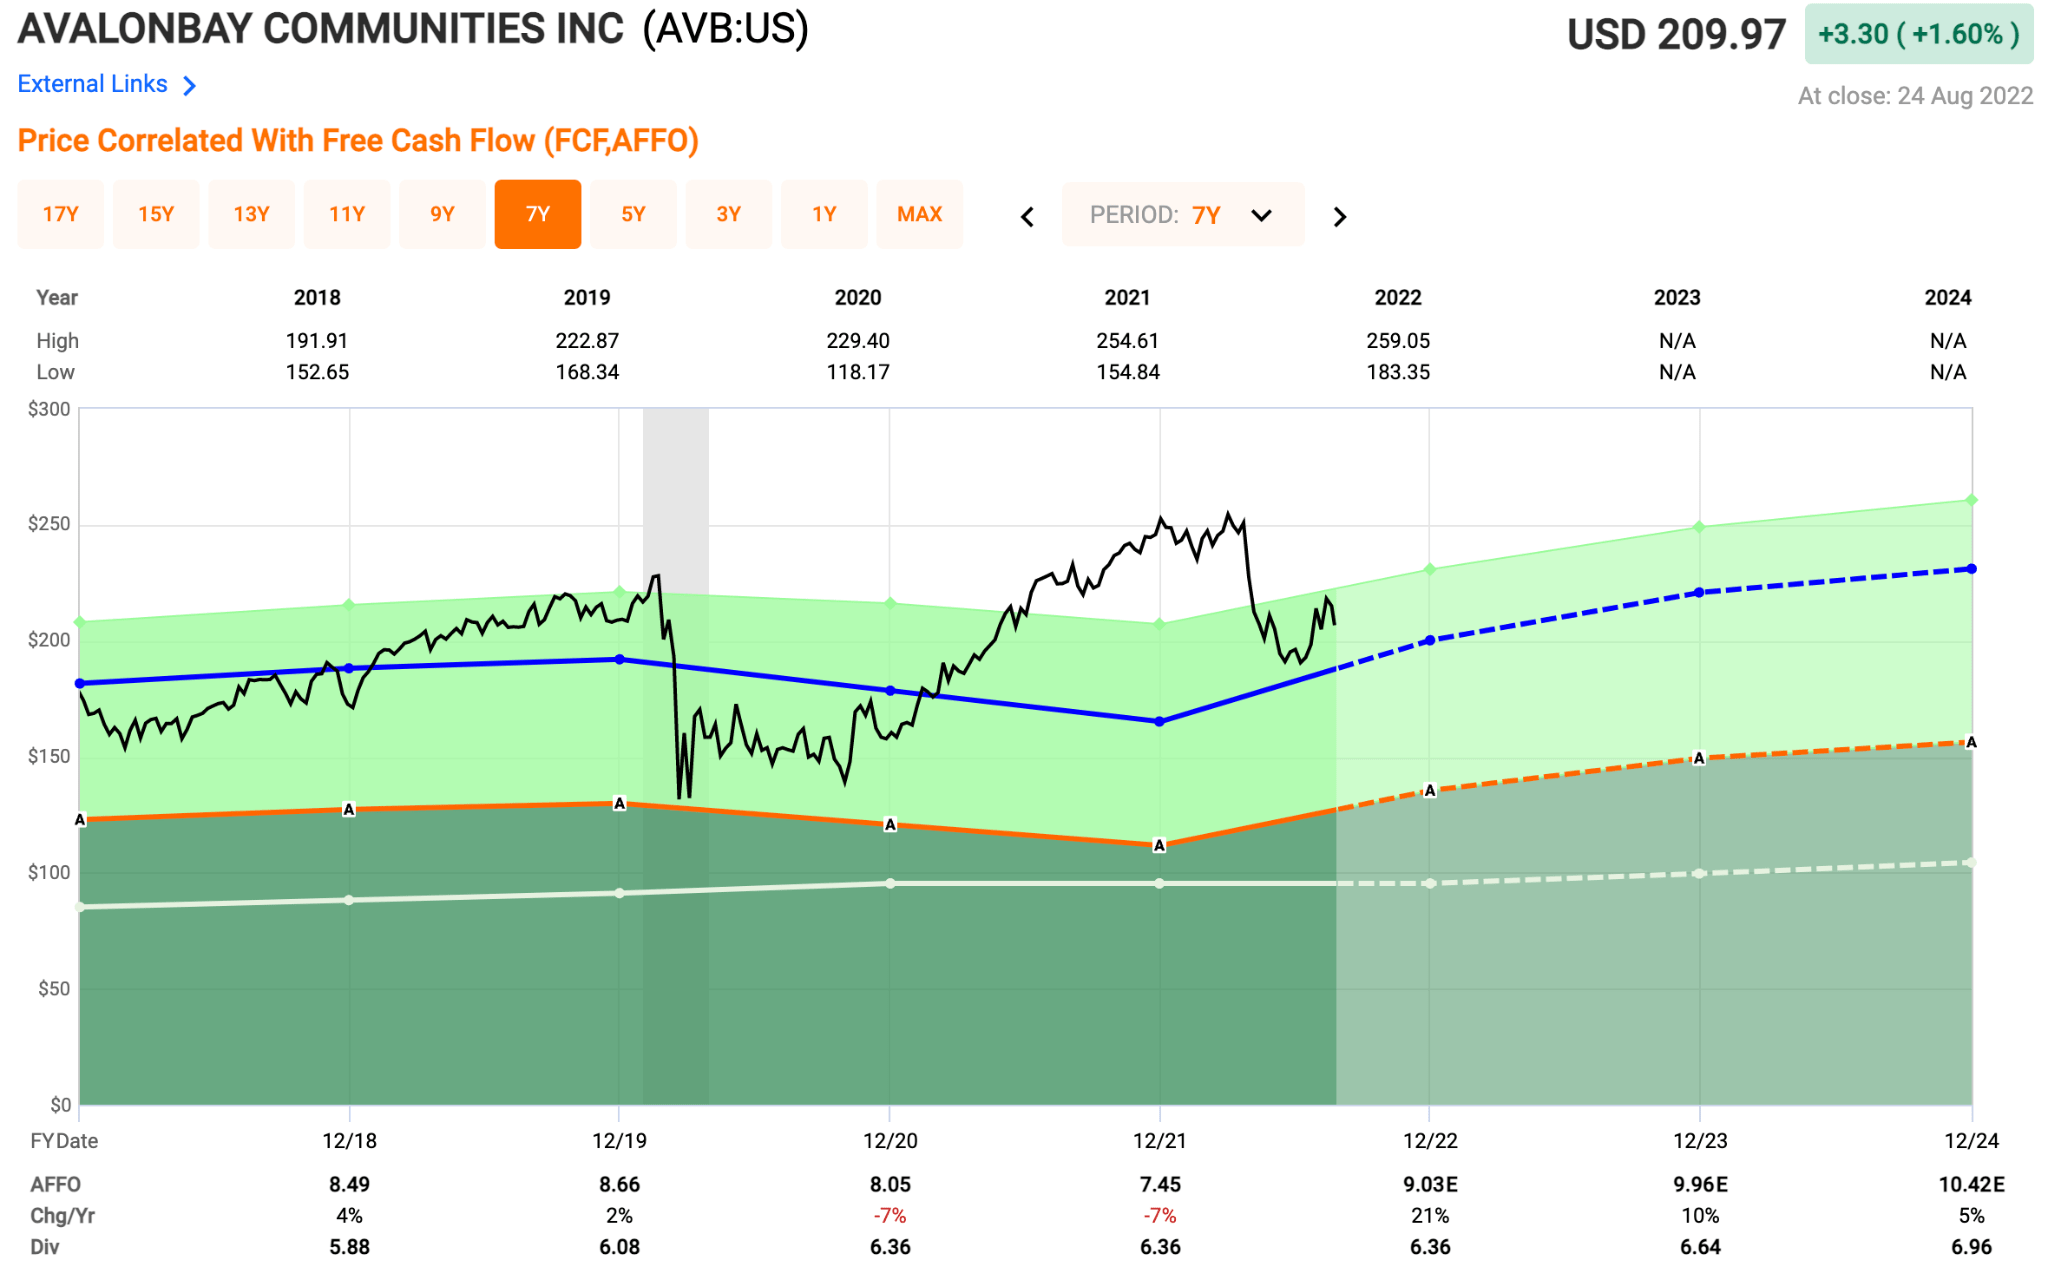
Just this past week, Wolfe Research upgraded shares of AVB to “Outperform” and many analysts have a price target above $225. A share price below $200 is when things start to look a little more intriguing.
Apartment REIT #2 – Equity Residential (EQR)
Equity Residential happens to be the second largest apartment REIT on the market today, with a market cap of $28.9 billion.
Similar to that of AVB, shares of EQR are down 15% year to date.
YCharts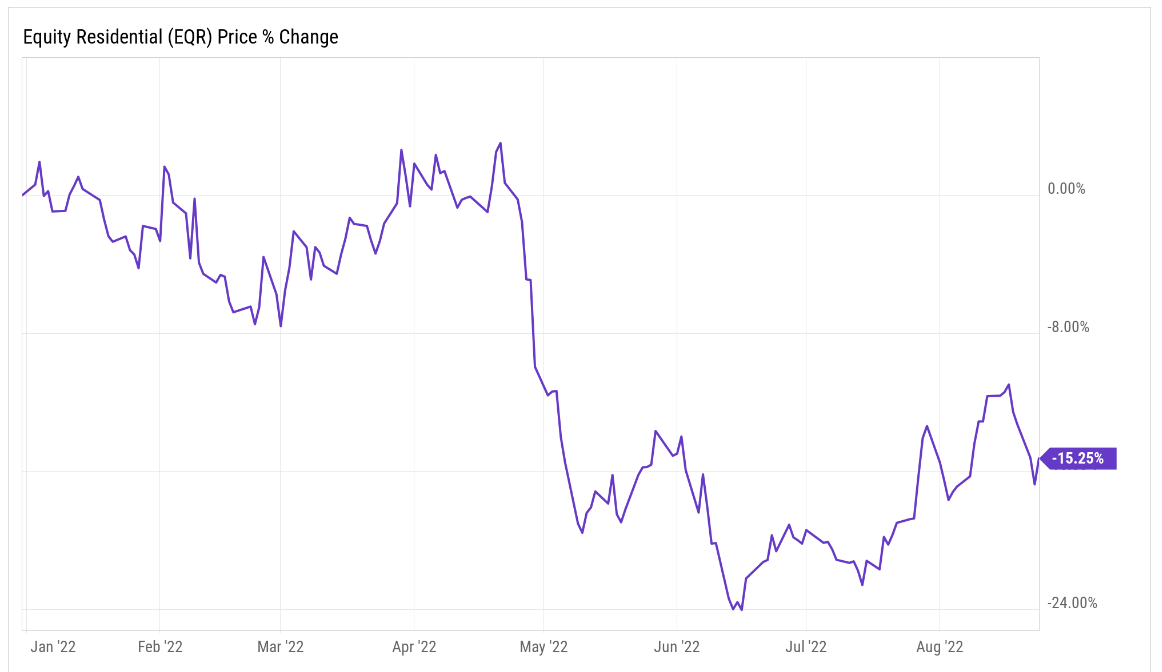
EQR has built a portfolio that includes 310 properties that consists of over 80,000 apartment units. These properties are located in the following regions: Boston, New York, Washington, D.C., Seattle, San Francisco and Southern California, and an expanding presence in Denver, Atlanta, Dallas/Ft. Worth and Austin.
As you can see below, the company has a major focus on coastal urban/suburban markets, but is building a middle-America presence as well.
EQR June Investor Presentation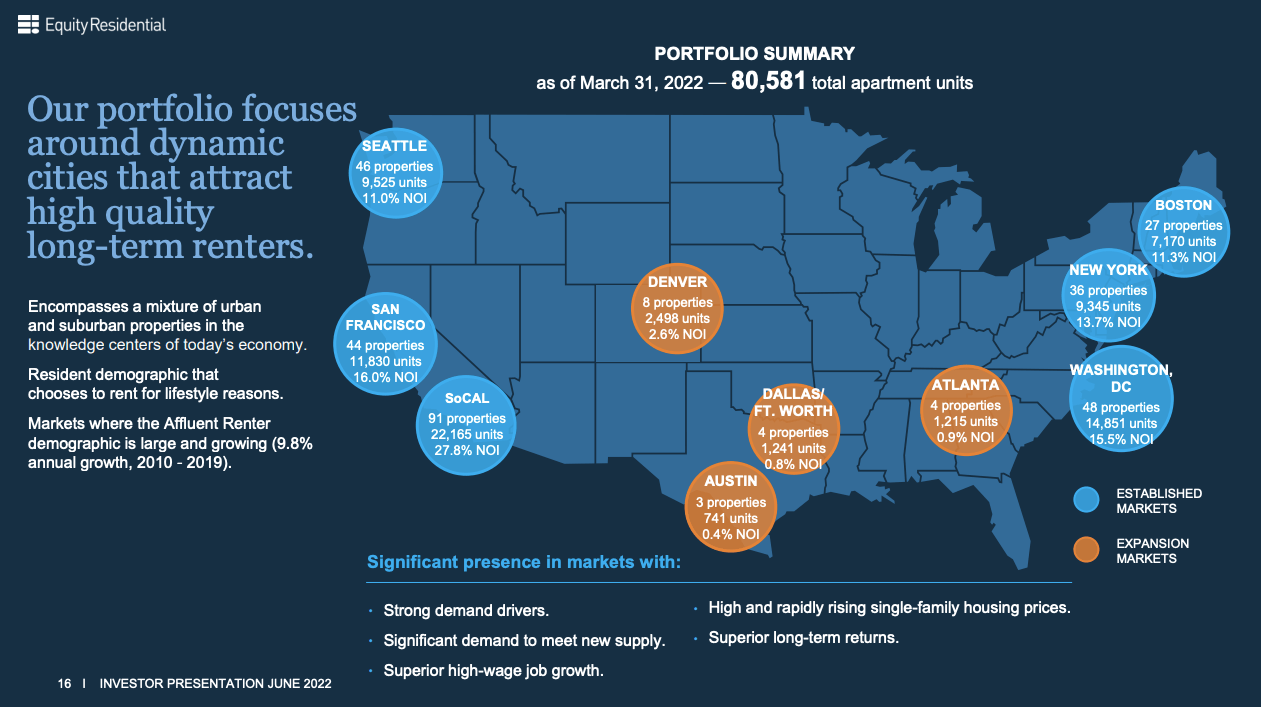
During the company’s second quarter, EQR saw rental revenues for same-store properties climb 13.7%, which is slightly higher than the 13% AVB saw during the same period. Again, much of this, roughly 8%, was driven by higher lease rates.
Occupancy for the quarter was 96.4% with NOI increasing 19.1% year over year.
So why is the stock down nearly 20% you might ask?
Well, for starters, many of the apartment REITs got way ahead of themselves at the end of ‘21, with valuations that were merely unsustainable. It can be quite confusing if you are just looking at the results now and see how well the company is performing in relation to its stock performance.
Remember, the market is a forward-looking index, as such, investors knew the previous valuations were unsustainable, plus they have added doubts regarding the company’s abilities to keep growing at this rate in the face of rising interest rates.
Higher rates and a slowing economy, could put an end to the party for many apartment REITs, as occupancies would undoubtedly fall.
However, this is where EQR is a little different than the typical apartment landlord. As we saw in the slide above, EQR has properties primarily up and down the coasts, which tend to skew towards higher income individuals. This can be looked at as a buffer for the company, as many of the tenants have plenty of cushion between their income and rent.
The median age of an EQR tenant is 32 years old with an average household income of $166,000, where rent accounts for less than 20% of income.
EQR June Investor Presentation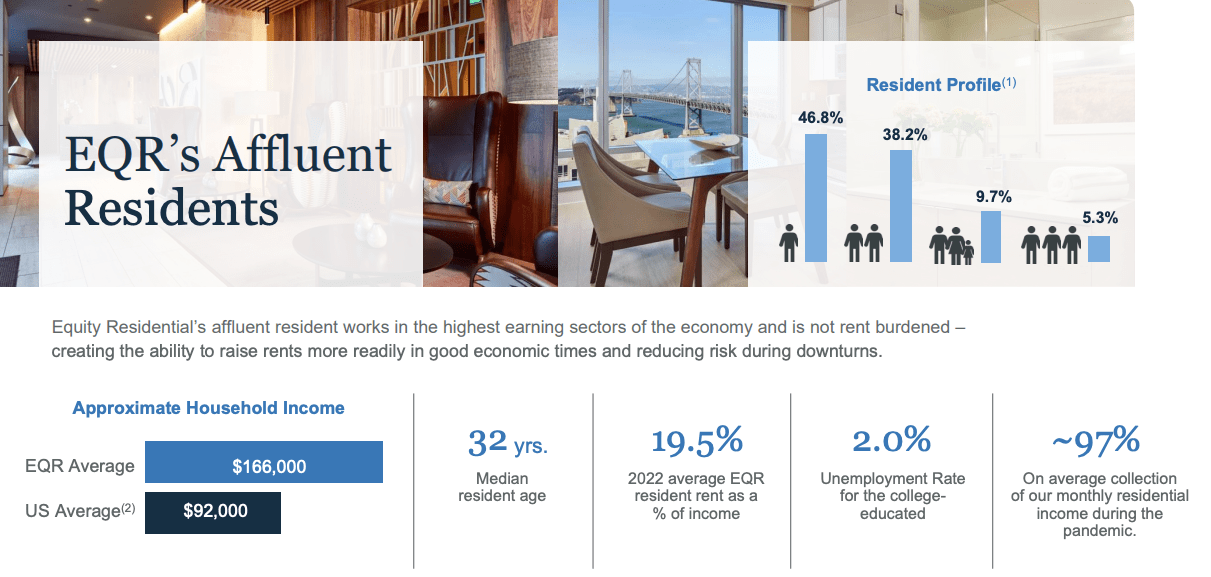
As you just saw, AVB and EQR are performing quite similar to one another both in terms of company’s performance and stock performance. However, I skew more towards EQR in terms of having a “safer” tenant base just due in part to its property locations.
Since 2011, EQR has registered a 6.4% dividend CAGR. Currently, shares of EQR pay an annual dividend of $2.50 which equates to a dividend yield of 3.3%. The dividend is backed by a strong A- rated balance sheet and a low payout ratio of 71%.
EQR June Investor Presentation
In terms of valuation, analysts expect 2023 of $3.39, which equates to a forward AFFO multiple of 22.6x. Over the past five years, shares have traded closer to an average of 24x, indicating shares are slightly undervalued on a forward looking basis.
At iREIT, we place a fair value on shares of EQR closer to $73, and would prefer buying below this amount, as such, we currently rate the shares a HOLD.
FAST Graphs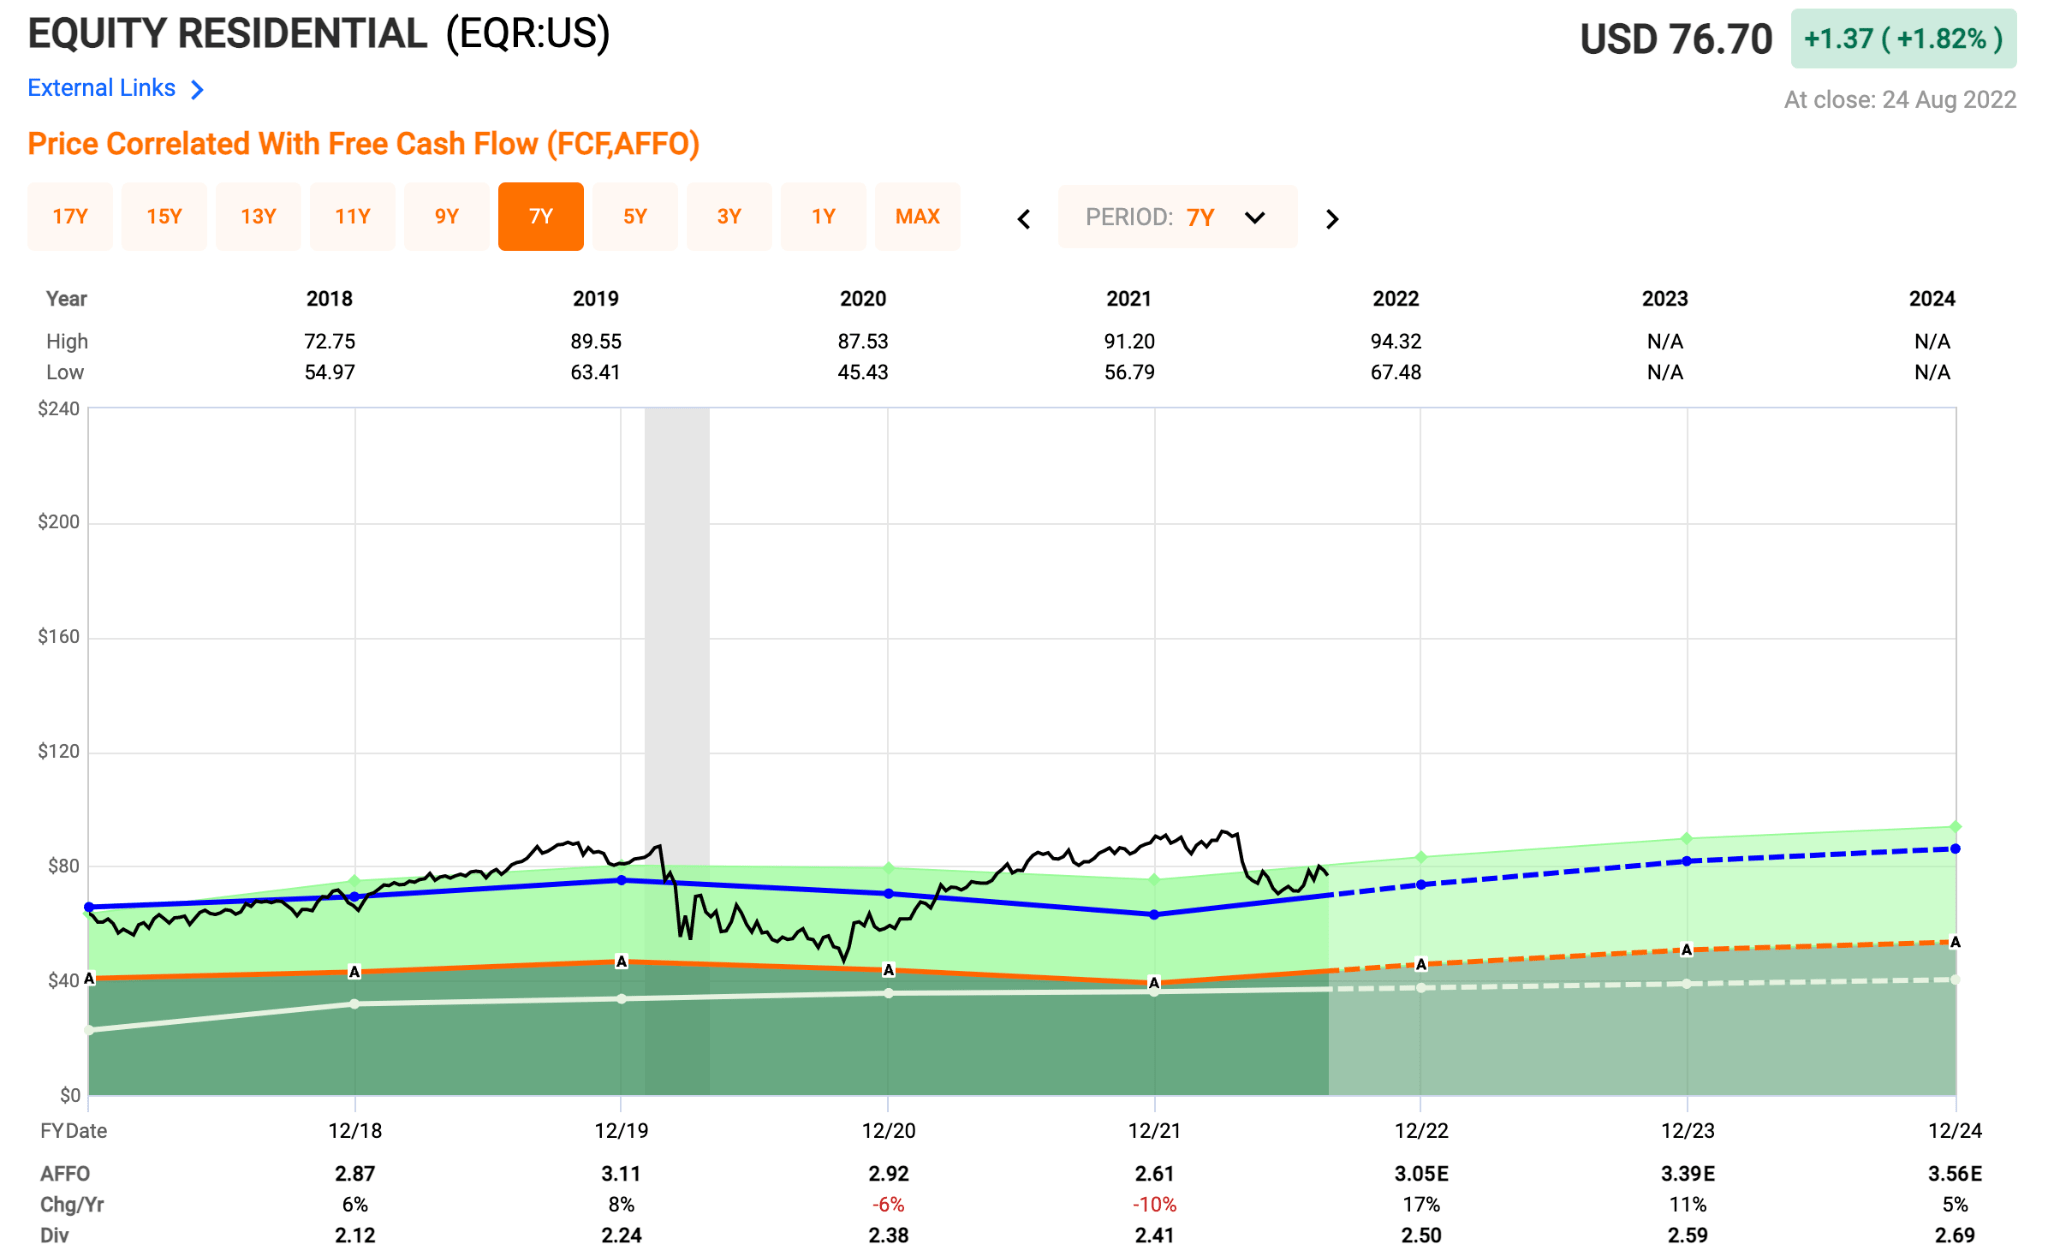
Apartment REIT #3 – Essex Property Trust, Inc. (ESS)
The final apartment REIT we will look at today is not quite as big as the other two in terms of market cap, but still a sizable apartment REIT and high-quality one at that. Essex Property Trust has a market cap of $18.3 billion.
In line with the other two apartment REITs, ESS has also found it to be tough sledding in 2022, as shares have fallen 20% year to date.
YCharts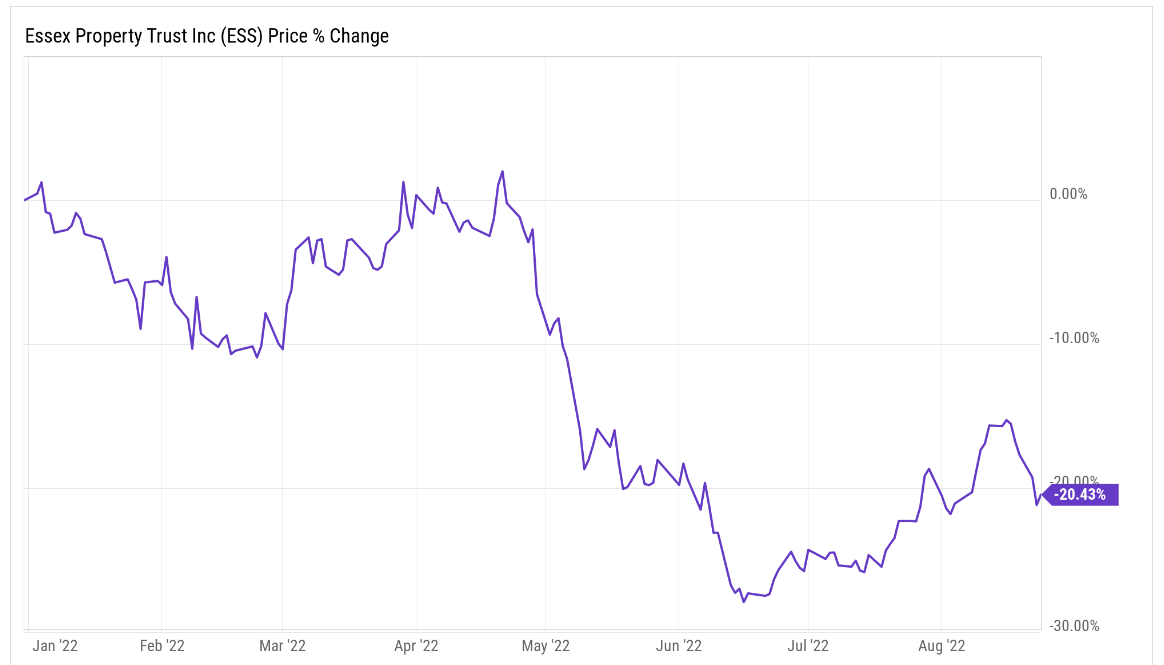
ESS is a company that has been around the block having been founded in 1971 and going public in 1994. The company also proudly holds the title of a Dividend Aristocrat, having increased their dividend for more than 25 consecutive years and counting.
Unlike the other blue chip multifamily REITs that we have looked at today, ESS management has focused primarily on building a presence on the West-Coast, with its properties spanning from Southern California up to Seattle.
Investors could look at this one of two ways.
- Having such a small focus could increase the portfolio risk if something were to negatively impact that region
- Focusing on supply constraint areas like ESS does and doing so in a historically strong market, allows for growth opportunity from a premier landlord
Here is a closer look at the ESS portfolio.
ESS Q2 Investor Presentation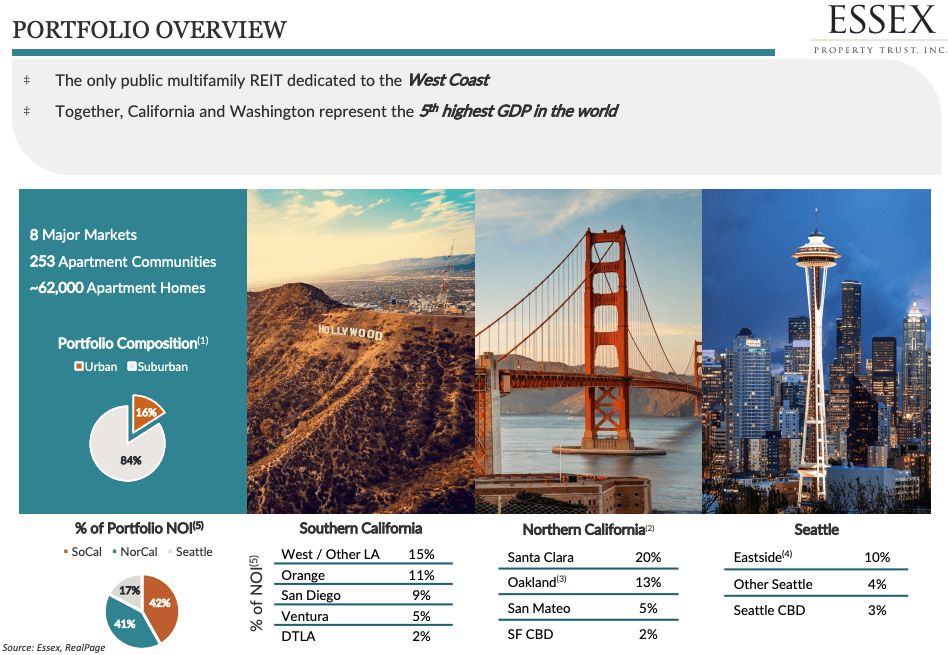
As you can see on the slide, ESS happens to be the only public REIT dedicated solely to the West Coast. As I mentioned above, the region has historically performed quite well and both California and Washington represent the 5th highest GDP in the world.
Having focused on this primary region has paid huge dividends (no pun intended) for the company over the years. Northern California has transformed into the capital of technology companies, which has greatly benefited ESS properties in that area.
On the flip side, California is not by any means a “business-friendly” state, which is why we have seen some large corporate exits in recent years, think Tesla (TSLA). However, the property locations in low-supply areas combined with having superb property locations near the technology hubs, has far outweighed the negatives from a state perspective.
ESS Q2 Investor Presentation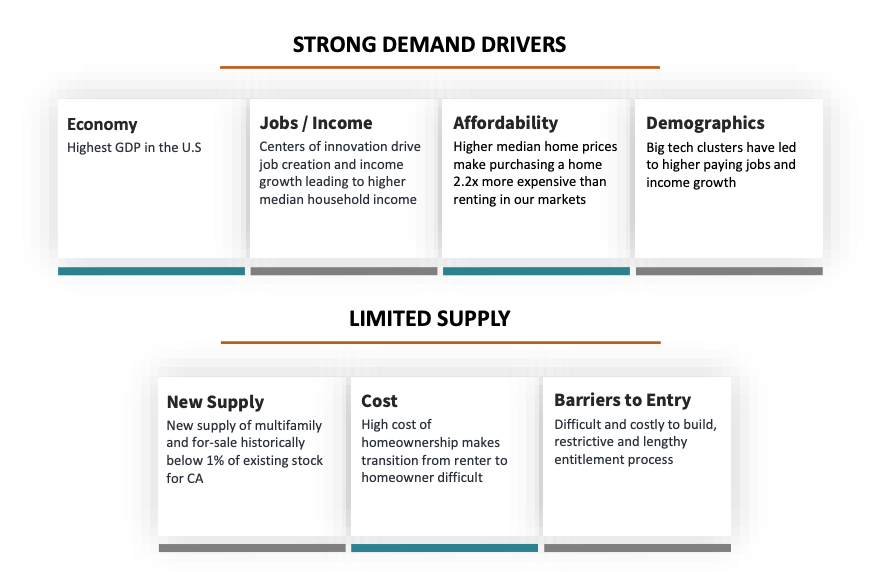
Since going public in ‘94, the company has been a very shareholder friendly company. Looking at the chart below, you can see how ESS has easily outpaced the performance from the S&P 500, the Equity REIT sector, and the REIT sector as a whole. In addition, they have done so by continuously increasing their dividend for 27 consecutive years and counting.
ESS Q2 Investor Presentation
During the company’s second quarter, ESS saw same-store revenues climb 12.7% over prior year with NOI climbing 16.7% during the quarter. In addition, management repurchased $60.8 million worth of ESS shares during the quarter.
Management noted in their Q2 press release how the technology companies putting out return to work mandates have and will continue to be a short-term catalyst for the company.
ESS currently pays an annual dividend of $8.80, which equates to a dividend yield of 3.1%. The dividend is backed by a BBB+ rated balance sheet and a very low payout ratio of 61%.
In terms of valuation, shares of ESS currently exchange hands at a forward P/AFFO multiple of 19.9x making it the cheapest of the three apartment REITs we have looked at today. Over the past five years, shares of ESS have traded closer to an average AFFO multiple of 22.6x.
FAST Graphs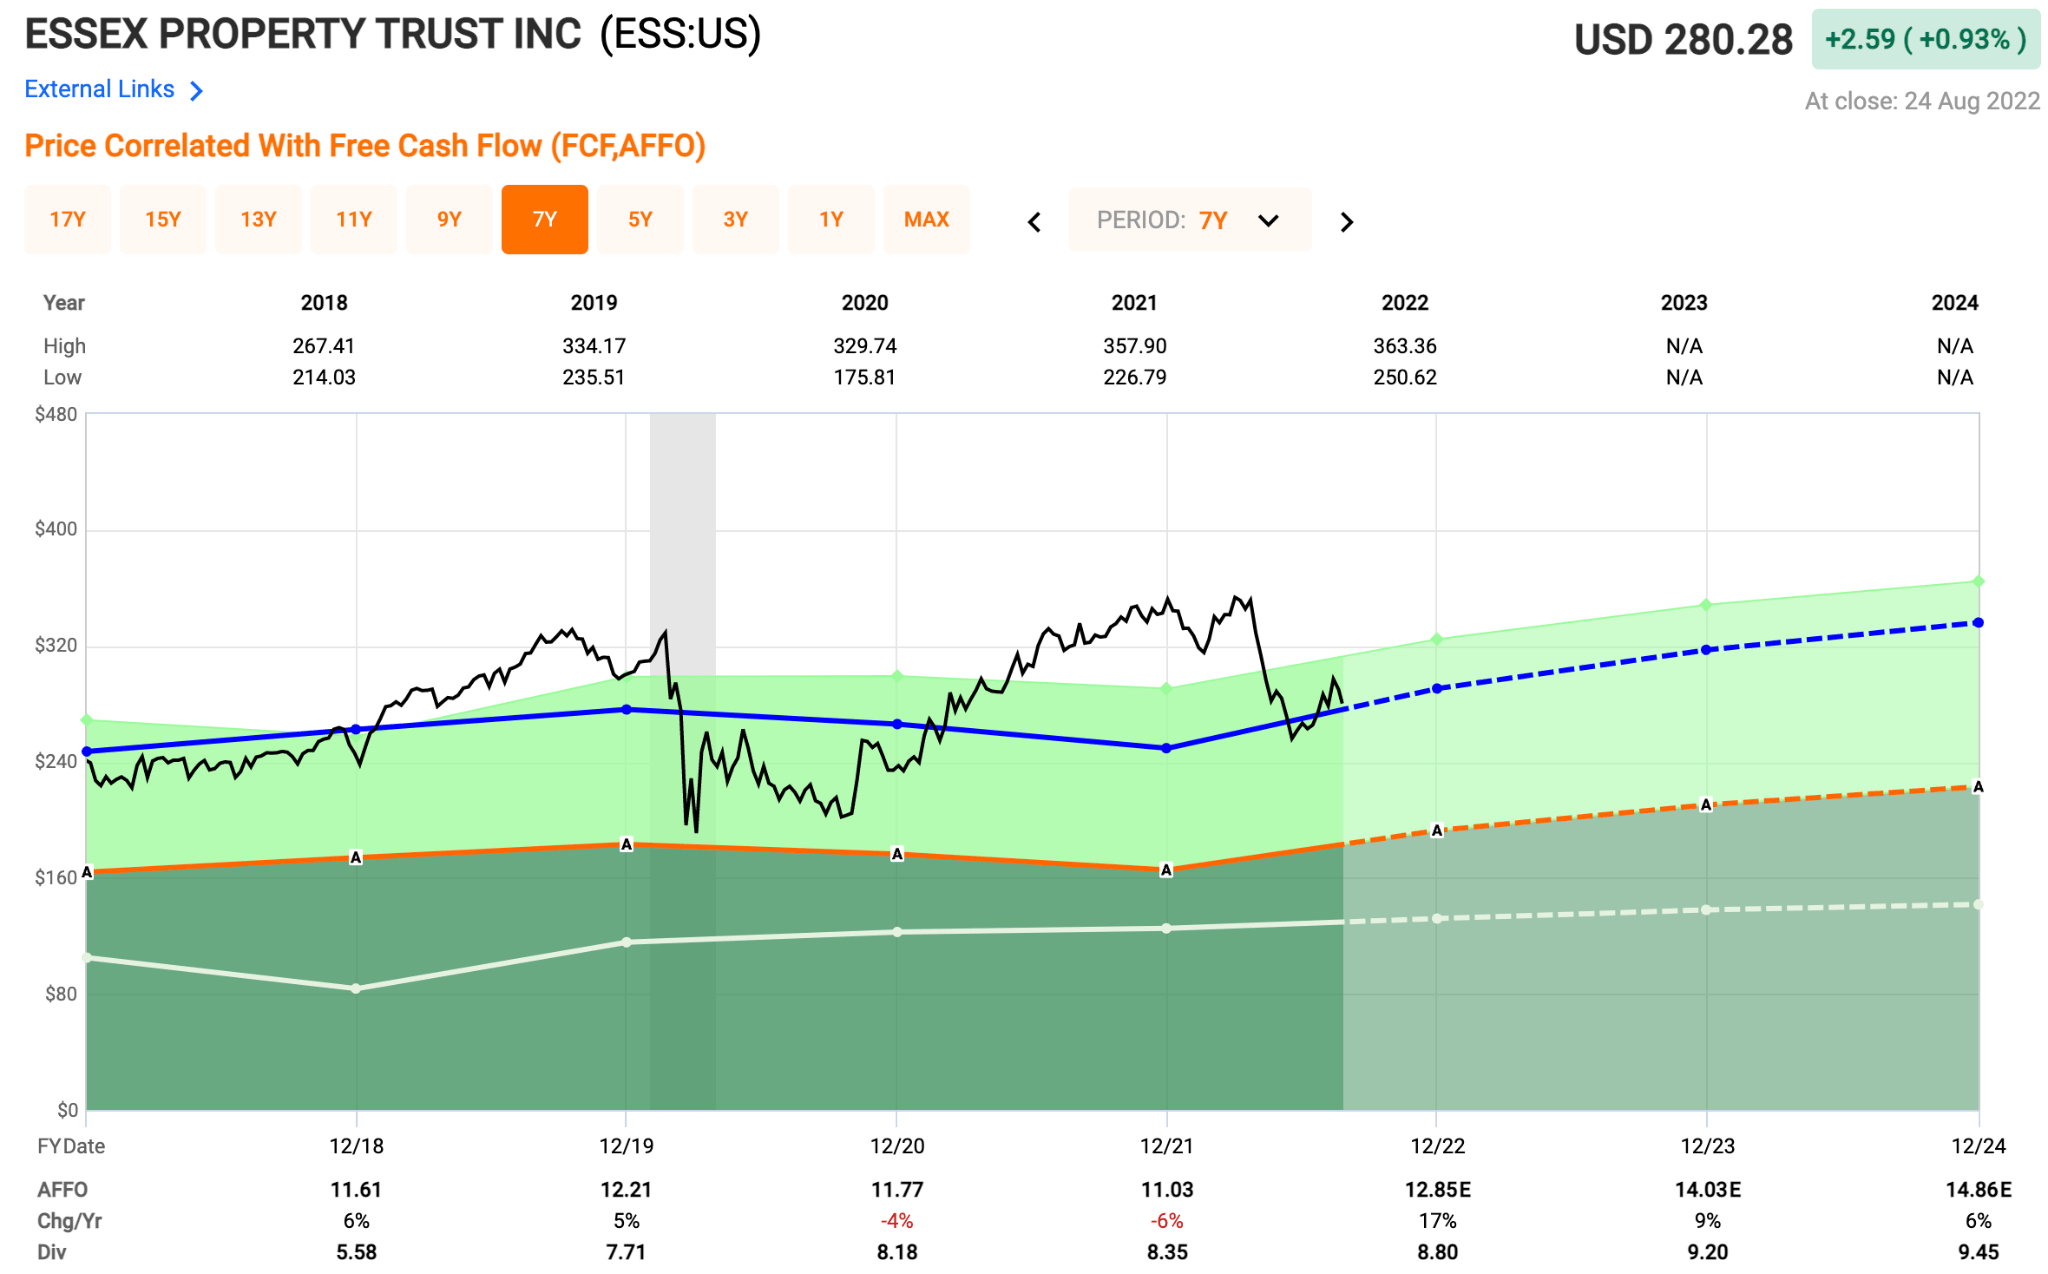
ESS has a premium portfolio located in a premium location deserving of a premium valuation. Amongst the three apartment REITs we have looked at today, ESS is the most intriguing in terms of current price. All three should be names on your watchlist and if they were to fall any further, could start turning into long-term bargains.
In Closing…
I hope that you enjoyed the first installment of The Landlord’s Game and I look forward to going through most every property sector.
iREIT
I look forward to your feedback and as always, thank you for the opportunity to be of service.
Be the first to comment