

marchmeena29
Written by Nick Ackerman, co-produced by Stanford Chemist. This article was originally published to members of the CEF/ETF Income Laboratory on September 14th, 2022.
Special Opportunities Fund (NYSE:SPE) provides investors exposure to all of the Bulldog activist activities. They invest in a significant sleeve of other investment companies; this includes other traditional closed-end funds but also business development companies. They also have a fairly large sleeve of special purpose acquisition corporations or SPACs. These have some unique characteristics.
SPACs were a hot thing back in 2020, but they have since fizzled dramatically. That doesn’t mean there isn’t any opportunity in them, but there are so many, and they just don’t quite get as much attention as they had before.
Speaking of SPACs, SPE has announced they have filed a class action lawsuit against one of the underlying positions. This is a significant development since the last time we took a look at this fund.
At the end of the day, the FAST Acquisition Corp. (FST) isn’t a massive position for SPE. They held 32,087 shares that were valued at around $3.209 million at the end of June 30th, 2022. It does show the benefits of having such an activist on your side. In this case, if you are an SPE shareholder, the Bulldog management is working in your best interest.
FST was going to combine with Fertitta Entertainment Inc. Fertitta terminated the deal and agreed to pay a breakup fee to FAST of up to $33 million. That included $26 million if FAST wasn’t able to find a business combination by August 25th, 2022. That date had passed, and there was no deal. Now FAST needs to liquidate as SPACs do and return the cash back to shareholders. However, the management team here is attempting to keep the breakup fee for themselves and only distribute all the other net assets.
Here is from Phillip Goldstein, SPE’s chairman and the managing partner of Bulldog Investors.
We have seen some brazen selfserving schemes by public company insiders over the years, but the attempt by a SPAC sponsor, after failing to achieve a business combination, to grab a parting gift for itself and management at the expense of the SPAC’s public stockholders, as it intends to do here, represents a new low in corporate governance.
Since that press release, they’ve now come to an agreement that there will be no liquidating distributions unless required (taxes and other fees) until the lawsuit concludes.
The Basics
- 1-Year Z-score: -1.19
- Discount: 12.35%
- Distribution Yield: 11.73%
- Expense Ratio: 1.81%
- Leverage: 26.5%
- Managed Assets: $220.23 million
- Structure: Perpetual
SPE “employs an opportunistic investment philosophy with a particular emphasis on investing in discounted closed-end funds, undervalued operating companies, and other attractive special situations including risk arbitrage and distressed securities.”
The fund is fairly small; it would be even smaller if it wasn’t for the $58.4 million in preferred stock that it had outstanding. The fund’s preferred stock is a convertible preferred with a dividend rate of 2.75% (SPE.PC).
With interest rates rising, their leverage expenses won’t be hit as we see in other variable-rate leveraged funds. While it is a higher rate initially, leverage expenses based on LIBOR or other floating rates are rapidly rising to this fixed level. At the same time, they have significant exposure to other funds that will be impacted by these higher costs. So the leverage for SPE isn’t going to be directly impacted, but the fund will be indirectly impacted due to the underlying holdings.
The fund’s expense ratio is high, especially considering that the underlying investment company holdings will have their own expenses too. BDCs can have expenses as high as 5 to 10%+. This would be an expense ratio on top of those elevated amounts. It requires a lot of things to go right for the fund to be successful.
SPE Performance – Attractive Discount
The fund provides a weekly report on the NAV. Therefore, we fly a bit blind in terms of the discount or performance of the underlying portfolio for most of the week. The NAV last reported was $14.12. Given the share price of $12.78 at the time of writing, we would be given a discount of nearly 9.5%.
SPE NAV (Bulldog Investors)
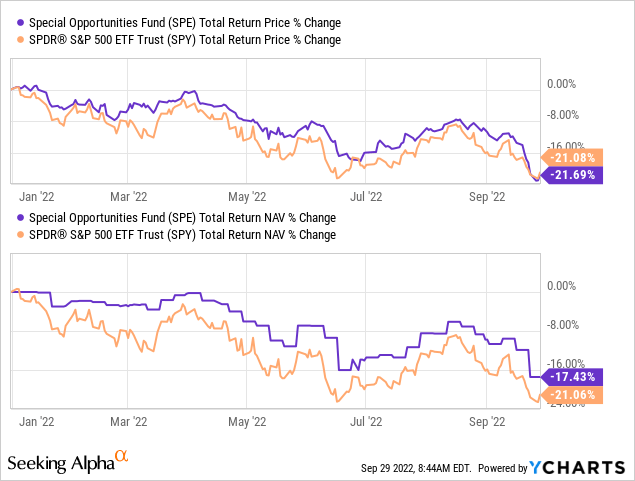
However, that was prior to the sharp drop in the overall market for what would likely have a negative impact on the fund itself. For the most part, SPE has been holding up better than the SPDR S&P 500 (SPY). That would likely mean that the drop we saw in the overall market lately hadn’t impacted SPE as much. SPY isn’t a benchmark for the fund, but it can provide us with some context on how the fund could have been performing.
Over time, the fund had averaged an even deeper discount. However, that was primarily before the more consistent distribution that they put into place. When things change, discount ranges can change.
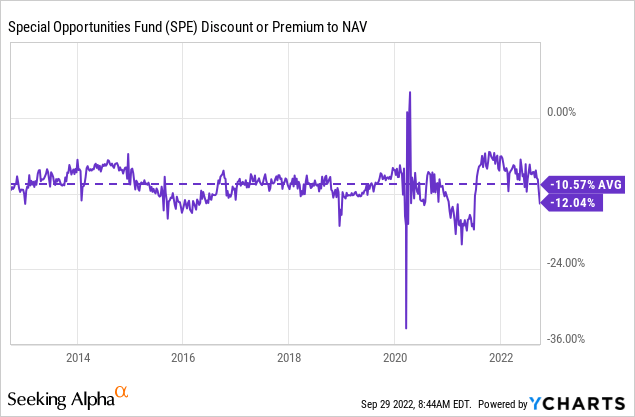
SPE holding up better could be a result of the fund’s high SPAC exposure. While SPAC prices crash once they find a merger, until then, they are generally tied to their NAV. This tends to happen more closely than what we see in CEFs, presumably because they are essentially holding cash or short-term U.S. Treasuries that offer significant safety.
Distribution – Managed 8% Plan
SPE takes its hybrid allocation of portfolio holdings and turns them all into monthly payers. SPACs don’t have distributions (until liquidation, if it comes to that.) Some of the underlying CEFs payout variable semi-annual distributions. However, with SPE, you get a monthly distribution that is set annually at an 8% NAV.
They have been running the fund this way for the last few years. Prior to this, the fund paid a variable distribution annually. As a reminder, prior to 2009, this fund was the Insured Municipal Income Fund.
SPE Distribution History (CEFConnect)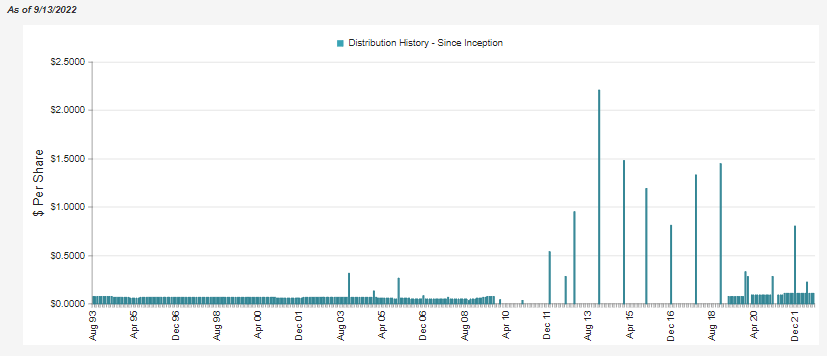
The last few years provided some strong returns, helping to support such a distribution. At this time, they even bumped the managed distribution up from 7% to 8%. That resulted in another increase for this period.
However, the fund is struggling along with the rest of the market now. The next adjustment is likely to result in a lower distribution. If we use the latest NAV as an example, the monthly distribution would be reduced to around $0.094 per month from the $0.11 at this time. Not necessarily a massive decrease, and it is something that we can watch through the remainder of the year.
The net investment income the fund generates isn’t enough to cover the distributions to shareholders. Although, it was a sharp increase from the previous fiscal year.
SPE Semi-Annual Report (Bulldog Investors)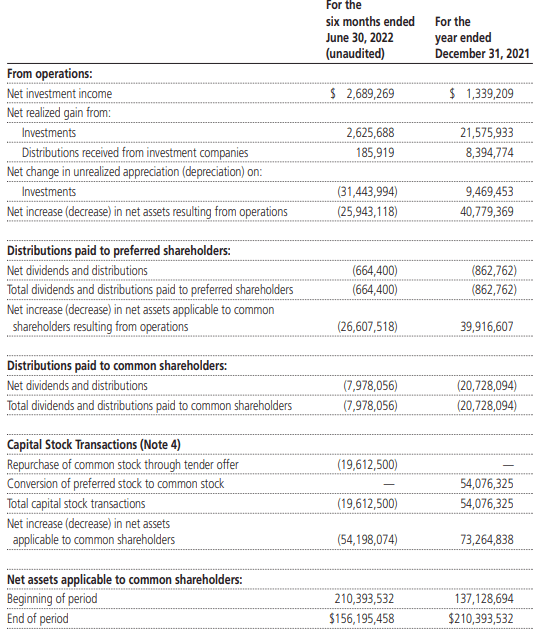
We can’t forget the preferred dividends, though. That means that after those dividends are paid, there is an even smaller pool for the common shareholders. That isn’t necessarily a bad thing if they can operate the portfolio successfully. However, in a bear market, it will become increasingly difficult to provide sufficient gains.
SPE’s Portfolio
At the end of June 2022, the portfolio was mostly invested in investment companies. The second-largest exposure was to SPACs. Over 97% of the portfolio was invested in U.S. companies, so there is no significant global exposure here.
SPE Investment Breakdown (Bulldog Investors)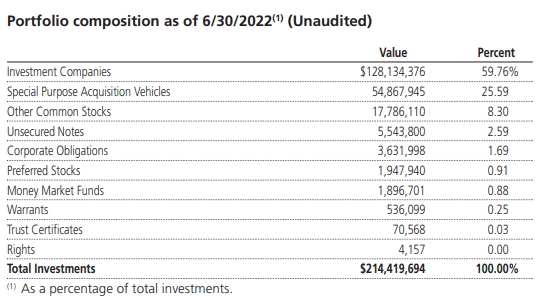
Within the investment company exposure, around 69.5% is invested in traditional publicly traded CEFs. BDCs make up around 12.61% of the exposure. The fund’s portfolio turnover came to 27%. However, most of the largest positions are rather consistent.
General American Investors (GAM) continues as the largest holding, that is followed by SRH Total Return Fund (STEW). STEW was the old Boulder Growth & Income Fund under ticker BIF. STEW still holds significant exposure to Berkshire (BRK.A) and (BRK.B).
The STEW top ten holdings are shown below to highlight the significant weighting to Berkshire.
STEW Top Ten (SRH Fact Sheet)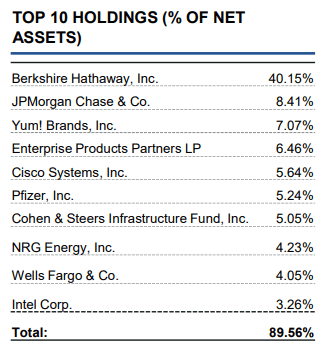
Central Securities Corp. (CET) is the third-largest position in the fund, which was a slight change as it was the second-largest holding previously. They held 209,383 shares previously and still held the same number in the latest report. For STEW, it was the same as they held 909,987 at the end of March and now at the end of June.
However, from the end of the year to the end of June, they increased their holding of STEW from 846,913 shares. For CET, they decreased the number of shares from 278,407 shares. STEW performing better during that period has also contributed to this slight shift.
YCharts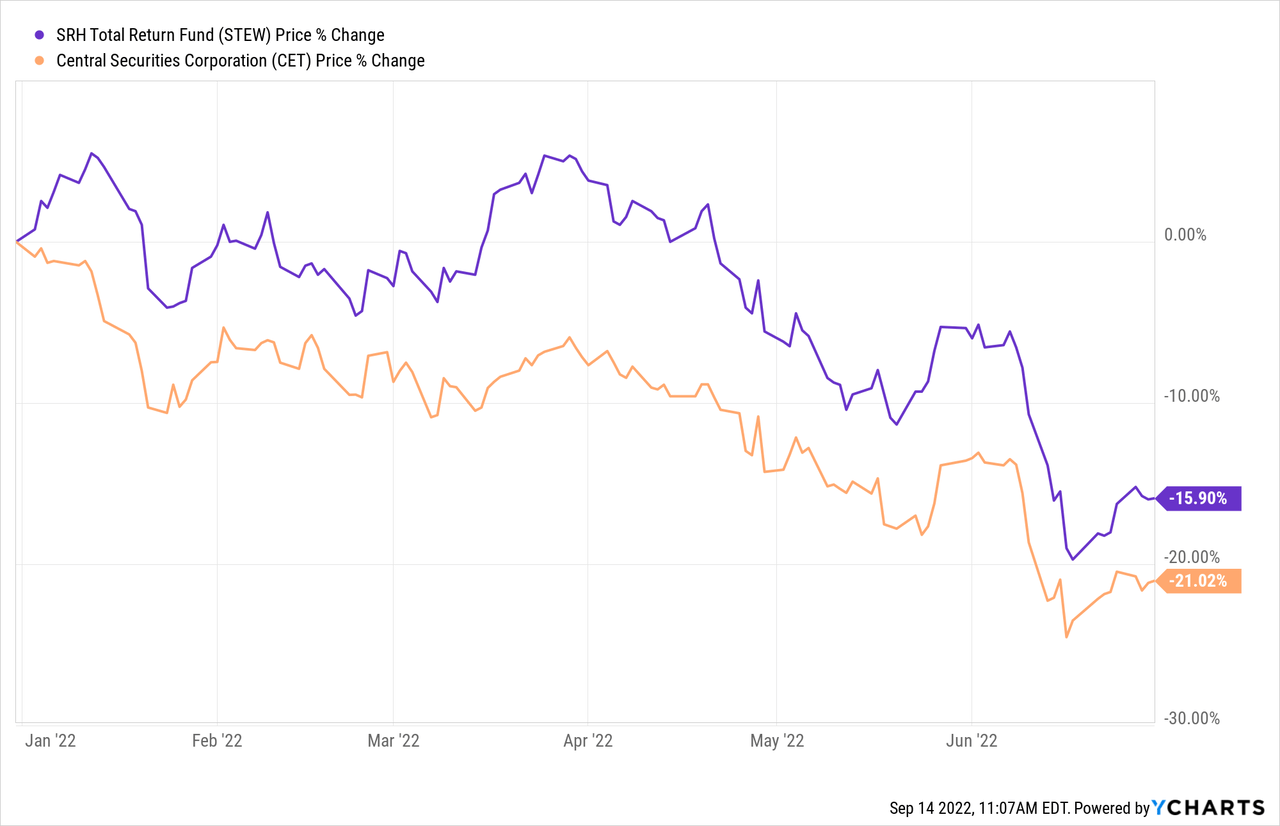
Conclusion
SPE remains an interesting name with an attractive discount. The fund also holds other investments that are attractively discounted. That provides a bit of a discount on discount. However, the fund only reports its NAV weekly, so there can be some discrepancies. Additionally, discount on discount is nice, but it also means fees on fees. The fund itself is leveraged, and the underlying holdings are leveraged, adding more volatility. Overall, I view SPE quite favorably at these larger discounted levels.
The latest development of the lawsuit against FST likely won’t result in some massive NAV bump. However, it is a good reminder of why having some activist exposure is beneficial.
Be the first to comment