

bymuratdeniz
The SPDR S&P North American Natural Resources ETF (NYSEARCA:NANR) provides exposure to mid- to large-cap natural resource companies in the U.S. and Canada. Natural resource equities have been winners in the past few years, as the world struggled with supply constraints and resumption of demand. However, looking forward, there are storm clouds brewing with many predicting a global recession in 2023. For now, I remain bullish on NANR, as it looks to be consolidating after a large move. However, I would be more concerned if the price starts to break support ~$52.
Fund Overview
The SPDR S&P North American Natural Resources ETF provides exposure to U.S. and Canadian large and mid cap companies that operate in the natural resource and commodities industries. It has almost $600 million in assets.
Strategy
The NANR ETF tracks the S&P BMI North American Natural Resources Index (“Index”). The index comprises publicly traded large-and mid-cap U.S. and Canadian companies in energy, metals & mining, and agriculture industries. To qualify for the index, each company must have float-adjusted market capitalization of $1 billion and average daily traded value of $5 million. The energy industry includes the following GICS sub-industries: coal & consumable fuels, integrated oil & gas, oil & gas drilling, oil & gas exploration & production, oil & gas refining & marketing, and oil & gas equipment & services. The metals & mining industry includes the following sub-industries: aluminum, diversified metals & mining, steel, copper, gold, precious metals & minerals, and silver. The agriculture industry includes the following sub-industries: agricultural products, fertilizers & agricultural chemicals, forest products, paper packaging, paper products and Timber real estate investment trusts.
At each quarterly rebalancing, the overall weights of the energy, metals & mining, and agricultural industries are reset at 45%, 35%, and 20% respectively.
Portfolio Holdings
As of November 18, 2022, the NANR ETF has 35 holdings with the sector weights shown in Figure 1.
Figure 1 – NANR ETF sector breakdown (ssga.com)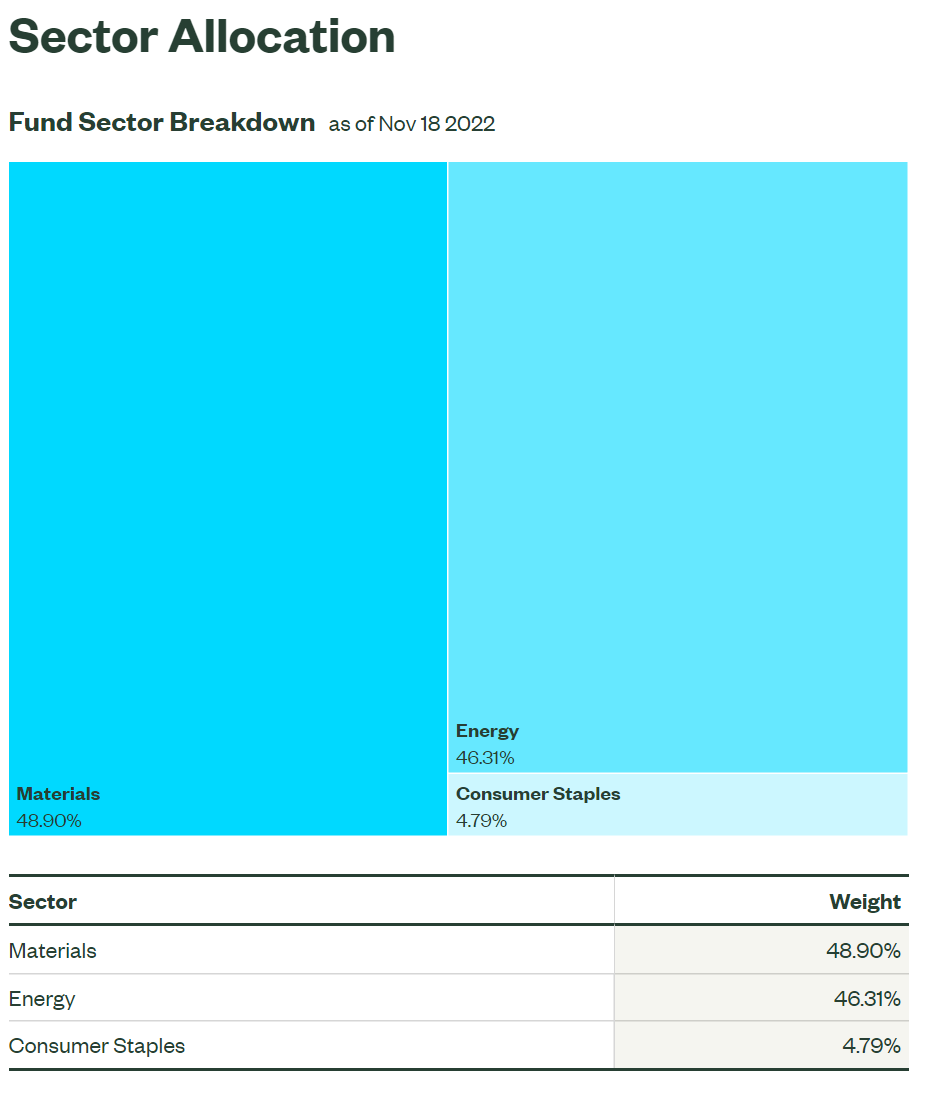
The fund’s top 10 holdings are shown in Figure 2 and account for 59.0% of the fund.
Figure 2 – NANR ETF top 10 holdings (ssga.com)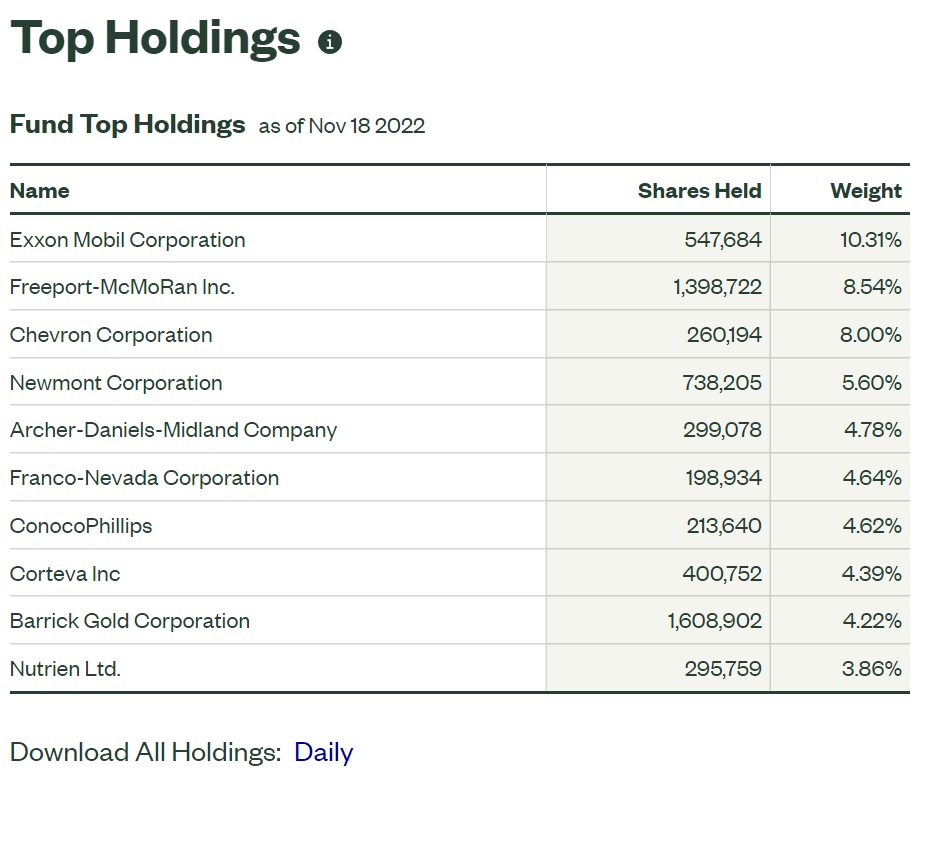
Returns
The NANR has had very strong near term returns with YTD, 1Yr and 3Yr average annual returns of 25.0%, 27.3%, and 23.6% respectively, measured to October 31, 2022 (Figure 3).
Figure 3 – NANR ETF returns (ssga.com)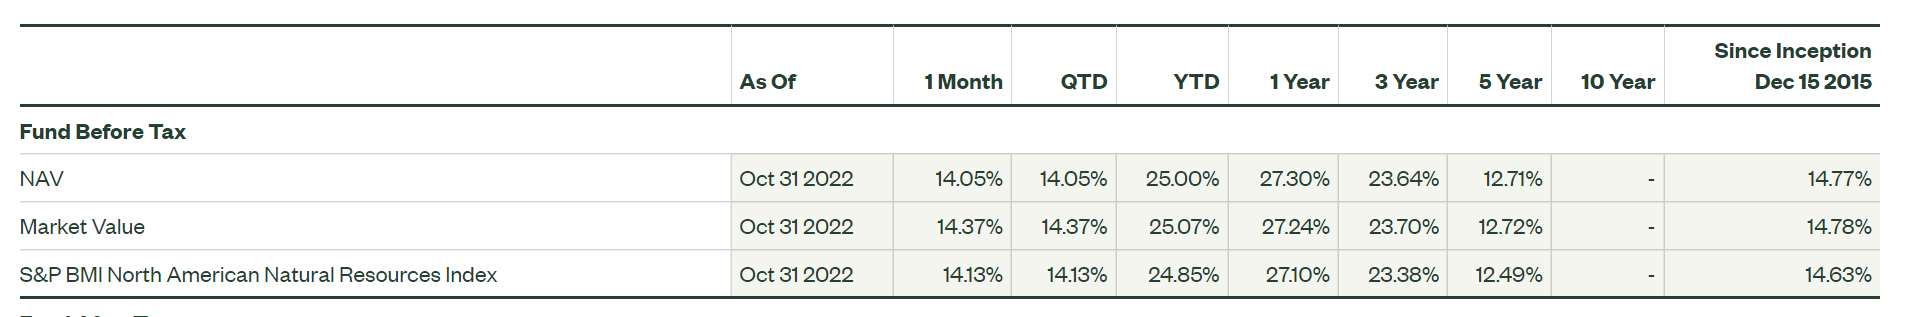
Distribution & Yield
The NANR ETF pays a modest distribution yield of 2.2% in the trailing twelve months (Figure 4). NANR’s distribution is paid semi-annually and is variable.
Figure 4 – NANR ETF distribution (Seeking Alpha)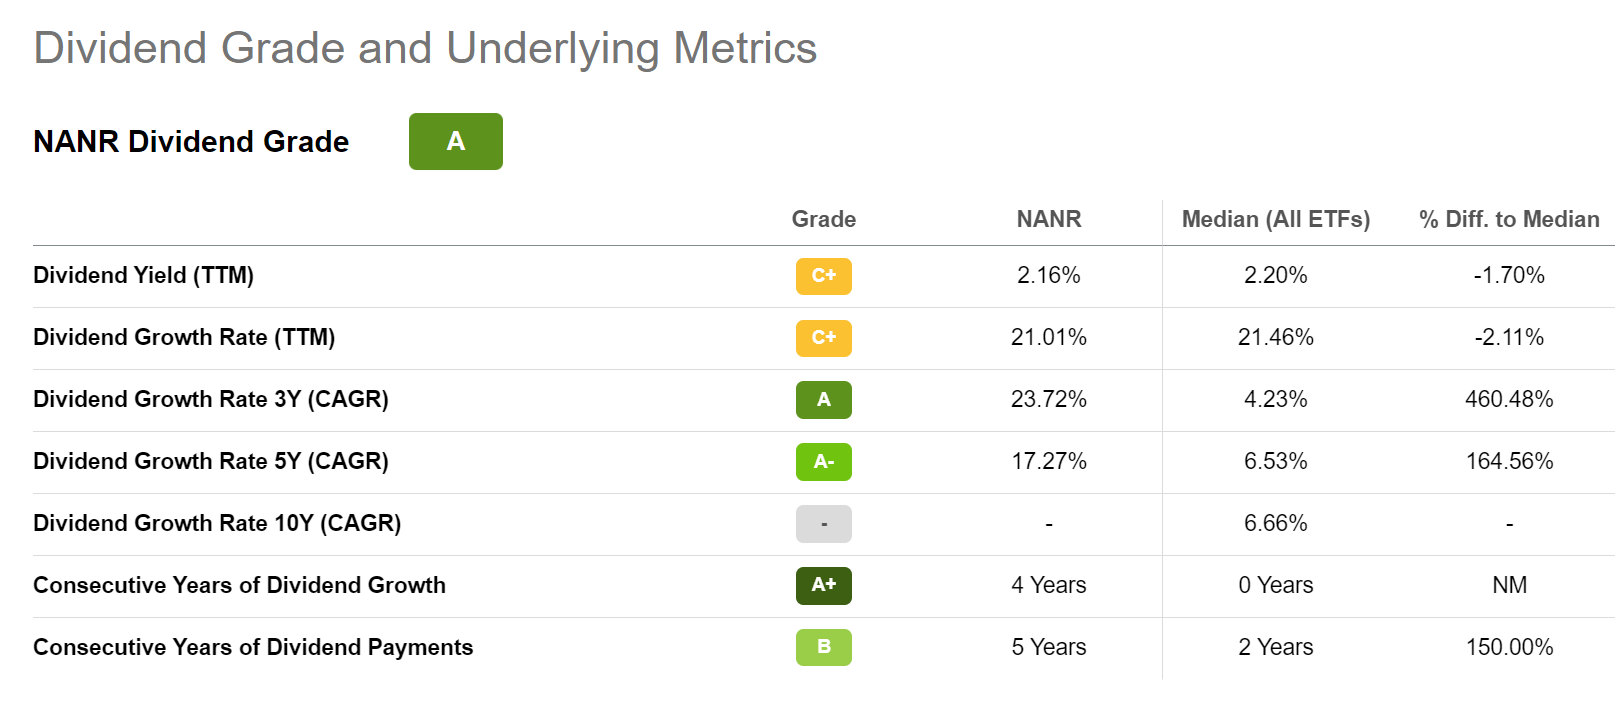
Fees
The fund charges a 0.35% gross expense ratio.
Boom/Bust Returns
Looking at returns on an annual basis, we can see that the NANR’s returns have a distinctively ‘boom / bust’ profile (Figure 5).
Figure 5 – NANR ETF annual returns (morningstar.com)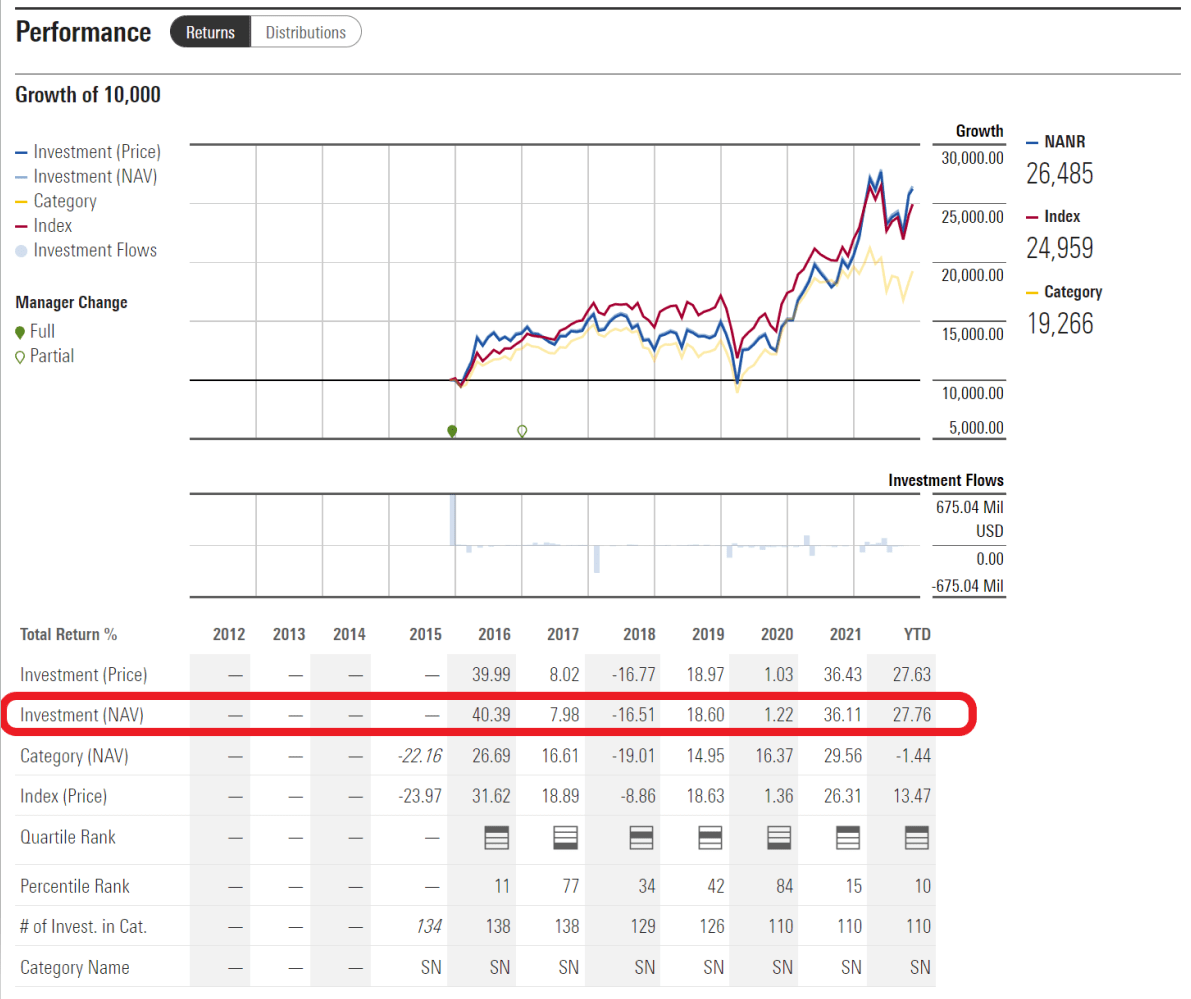
For example, in 2016, the NANR ETF generated outstanding returns of 40.4%, significantly ahead of the market as represented by the SPDR S&P 500 ETF Trust’s (SPY) 11.8% return (Figure 6). This outperformance was driven by Chinese stimulus and OPEC production cuts that buoyed commodity prices.
Figure 6 – SPY ETF annual returns (morningstar.com)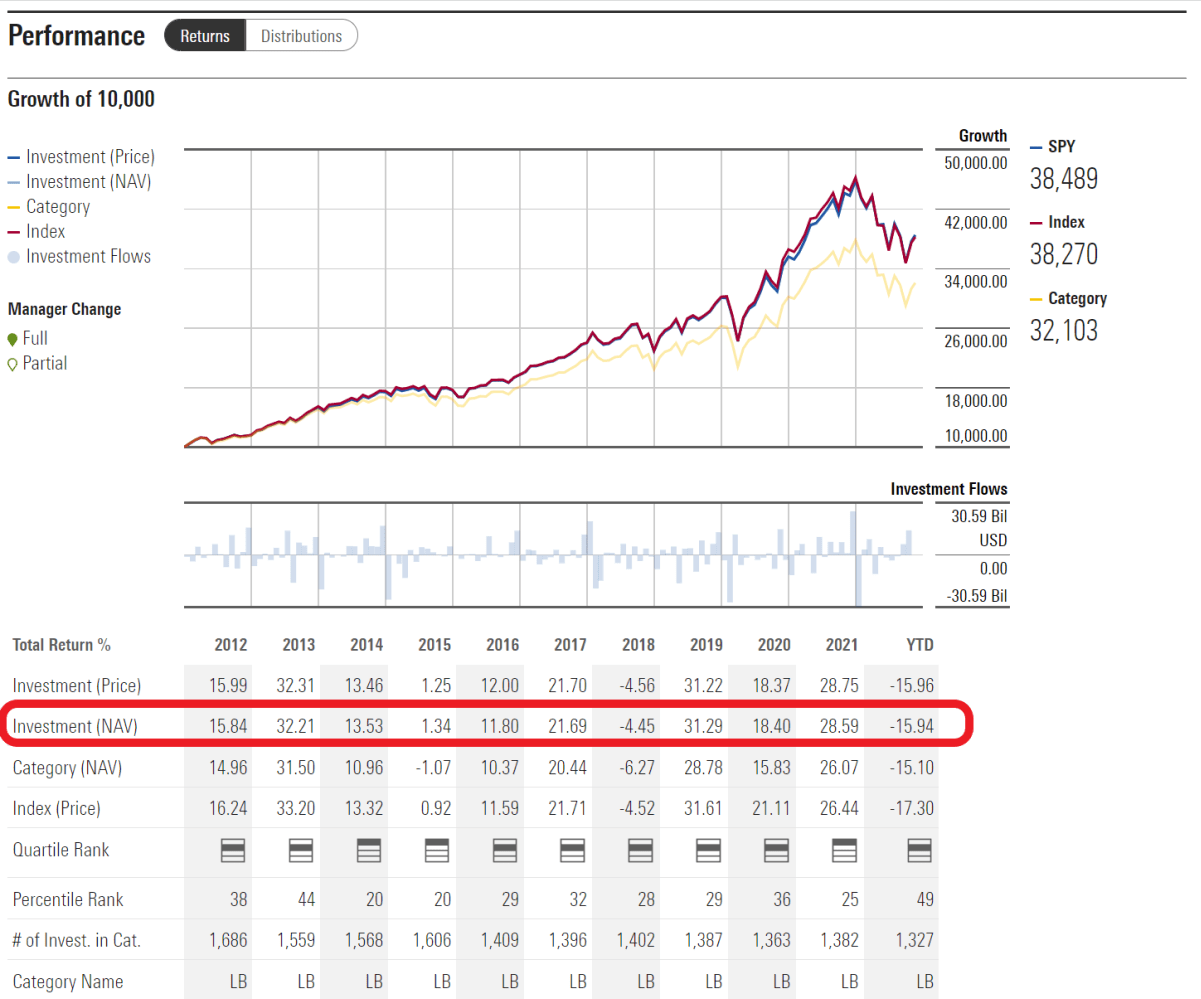
On the other hand, 2018’s -16.5% return significantly underperformed SPY’s -4.5%, as oil supplies were plentiful (U.S. shale production was growing rapidly) and President Trump began his trade war against China, crimping commodity demand.
This boom/bust behavior is due to the fact that resource companies are price-takers (despite the rhetoric from the current U.S. administration); their revenues and earnings are determined by the cyclical nature of the underlying commodity prices.
When demand is greater than supply, commodity prices rise and natural resource companies earn bonanza profits. However, when demand is less than supply, commodity prices fall and natural resource companies’ earnings fall, sometimes dramatically so like in the early days of the COVID-pandemic, when many North American energy companies were producing energy at negative margins.
Currently, we are in another boom phase, as the world faces an energy crisis, partly caused by the Russian invasion of Ukraine. This has supercharged energy equity returns. However, as we look forward, what is the outlook for commodity prices and natural resource equities?
When Will This Boom End?
On the positive side, with Russian oil sanctions set to go into place in the near-term, global energy markets remain in a supply/demand deficit supportive of energy prices. However, in recent days, oil prices have softened considerably to $80 on WTI Crude, not far above the levels in late September that prompted OPEC+ to cut oil production at its October meeting (Figure 7).
Figure 7 – WTI Crude has fallen to $80 / bbl despite OPEC cuts (Seeking Alpha)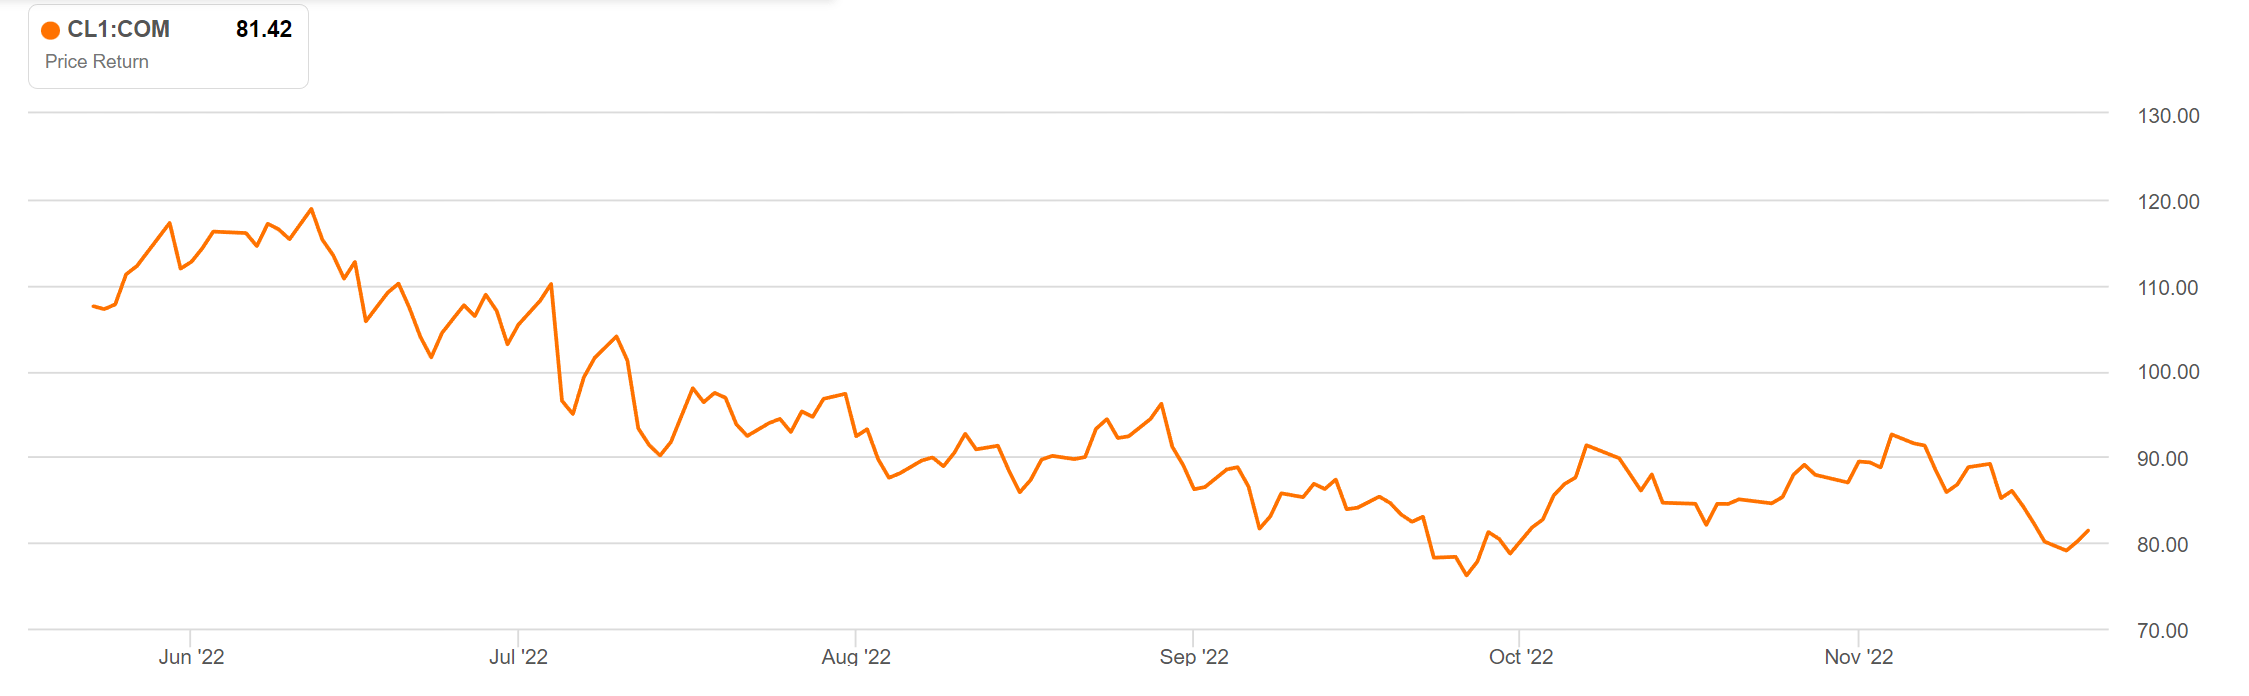
The reason is two-fold. First, we have seen a steep inversion of the 3M-10Yr treasury yield curve, which has historically been a good predictor of recessions (Figure 8). Fears of a global recession have prompted a fall in commodity prices, as demand tends to fall during recessions while supply is slow to react.
Figure 8 – 3M-10Yr yield curve inversion hints at recession (Axios)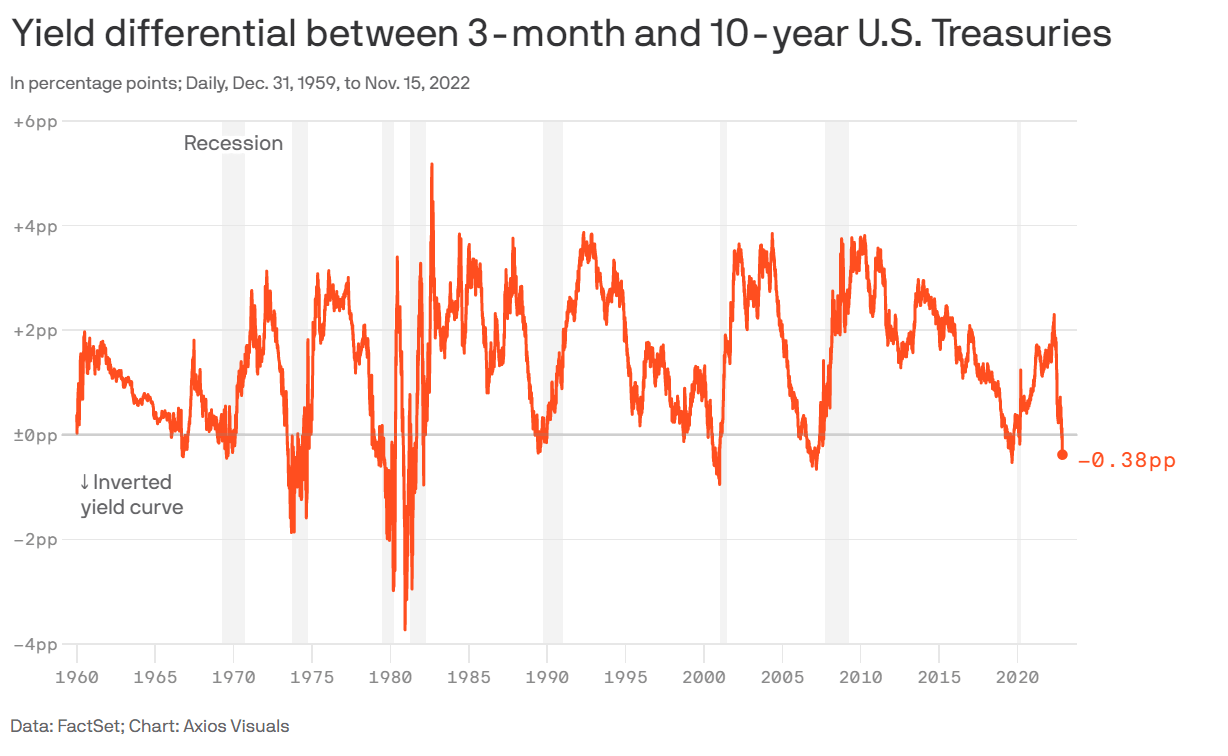
Furthermore, some of the recent enthusiasm built into commodity prices around a possible re-opening of China from draconian COVID restrictions seem to be waning, as Chinese COVID cases surge, prompting fresh lockdowns and restrictions (Figure 9).
Figure 9 – Chinese COVID cases surge (Our World In Numbers)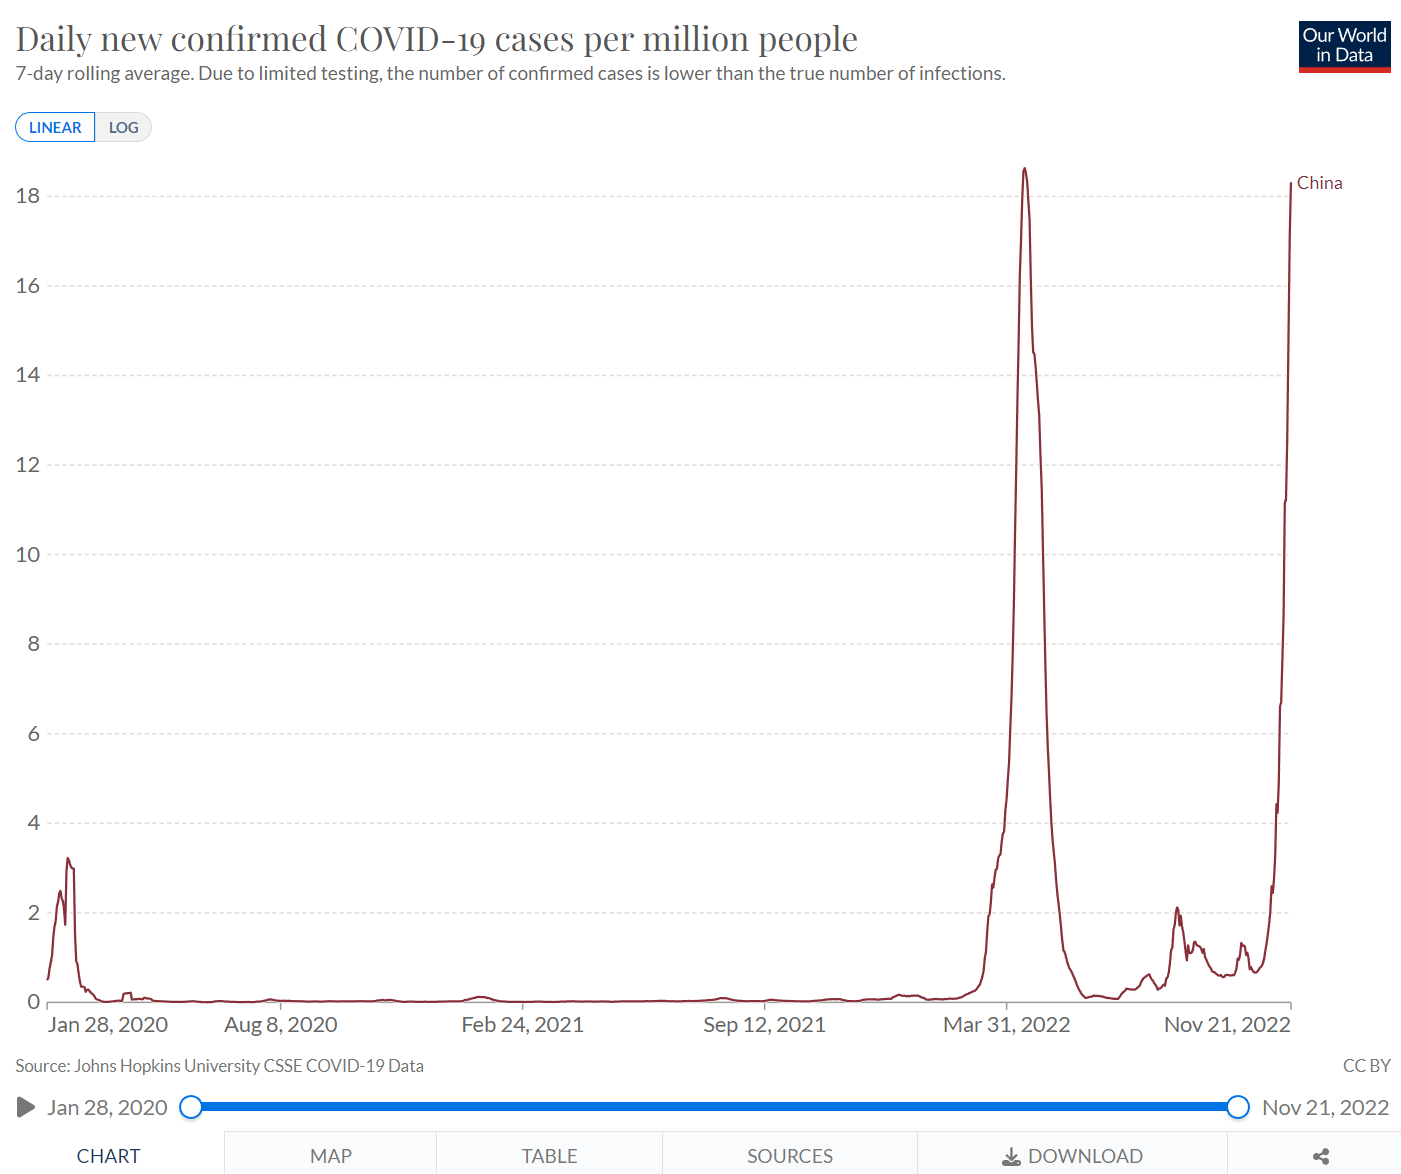
Remain Bullish For Now
For now, I remain bullish on the NANR ETF, as it appears to be simply consolidating after a strong move from October lows. However, it is notable that NANR’s price stopped at the declining downtrend connecting the April and June highs (Figure 10).
Figure 10 – NANR price shows consolidation (Author created with price chart from stockcharts.com)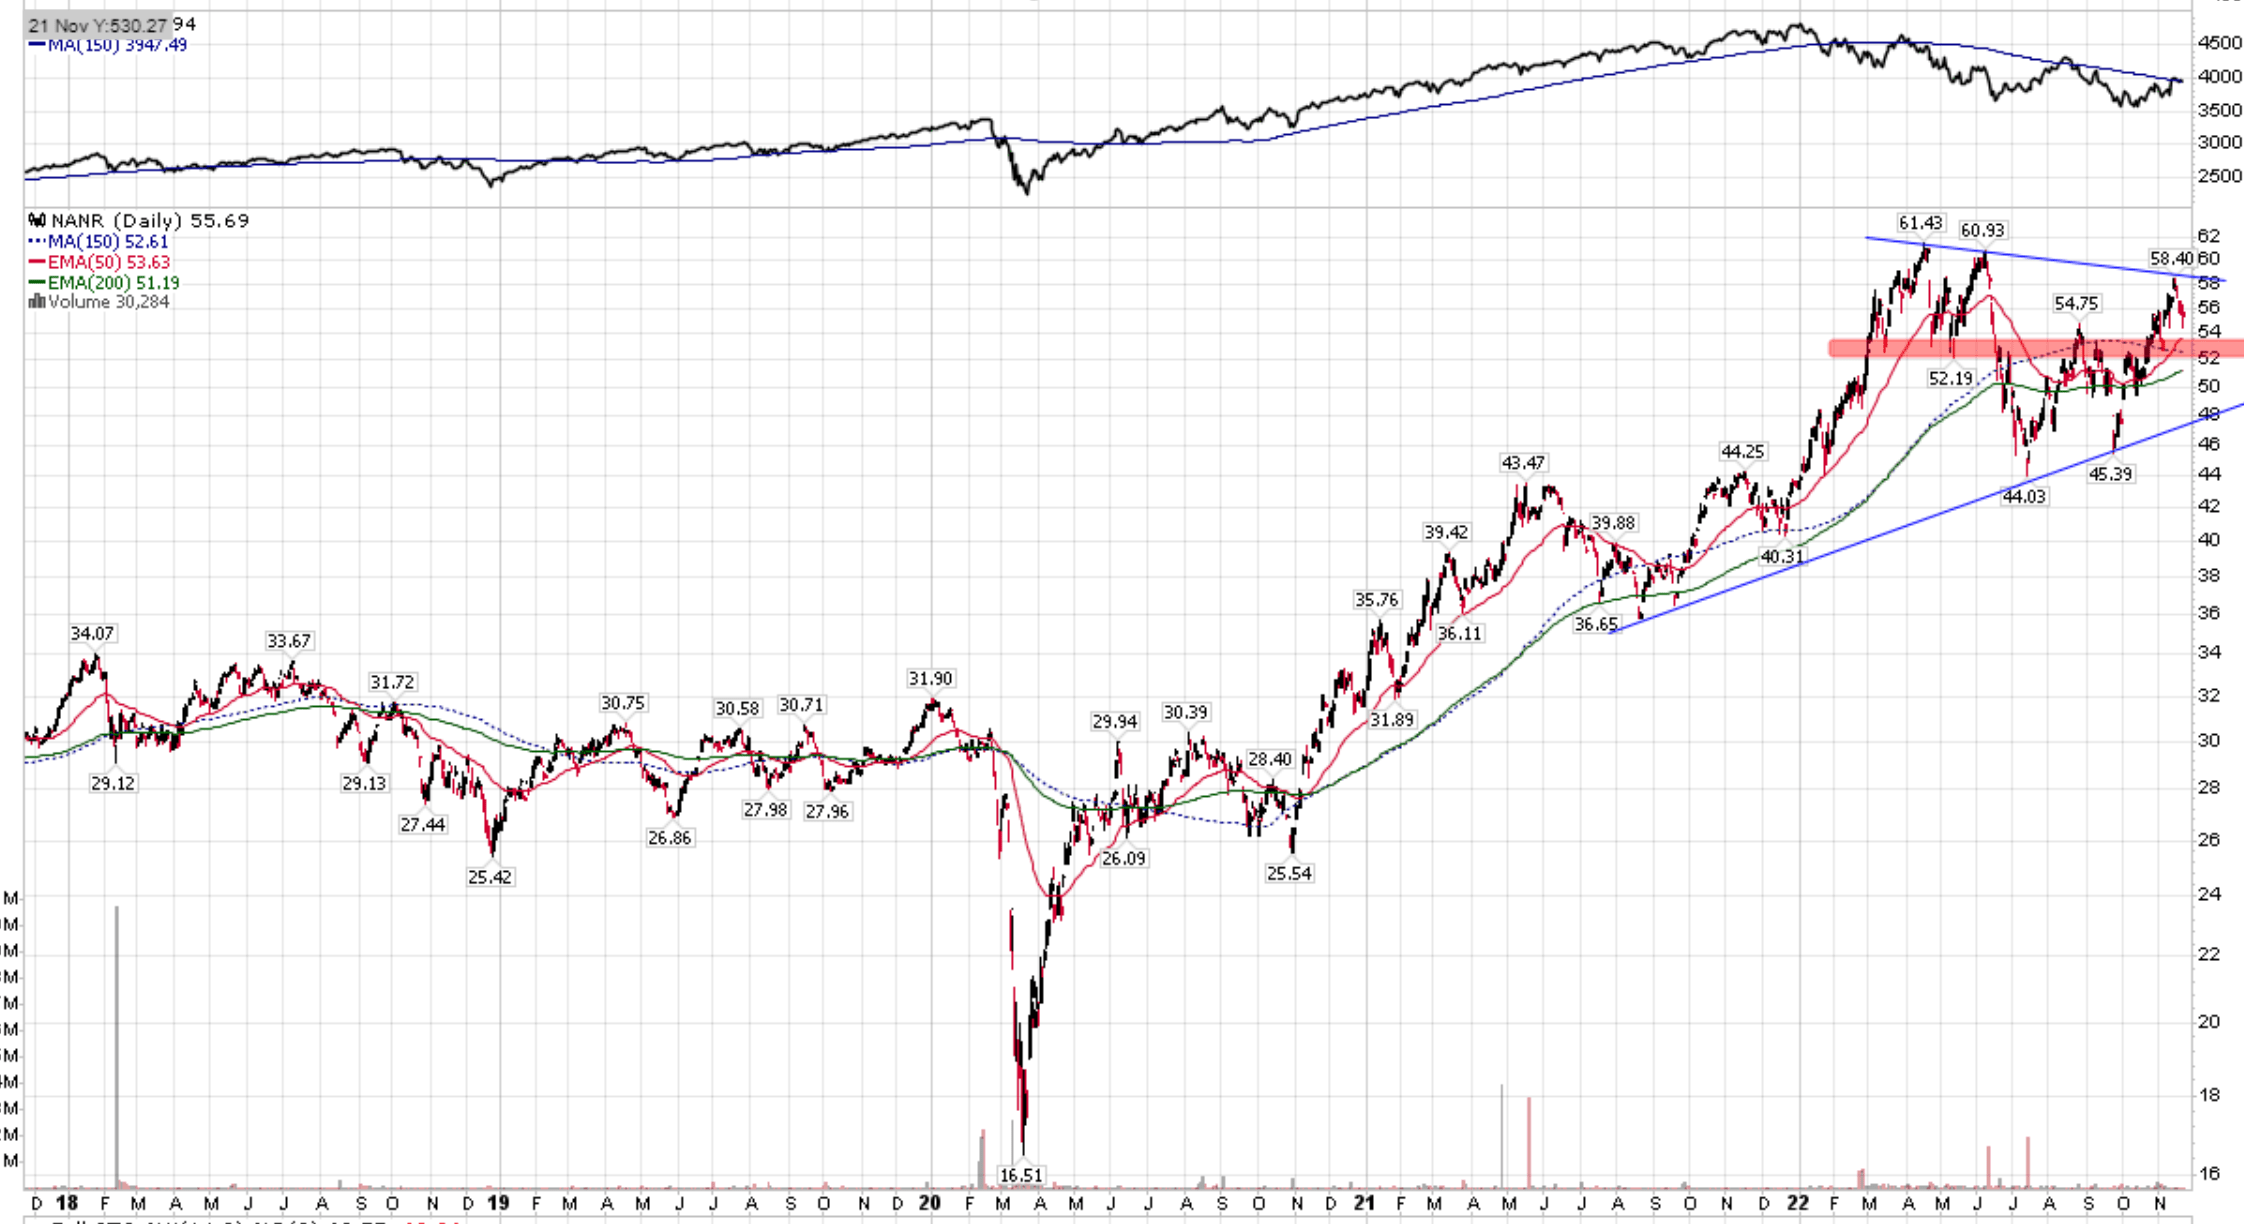
I would be more concerned if we break near-term support ~$52. Also, breaking the uptrend connecting the lows from last year and this year will confirm that NANR has entered a new bear phase.
Conclusion
The NANR ETF provides exposure to mid- to large-cap natural resource companies in the U.S. and Canada. Natural resource equities have been winners in the past few years, as the world struggled with supply constraints and resumption of demand. However, looking forward, there are storm clouds brewing with many predicting a global recession in 2023. For now, I remain bullish on NANR, as it looks to be consolidating after a large move. However, I would be more concerned if the price starts to break support ~$52.
Be the first to comment