

Henrik Sorensen/DigitalVision via Getty Images
Created by writer from C Trader
Late last weeks better than expected economic date coupled by a proposed gas tax holiday has seen the S&P500 snap out of its technical losing streak. With the first significant Three Wave pattern completing in a bullish structure, in this article we examine the technicalities of whether this latest S&P500 (NYSEARCA:SPY) bounce is a flash in a pan or something more significant in play.
Technically if wave three is to numerically copy wave one, the SPY is in a macro three wave pattern dye to land at 3380. So far the SPY has bottomed at 3638 where it has found buying past previously rejected prices on the daily chart. I will be looking to the weekly chart to see if the SPY can continue its newfound form and create a three wave pattern to follow on from its little brother which would add credence to the fact that this latest move is not merely the forming of a bearish rejection heading south. Firstly we will look at the macro structure and examine where this large third wave is currently at.
You start taking notice of a possible turn around in a financial market really when a daily three wave pattern has completed. As we are going to examine the monthly structure now, three wave patterns will go as follows, everything up to and first the daily, then the weekly and lastly following by the monthly. At the moment, the SPY is in a monthly three wave pattern to 3380 if it is to complete its target. We have had our first timeframe complete its third wave going against the macro downwards third wave by way of the daily timeframe.
Below in the chart we can see the SPY topping out at 4825 dropping to 4102 to form the macro wave one. A move upwards to 4639 from that region forming the wave two, all confirmed by the break of 4102 which commenced the third wave on the monthly timeframe. We can see a bottoming so far at 3638 with a target of 3380 in this structure.
SPY monthly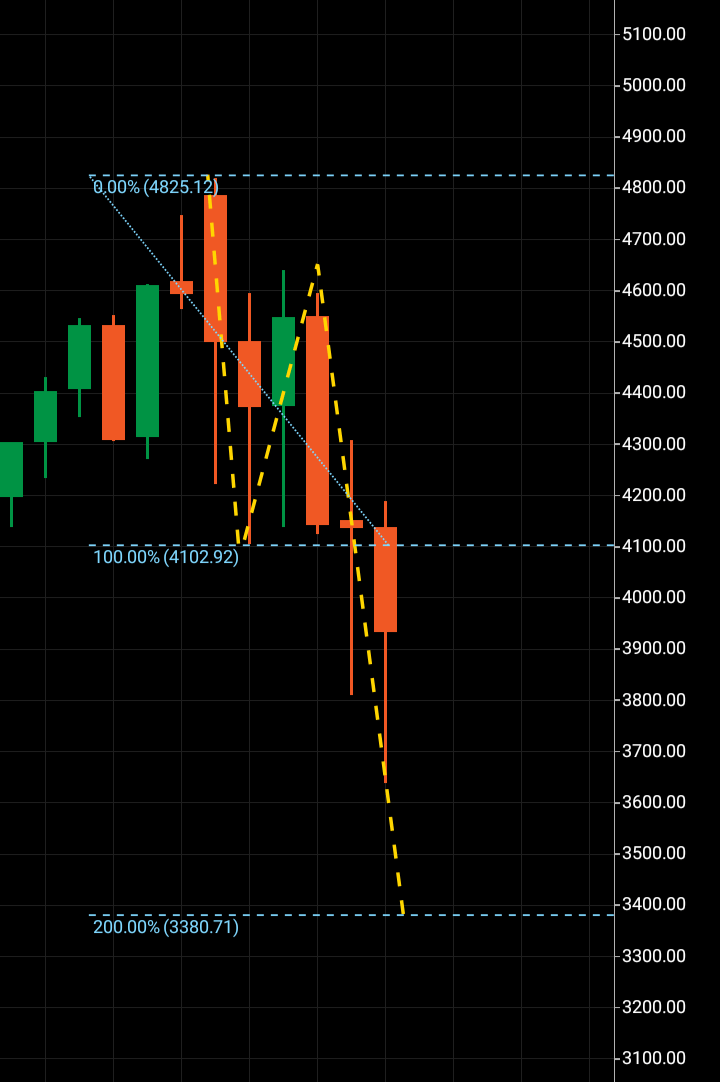
Now we will look at the aforementioned daily three wave pattern that has just completed that is technically going against the completion of the macro third wave should it climb through the timeframes.
SPY Daily
After bottoming at 3638 there was an internal higher high which led to a technical bottom for this daily three wave pattern at 3661 with the wave one high at 3805. The wave two was extremely bullish being very wick heavy which in a wave two, one can measure the demand by deciphering if the second wave is full of wick or full of a full bodied candle or candles. In this case we can see the candle opening and closing in the same position after testing both highs and lows. Technically bottoming at 3692 to form the wave two, we can then see the daily third wave commencing with the break of 3804 landing at 3948 this morning. This wave might go higher but we have no printed evidence of such other than the parameters of the wave one as a numerical copy target.
In the additional chart we can see the Fibonacci targets that may be hit either if the daily wave continues or if the weekly chart chooses to find a rejection wave two which would then form a third wave to new highs and add the technical credence to this latest SPY move having tangible foundation.
SPY Daily
As we speak the SPY is still in a wave three to 3380 until technically confirmed otherwise. A break above major support by way of three wave pattern on the weekly chart will lower the probability of the macro third wave completing. Overall I expect the third wave to complete at 3380 within the next 90-120 days where I will be looking for three wave patterns to form through the timeframes suggesting a possible turnaround.
About the Three Wave Theory
The three wave theory was designed to be able to identify exact probable price action of a financial instrument. A financial market cannot navigate its way significantly higher or lower without making waves. Waves are essentially a mismatch between buyers and sellers and print a picture of a probable direction and target for a financial instrument. When waves one and two have been formed, it is the point of higher high/lower low that gives the technical indication of the future direction. A wave one will continue from a low to a high point before it finds significant enough rejection to then form the wave two. When a third wave breaks into a higher high/lower low the only probable numerical target bearing available on a financial chart is the equivalent of the wave one low to high point. It is highly probable that the wave three will look to numerically replicate wave one before it makes its future directional decision. It may continue past its third wave target but it is only the wave one evidence that a price was able to continue before rejection that is available to look to as a probable target for a third wave
Be the first to comment