

SeanShot
Overview of S&P Global
S&P Global (NYSE:SPGI) is a leading provider of transparent and independent ratings, benchmarks, analytics, and data to the capital and commodity markets worldwide. Its capital market clients include major asset managers, investment banks, commercial banks, insurance companies, exchanges, trading firms and issuers; while its commodity market clients include producers, traders and intermediaries in energy, petrochemicals, metals, and agriculture. In February 2020, S&P Global completed its acquisition of IHS Markit Ltd, which enabled it to expand the scope of its offerings into transportation and engineering.
Today, the company comprises of six operating divisions, and owns a portfolio of iconic brands in the information services industry (figure 1):
(1) S&P Global Ratings: an independent provider of credit ratings, research, and analytics, offering investors and other market participants information, ratings, and benchmarks. Credit ratings are one of several tools investors use when making decisions about purchasing bonds and other fixed income investments
(2) S&P Global Market Intelligence: a global provider of multi-asset class data, research, and analytical capabilities, which integrate cross-asset analytics and desktop services. It provides investors, government agencies, corporations, and universities with the necessary trading data, firm and industry and competitive dynamics, to perform market evaluations
(3) S&P Dow Jones Indices: a leading provider of transparent benchmarks for trading and to create new innovative products to monitor world markets. The division provides and maintains a wide variety of valuation and index benchmarks for investment advisors, wealth managers and institutional investors, the best-known of which are the S&P 500 index and the Dow Jones Industrial Index. In addition, the division also manages commodity, sector, ESG, multi-asset, dividend-oriented, cryptocurrency, factor-based, and other thematic indices
(4) S&P Global Commodity Insights: (previously Platts): a leading independent provider of information and benchmarks for the commodity and energy markets
(5) S&P Global Mobility: a leading provider of information solutions serving the full automotive value chain including OEM vehicle manufacturers, automotive suppliers, mobility service providers, retailers, consumers, and finance and insurance companies
(6) S&P Global Engineering Solutions: a leading provider of engineering standards and related technical knowledge.
Figure 1: Portfolio of brands under the S&P Global umbrella
S&P Global investor presentation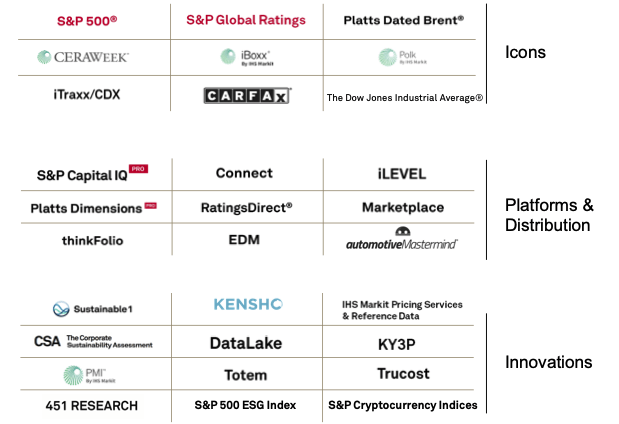
Revenue and operating income by segment
S&P Global’s quarterly revenue has grown by almost 50% to ~$3 billion (figure 2, olive dashed line) following the close of the IHS Markit acquisition in early 2022.
Figure 2: S&P Global quarterly revenue by division
Created by author using publicly available financial data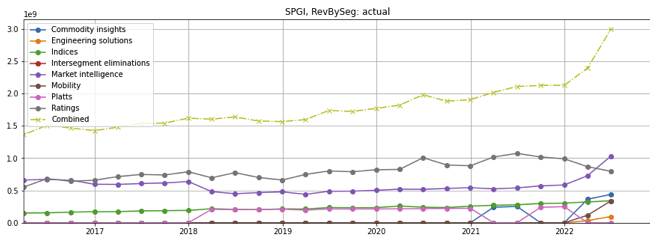
(Note: The company’s Platts division was renamed Commodity Insights following the close of the IHS Markit acquisition. Q1 and Q2 2021 numbers were adjusted for comparability)
Segment financials
Historically, the majority of S&P Global’s revenues were derived from its Ratings division. The percentage of revenues from Ratings decreased due to the IHS Markit acquisition and the slowdown in debt issuance as debt markets reacted to the Federal Reserve’s rate hikes (figure 3, grey line). However, the Ratings division still accounts for almost half of total operating income (figure 4, grey line).
Figure 3: S&P Global quarterly revenue mix breakdown
Created by author using publicly available financial data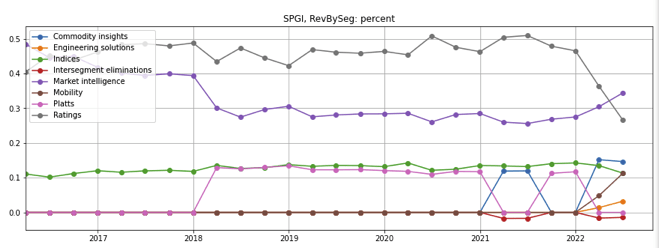
Figure 4: S&P Global’s quarterly operating income mix breakdown
Created by author using publicly available financial data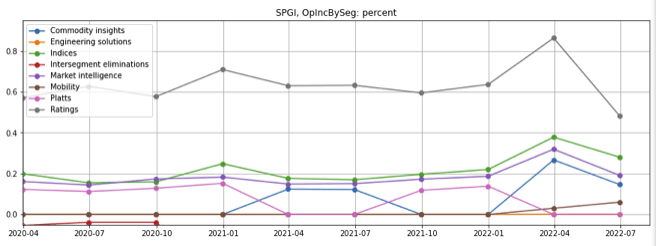
(Note: Market Intelligence operating income for 1Q2022 excludes a $1.3 billion one-time gain for the sale of assets related to the IHS Markit acquisition)
As Mobility and Engineering Solutions are small, I have mentally combined them with Commodity Insights (which I loosely call “Platt successors”) for the ease of evaluation (figure 5).
Figure 5: S&P Global quarterly revenue of the four segments as I see it
Created by author using publicly available financial data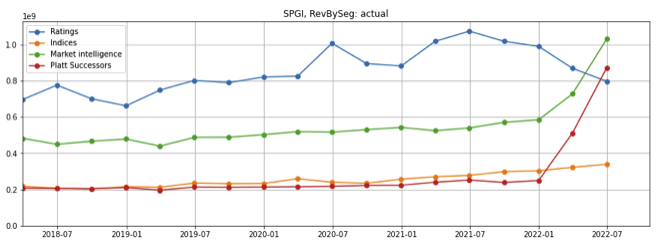
Revenue by region
The US accounts for about 60% of total revenues, but all the company’s operating regions are growing at similar rates (figure 6).
Figure 6: S&P Global quarterly revenue by region
Created by author using publicly available financial data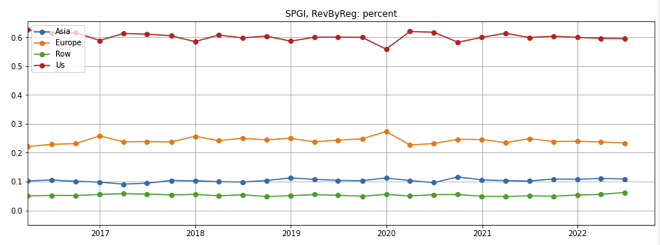
Employees by region
Interestingly, 64% of all employees are based in Asia, almost three times the number in the US (figure 7). I note that several of S&P Global’s overseas offices in India are located outside central business districts, particularly in Ahmedabad, Gurgaon, Hyderabad, Kolkata, Pune. This indicates to me that the company has likely offshored a substantial portion of its human capital-intensive jobs to lower-cost regions outside the US to keep employee compensation expenses down.
Figure 7: S&P Global employees by region
S&P Global investor presentation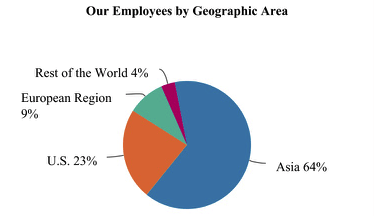
Investment thesis
My investment thesis is that S&P Global’s divisions are leaders in oligopolistic industries. The company produces substantial recurring revenue, enjoys strong operating leverage, has demonstrated consistent growth, and is well positioned to leverage artificial intelligence/machine learning technologies to provide more value to its customers.
Leaders in oligopolistic industries
Each of S&P Global’s divisions are leading players. They have recognized and respected brand names as well as the scale that enables the divisions to have both a greater breadth of market coverage and broader distribution channels. The combination of these factors creates a self-reinforcing virtuous cycle which results in a significant competitive moat that limits new entrants and the ability of smaller players to grow market share.
These businesses compete in oligopolistic industries, which should facilitate pricing stability and minimize the risk of indiscriminate price cuts even if demand weakens with a slowing economy due to the Federal Reserve’s rate hikes.
S&P Global Ratings
As I wrote in a previous article, the credit rating business has consolidated an oligopolistic industry. The big three – S&P Ratings, Moody’s (MCO), and Fitch – have captured a collective global market share of 95% – of which Moody’s and S&P Ratings have about 40% share each, while Fitch has about 15%. To loosen their dominance, the regulators at the SEC (Securities Exchange Commission) expanded the list of NRSRO (Nationally Recognized Statistical Rating Organizations) to nine firms (figure 8, click here for details on categories), making room for smaller firms such as DBRS and Kroll Bond Rating Agency to become viable competitors in the ratings business. However, the smaller players have struggle to gain share.
Figure 8: List of NRSROs
SEC website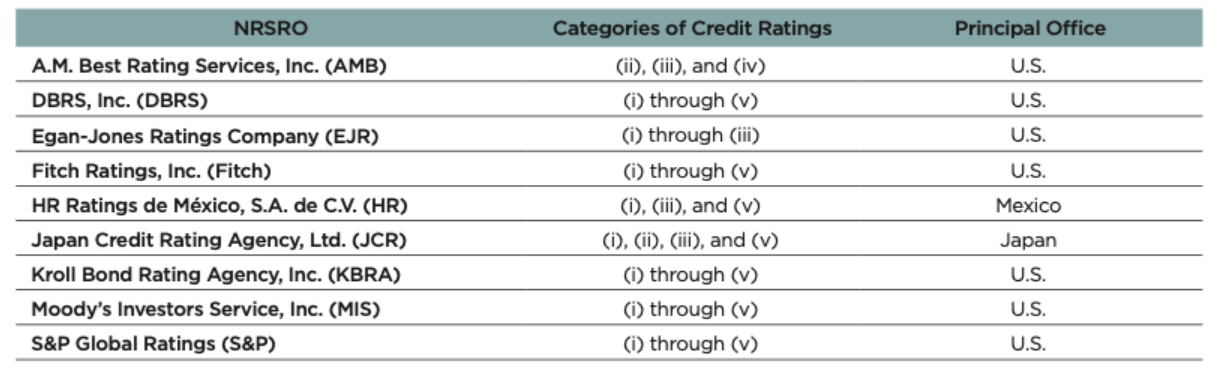
S&P Global Market Intelligence
S&P’s Market Intelligence division competes against Moody’s Analytics, FactSet (FDS), Bloomberg L.P., as well as Refinitiv – a wholly owned subsidiary of the London Stock Exchange Group (LSEG.L), all of which provide curated data and analytics to customers seeking to grow, improve efficiency, or manage risk. It also competes against a number of smaller web-based providers of market intelligence.
There are several large business information service providers that are focused on different areas and are less competitive with S&P Market Intelligence. For example, Thomson Reuters (TRI) and Wolters Kluwer (AEX:WKL) are more targeted at areas such as legal, tax, regulatory/compliance, IT, and other areas that S&P Market Intelligence has less of a presence and emphasis.
S&P Global Indices
While the S&P 500 Index is among the widest used index, S&P Global Indices also manages global, regional, sector, thematic, factor-based, ESG, and other indices (figure 8). The division’s competitors include (figure 9):
Figure 9: S&P Indices competitors
|
Competitor |
Representative Products and Indices |
|
MSCI (MSCI) |
MSCI World Index as well as sector, country, factor, and fixed income indices |
|
Nasdaq (NASD) |
Nasdaq-100 (QQQ) |
|
FTSE Group / London Stock Exchange |
FTSE Global Total Cap Index FTSE Global All Cap Index FTSE All-World Index |
|
Nikkei Shimbun |
Nikkei 225 Index |
|
Deutsche Börse Group |
Euro STOXX 50 Euro STOXX 600 |
|
Russell Indexes |
Russell 3000 Russell 1000 |
|
Cboe (CBOE) |
CBOE Volatility Index |
|
Value Line (VALU) |
Value Line Composite Index |
|
Wilshire Associates |
Wilshire 5000 Wilshire 4500 |
|
Euronext (formerly Paris Bourse) |
CAC 40 |
In addition, S&P Indices also competes indirectly against asset managers and ETF providers ranging from large, diversified institutions such as BlackRock (BLK) and T. Rowe Price (TROW) to focused and niche players such as ARK Invest.
Commodity Insights, Mobility, and Engineering Solutions
These divisions compete with Verisk’s (VRSK) Wood MacKenzie division, Bloomberg, Thomson-Reuters, Argus, Genscape, as well as a number of industry consulting firms.
High proportion of stable recurring revenue
A healthy proportion of S&P Global’s revenue have recurring characteristics, which provides some stability to earnings. I categorize S&P Global’s revenues into four categories (figure 10):
Figure 10: Nature of S&P Global revenues
|
Nature of revenue |
Sources |
% revenues |
|
Subscription (subject to renewals) |
Market Intelligence, Commodity Insight, Mobility, and Engineering subscriptions: Indices subscription: |
>85% of division revenues (except for mobility: ~77%) <20% of Indices revenues |
|
Performance-linked recurring Recurring variable: Asset-linked feeds: Sales usage-based royalties: |
Market Intelligence: based on trades, AUM, or positions valued Index royalties: Fees based on assets of underlying ETF/mutual funds Fees based on derivative index pricing data trading volumes |
9% of division revenues 66% of Indices revenue relatively di minimus |
|
Non-transactional Revenues driven by customer demand |
Ratings surveillance & research fees Conference events, consulting & analytics |
45% of Ratings revenue |
|
Non-subscription /transactional Revenues linked to transactions and exposed to exogenous factors (e.g., interest rates) |
Ratings for new issuances of debt/bank loans |
55% of Ratings revenue |
Subscription revenue has almost doubled (figure 11, blue line) due to the acquisition of IHS-Markit (which has a higher percentage of subscriptions) and now constitutes about 58% of total revenues (figure 12, blue line). Performance-linked recurring revenue has also increased to about 12% of total revenues (orange lines) but non-transactional and non-subscription / transactional revenues have declined (green and red lines).
Figure 11: S&P Global quarterly revenues by recurrence
Created by authoring using publicly available financial data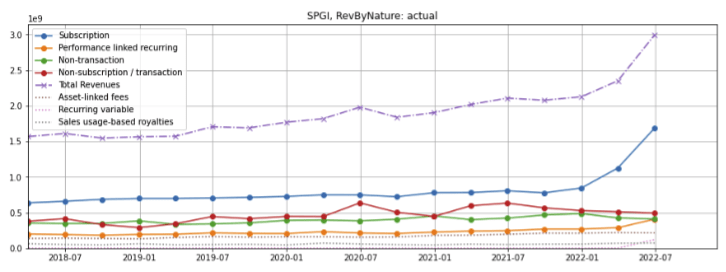
Figure 12: S&P Global quarterly revenues by recurrence as percentage of total revenues
Created by authoring using publicly available financial data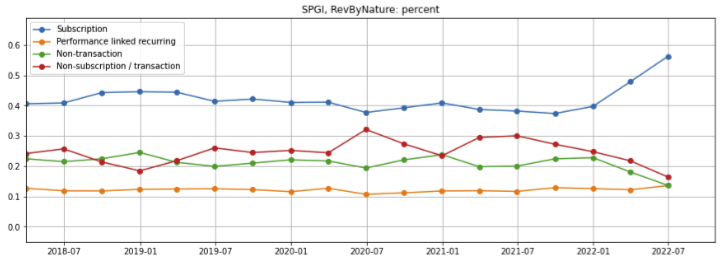
The decline in non-transactional and non-subscription/transactional revenues is primarily due to weakness in the Ratings business, which has seen corporate bond and structured finance issuances plummet in the Q2 2022 as higher interest rates resulting from the Federal Reserve rate hikes have made debt more expensive for issuers (figure 13).
Figure 13: Global corporate bond and structured finance issuances
Q2 2022 SEC 10-Q filing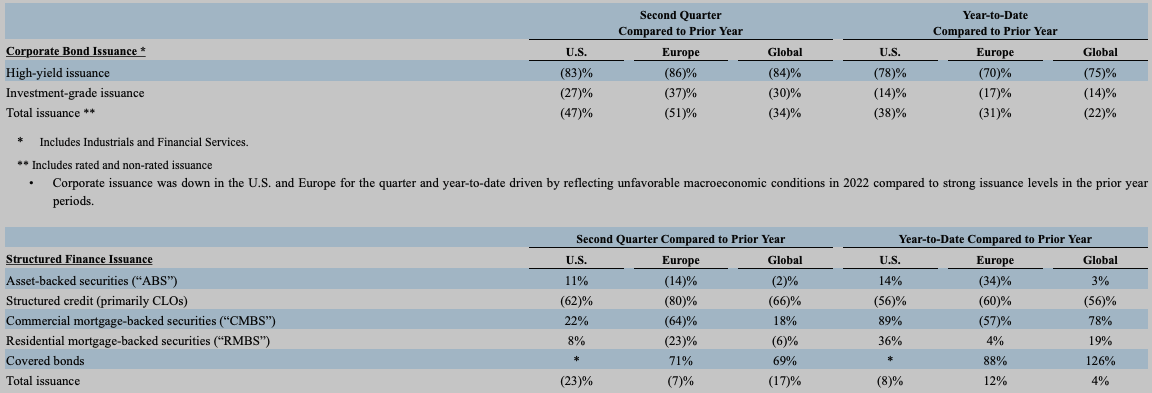
Powerful operating leverage and IHS Markit integration synergies
The economic model for information service providers is very attractive as the incremental cost of providing the same or repackaged information to an additional customer is nearly zero, so the gross margin on the incremental revenue is very high. Furthermore, the additional overhead needed to support the additional sale in relatively modest. As such, S&P Global has and will continue to benefit from operating leverage.
In the five years ended December 2021, S&P Global’s operating margin expanded by 1000 basis points (bps) (figure 14, red line). Over the same period, IHS Markit’s margin, while lower than S&P Global’s, also trended up until it was acquired by S&P Global in January 2022 (orange line).
Figure 14: S&P Global’s trailing twelve-month operating margins vs peers
Created by authoring using publicly available financial data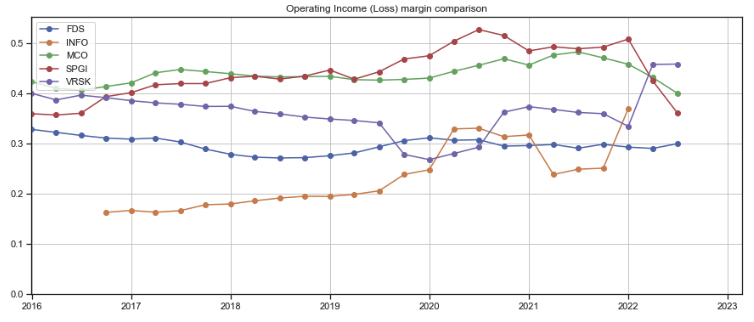
S&P Global’s margin contraction of over 1300 bps since the beginning of 2022 was largely because IHS Markit’s divisions, which generally had lower margins, were folded into Platts successor entities, i.e., Commodity Insights, Mobility, and Engineering Solutions (figure 15, red line).
Figure 15: S&P Global quarterly operating margins, by segment
Created by authoring using publicly available financial data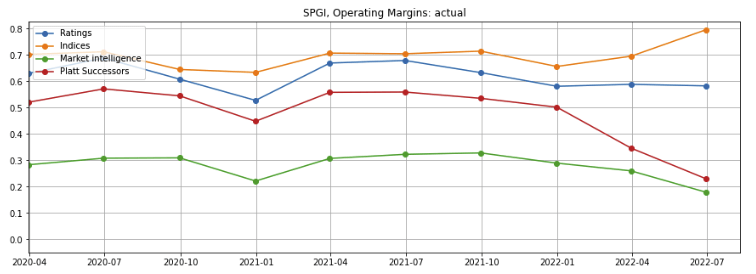
S&P Global’s free cash flow (as defined by cash flow from operations less capital expenditures) has also expanded over the last five years (figure 16, red line). The jump in 2022 was a result of the cash received from the sales of assets (including CUSIP Global Services; Leveraged Commentary and Data (LCD); Coal, Metals and Mining; and PetroChem Wire and its base chemicals business) required by anti-trust regulators as a condition for their approval of the IHS-Markit acquisition. As such, it is less indicative of the company’s longer term cash flow generation.
Figure 16: S&P Global trailing twelve-month free cash flow margins vs peers
Created by authoring using publicly available financial data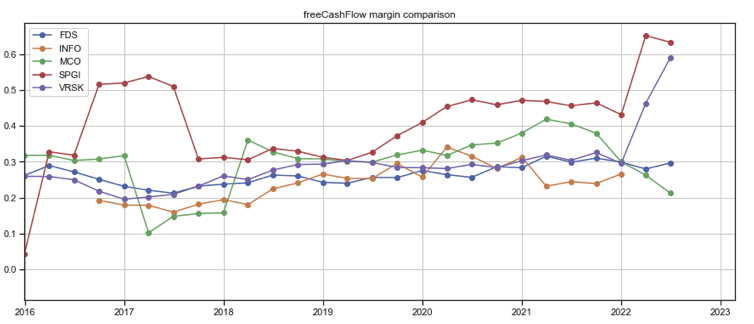
Even though S&P Global’s operating margin has ticked down and there is near-term risk of further compression if revenues contract, I believe the company’s operating margin is likely expand over the intermediate to long term due to three powerful factors:
(1) as revenues growth, the operating leverage will drive margin upwards;
(2) the ~$350 million in identified revenue synergies, of which 50% is expected to be realized by 2024; and
(3) the ~$600 million in identified integration synergies representing about 10% of current run-rate operating income, of which 80% is expected to be realized by 2023.
Continued revenue growth
Since 2017, S&P Global’s trailing twelve-month revenue, including revenues acquire through the IHS Markit acquisition, has grown by almost 70% (figure 17, green line).
Figure 17: S&P Global trailing twelve-month revenues vs peers
Created by authoring using publicly available financial data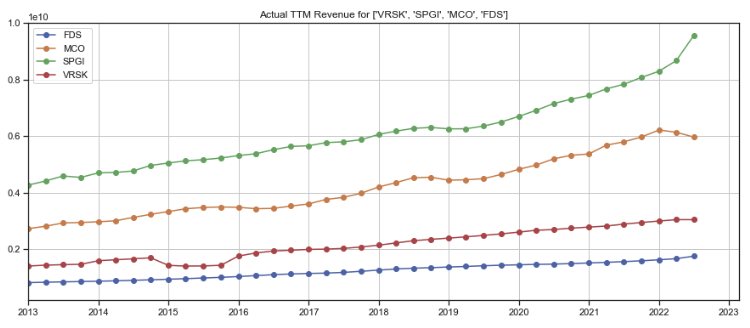
The company’s fully diluted per-share revenue has decelerated due to the shares issued for the acquisition (figure 18, Q2, brown line).
Figure 18: S&P Global quarterly per-share revenues
Created by authoring using publicly available financial data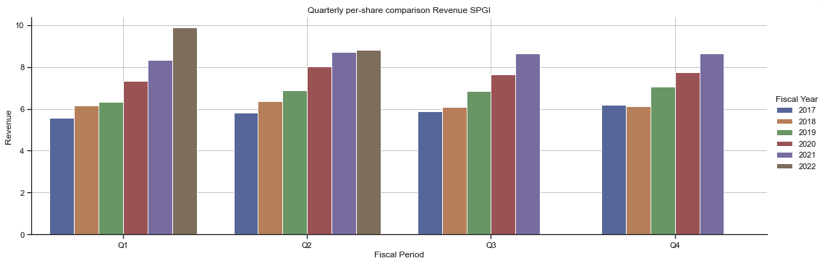
Even though short-term revenue is likely to be impacted by a weakening economy and high interest rates, I believe long term revenues will inevitably grow as customers demand more information to make better investments and trades, compete more effective, grow revenues, and improve their supply chain and operating efficiencies.
Creating more value for customers with S&P’s Kensho technology
According to consulting firms Accenture (ACN) and Garner Group, the proportion of unstructured data, i.e., data in all shapes and sizes, including text, images, media, sensor data and other formats that is not organized in a traditional row/column format, is estimated at about 80% or higher. This results in irregularities and ambiguities that make it difficult for traditional software applications to process.
S&P Global’s Kensho technology overcomes some of these challenges. Acquired in 2018, Kensho applies AI-based natural language processing to transcribe complex text documents, images, and speech, builds machine learning models to extract and classify data across the company’s data lake datasets, add structure to unstructured and semi-structured data, and helps customers transform both company-owned and third-party unstructured data into valuable and actionable business insights.
In the Q1 and Q2 2022 earnings calls, management remarked that data from IHS Markit has doubled the training datasets for Kensho, and that it will be integrating the technology across the company to automate processes and increase efficiencies, particularly in its Market Intelligence and Commodity Insights divisions. For example, the company has implemented Kensho Market-On-Close to speed up price assessments in over multiple different markets, customers have applied Kensho Link to create their own data maps, and over 300,000 users have used Kensho’s Codex tool to extract and navigate information in Capital IQ Pro.
I believe this is just the beginning of what AI and machine learning technologies can do to unlock data in S&P Global’s datasets to create more value for more customers. If Kensho’s technologies live up to expectations, it could be a game changer that enables S&P Global to pull ahead of its competitors.
Valuation and leverage
Valuation
S&P Global’s earnings yield (the reciprocal of the price-earnings ratio, figure 19) is just under 4% and roughly in line with its closest competitors (Moody’s and Verisk) and 10-year treasury yields.
Figure 19: S&P Global earnings yield vs peers
Created by authoring using publicly available financial and stock price data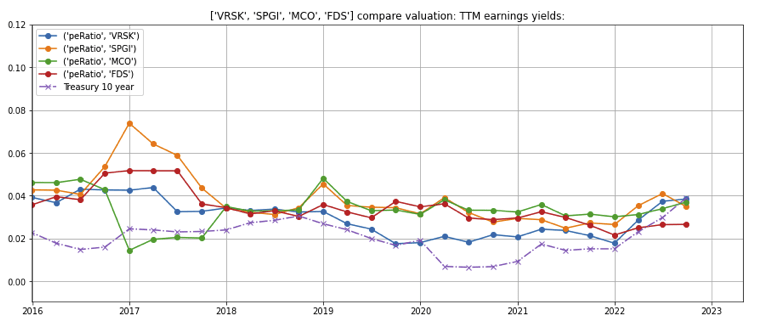
The company’s free cash flow yield jumped in 2022 because of cash received from divestitures required by regulators for the approval of the IHS Markit acquisition (figure 20, orange line). Similarly, Verisk’s free cash flow yield also grew (blue line) as a result of divestments it made to refocus on its insurance operations.
Figure 20: S&P Global free cash flow yield vs peers
Created by authoring using publicly available financial and stock price data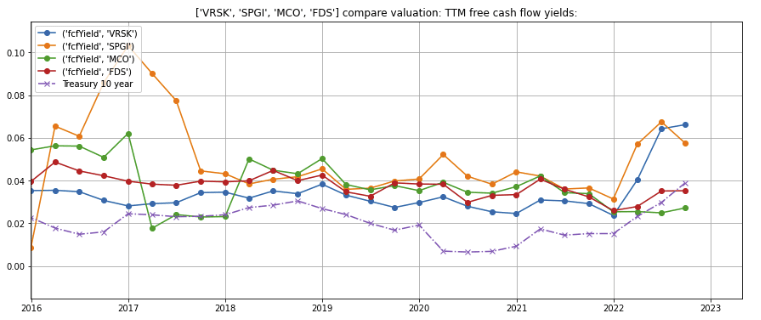
Leverage and interest expenses
As of June 30, 2022, S&P Global had $10.7 billion in long term debt outstanding, substantially all of which are locked in at highly attractive rates (figure 21). A substantial amount of the debt is due for refinancing in 2027. If rates remain high or continue to rise and the company chooses not to pay down the debt with cash flow from operations, it may have to refinance the debt at higher rates, which will cause interest expenses to rise.
In 2021, the company made the wise decision to enter into a series of interest rate swaps (aggregate outstanding notional value of $1.4 billion) which mitigates this refinancing risk.
Figure 21: Debt outstanding as of June 30, 2022
Q2 2022 SEC 10-Q filing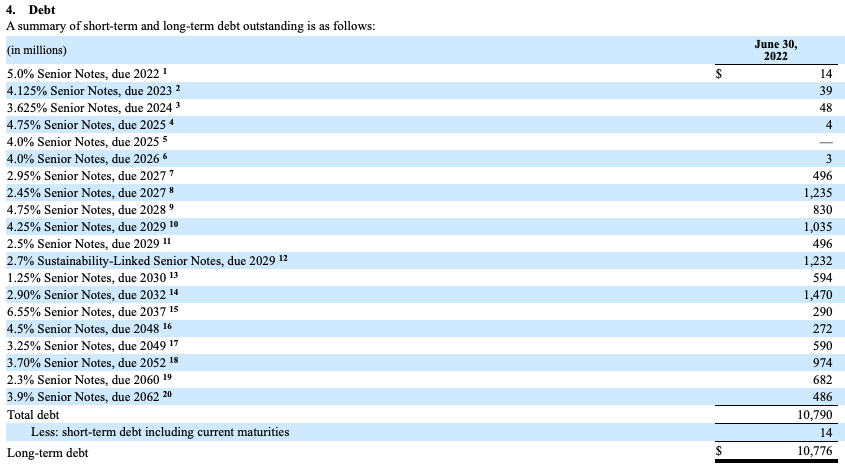
Concerns
Near-term slowdown due to high interest rates
There are downside risks to near-term revenues resulting from the Federal Reserve’s aggressive rate hikes to tame inflation, including:
- Increased risk of a near-term recession that could force budget-constrained clients to cut back on Market Intelligence, Commodity Insights, Mobility, and Engineering Solutions subscriptions;
- Fewer bond and structured finance issuances as higher interest rates drive up the cost of debt for issuers. Figure 22 illustrates the inverse correlation between S&P Ratings revenues (orange line) and 10-year treasury rates (green dashed line);
- Revenues linked to assets based on S&P’s market indices / benchmarks, and revenues dependent on trading volume or the number of trades could decline along with the equity/capital market valuations; and
- S&P Global’s customer base could consolidate, leading to fewer subscriptions.
Figure 22: The inverse relationship between S&P Ratings quarterly revenues and 10-year treasury rates
Created by authoring using publicly available financial data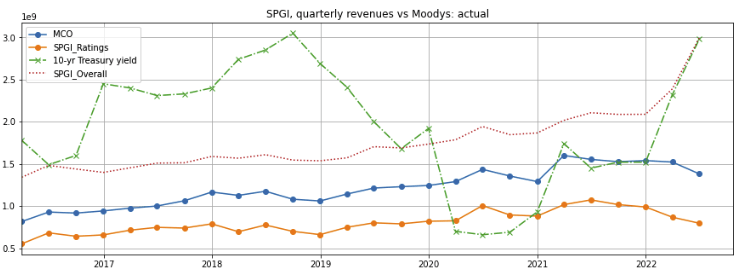
Cost inflation pressures
Inflationary pressures have driven up S&P Global’s costs. The company’s gross margin has declined since the close of the IHS Markit acquisition (figure 23, brown bars). However, as IHS Markit’s gross margins are 1500 bps lower than S&P Global’s (figure 24, orange line vs red line), it is difficult to separate the impact of IHS Markit’s lower gross margins from rising costs.
In mitigation, I believe information service providers have some degree of pricing power as customers are unlikely to cancel their subscriptions to important or even mission critical information and data over a relatively small price increase.
In any event, I will be closely watching how these variables develop over the coming quarters.
Figure 23: S&P Global quarterly gross profit margins
Created by authoring using publicly available financial data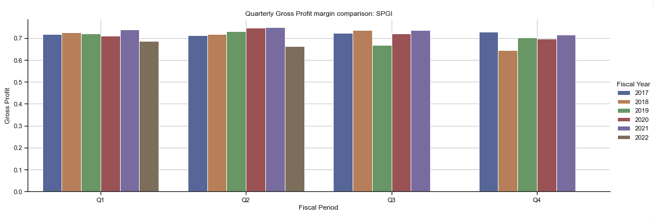
Figure 24: S&P Global vs IHS Markit trailing twelve-month gross margins
Created by authoring using publicly available financial data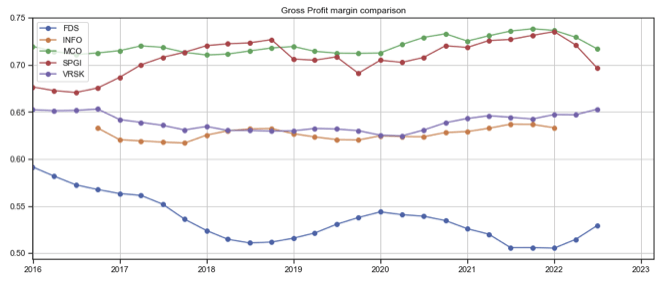
Summary
- S&P Global is a leading provider of transparent and independent ratings, benchmarks, analytics, and data to the capital and commodity markets worldwide. It acquired close competitor IHS Markit in January 2022.
- S&P Global’s divisions are leaders in oligopolistic industries, generate substantial recurring revenue, enjoy strong operating leverage, and delivered consistent long-term growth.
- The company is well positioned to capture integration synergies from its acquisition of IHS Markit and leverage artificial intelligence/machine learning technologies to provide more value to its customers.
- The earnings yield is just under 4%–roughly in line with its closest competitors and current 10-year treasury yields.
- There are near-term revenue and valuation risks but the stock may be attractive for long-term investors.
Be the first to comment