

monsitj
Back in July, I said that the bottom for this market was already in. There is a wide variety of ways one can determine if a market is more likely to go higher or lower, and at the time, I felt very strongly that we’d seen the worst of the selling. Indeed, the VOO ETF (NYSEARCA:VOO), which tracks the S&P 500, was trading at $346 when that piece was published. It subsequently ran in a nearly straight line to $396, a gain of about 14%, before the selling renewed. The question now becomes, am I sticking to my “bottom is in” call?
In short, the answer is yes. I still think the bottom we saw in June is the bottom, but recent action has me much more cautious, and now more confident that we’re going to retest that June low. I ultimately think that low will hold, but whereas before I thought we’d see critical support hold at a higher level, I’m no longer feeling as such.
Cause for concern
Let’s dig in with a daily chart of VOO, and some momentum indicators.
StockCharts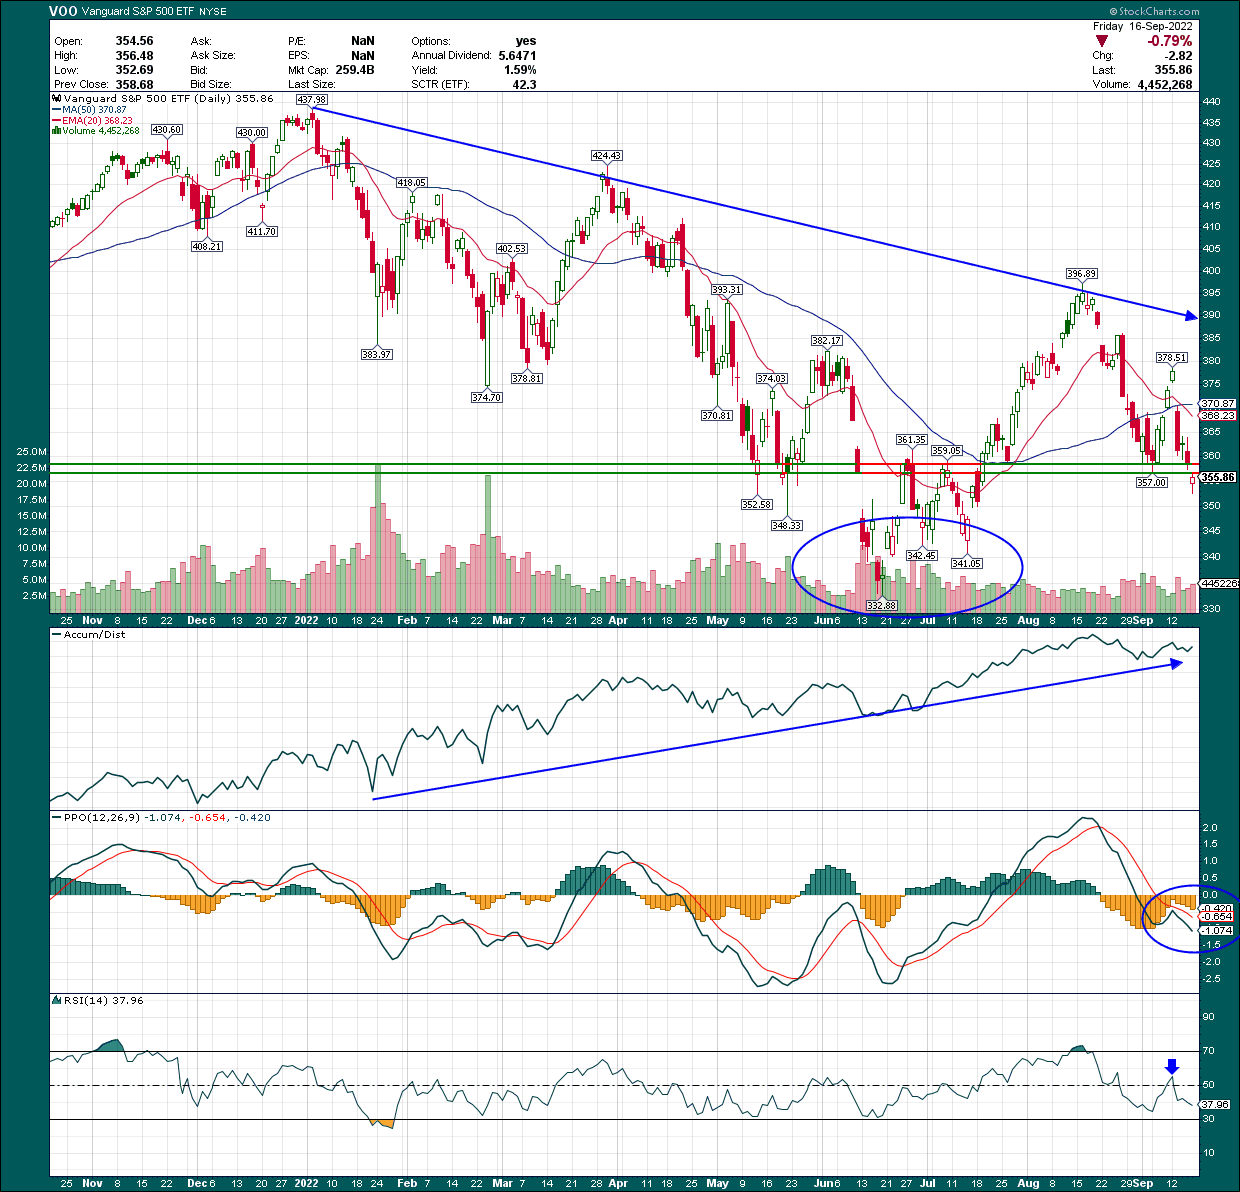
Firstly, the predominant trend remains down. I drew a trendline that shows the market perfectly hit trendline resistance from the all-time high set back in January. Until that line is broken, the bears are in charge. For what it’s worth, that line will obviously keep declining, so the longer it takes to rally again, the easier it should be to reach – and ultimately crest – that downtrend line.
The other two things to keep in mind on the price chart are support at ~$358 and the bottom set back in June. The support at $358 was violated on Friday, not just on an intraday basis, but on a closing basis. I cover the concept of max pain (if you’re unfamiliar, you can read about max pain here) with members of my community, and I was updating them throughout the week in terms of max pain levels on the S&P 500 and other securities. Max pain following early-week selling was much higher on the indices than current price, which typically means we see some sort of reversion to the mean. However, all we got was more selling, so the fact that we finished below critical support, and we essentially ignored max pain is very concerning to me. To put it in sporting terms, the bulls had an open goal and still missed the shot. We could see a max pain-related rally early the week of the 19th, but at this point if that occurs, it appears it would be short-lived. The bears are firmly in control right now.
Turning back to the daily chart, the accumulation/distribution line remains strong, which means that we’re getting declines in the morning – largely on opening gaps – and then buying throughout the day. That behavior tells me we’re not going to see another massive crash lower, because big money is still interested in this market on the long side. If we were seeing the A/D line plummet, I’d be extremely concerned, but thankfully that’s not the case.
The PPO and the 14-day RSI are both showing more weakness right now than I’d prefer as well, putting another feather into the cap of the bears. The PPO failed centerline support, and has accelerated lower again. The 14-day RSI has a very similar look, and that simply means we’re seeing more selling – and at a faster rate – than we should. That’s not surprising given the critical support level of $358 failed, but the fact that we’re seeing this bearish momentum as critical support is broken, again, is very concerning.
So what happens now? The spike low in June is about 7% lower from here, and there isn’t much in the way of support – in my view – between here and there. Unless we get a massive, sharp rally next week that sees us reclaim the $358 level and then some, along with better momentum, it appears much more likely that we’re going to retest the June low. What happens then will obviously be critical (to say the least), but at this point, I’m going to reiterate my call that the June bottom was the bottom.
In other words, right now, I believe two things: 1) we’re likely to retest the June low and 2) that low is going to hold. How am I confident in the face of this ugly selling? The factors that help us mark bottoms in the market are telling me that we’re likely not at the beginning of another enormous down move. In fact, I think we’re quite near the end of it, and if we do retest the June low, that would likely create a sustainable double bottom from which we can rally, right as our indicators make bottoms themselves.
Let’s take a look at some of the things I’m watching.
StockCharts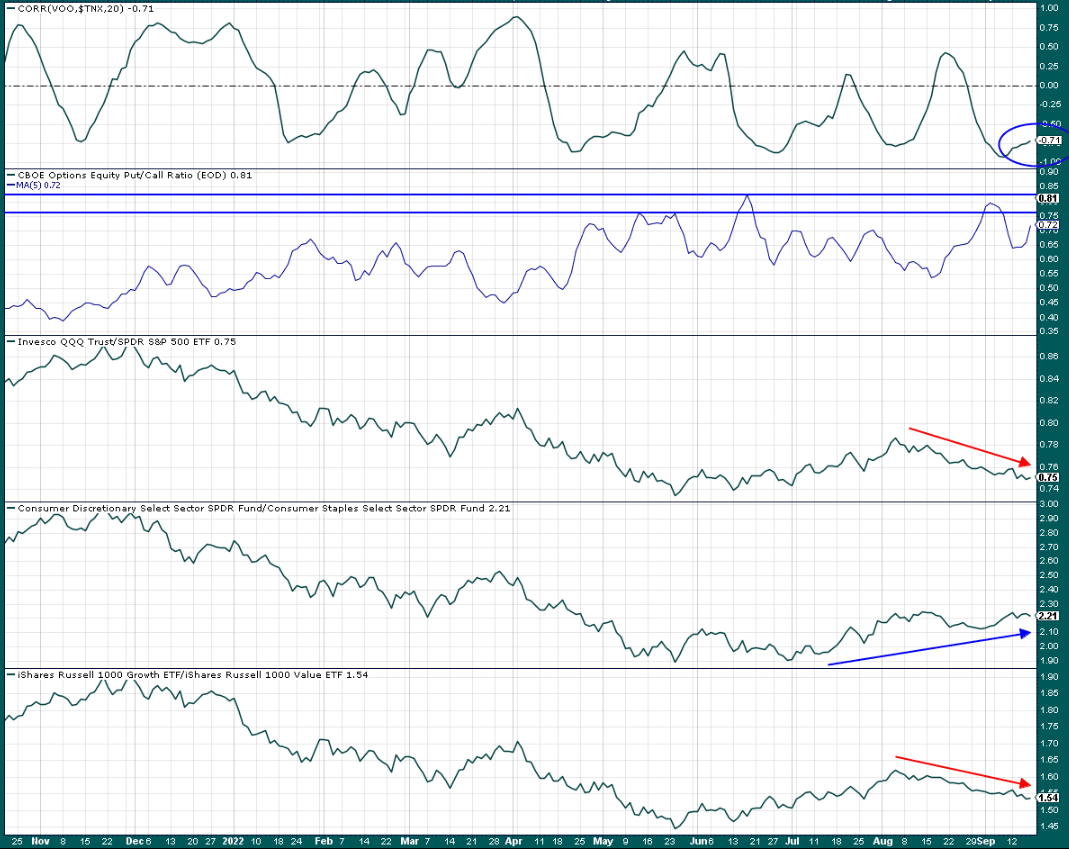
The first panel is the VOO’s correlation with the 10-year Treasury yield, the TNX. We all know rates have been rising sharply as traders sell bonds, particularly on the short end of the curve. But the TNX is a medium-term bond that is closely watched, and we can see the rolling 20-day correlation of stocks to the TNX is -0.71. In plan speak, that just means that rates and stocks are highly negatively correlated. In other words, as yields rise, stocks fall (more or less). So long as that relationship holds, the direction of rates is critical for stocks. We’ll take a look at rates in more detail below.
Next up is the second panel, which contains the equity put/call ratio, which I’ve plotted as a 5-day moving average. The CPCE is quite volatile from day to day so a 5-day MA smooths out this noise to help us better see trends. We can see the 5-day CPCE finished last week at 0.72, which is elevated, but not at panic levels. Basically, when this indicator rises, it means more puts are being bought relative to calls, which is an indicator of bearish sentiment. When this reaches peak levels, it’s an extremely reliable indicator of bottoms for stocks. The June panic low corresponded to a value of 0.81 on the CPCE, and we’re certainly not far off from that. If/when we test the June low in stocks, I’d expect the 5-day CPCE to be somewhere north of 0.80. For me, that would help cement the June low being the low. I’d actually like to see a CPCE value of something higher than 0.81 on a 5-day MA basis, which would help cement panic levels of selling.
The last three panels are ratios that help investors determine sentiment as well, by plotting key types of stocks against each other. In order, we have Nasdaq stocks against the S&P 500, consumer discretionary against consumer staples, and growth versus value. All of these show the relationship between more aggressive areas of the market against their more defensive counterparts. In doing this, we can see how aggressive Wall Street is being with capital allocation. Unfortunately for the bulls, I’m not seeing a lot to like here. The good news is that new relative lows in these relationships haven’t been seen, so as long as that holds, the “bottom is in” argument still carries weight.
Discretionary against staples is rising nicely, but the others aren’t. When you see these ratios turn higher – particularly if stocks are still falling – you’ll know the bottom is near or already in. I don’t see that right now, which is adding credence to the idea that we’re going to see a retest of the June low, or somewhere near it.
What about yields?
Let’s finally turn our attention to the TNX in more detail, given its critical importance for stocks. If you’re not familiar with this relationship, rates and stocks tend to move in opposite directions because the TNX – which is a risk-free rate – correlates inversely to stocks. That’s because the future value of a stock’s earnings must be discounted using risk-free rates. The higher the risk-free rate, the more future earnings are discounted, making them less valuable today. When rates are very low, those earnings are worth more in the present, so when rates rise sharply, equities tend to get punished on valuation contraction. That’s what we’ve seen for much of 2022. So what’s next for the TNX?
StockCharts
First and most important is the 3.48% level, which was the peak in June, before the stock market bottomed. Rates began to move down in advance of the stock market bottom later that month, and we’re setup for a similar scenario today. The TNX tested the 3.48% level this past week and so far, it has held. If we get a breakout in yields and they go higher in a big way, all bets are off for stocks and we could get waterfall selling. I’m not betting that’s going to happen, but it’s a risk right now. We’re at an absolutely critical juncture with rates so watch this carefully in the days and weeks ahead.
On the plus side (if you’re bullish equities), the PPO is showing waning upside momentum as the TNX tests price highs. While the PPO is still overwhelmingly in bullish territory, it is right at the level where rallies have failed in the past five different times in the past year. Only once did a rally exceed the ~4 level on the PPO, so it’s possible, but in my view, unlikely based on this evidence.
The 14-day RSI on yield is also showing waning momentum as it reaches overbought territory, but below levels it reached in the past. Again, this suggests this rally in yield is losing steam.
Finally, the rate of change in the bottom panel shows the rolling 10-day change in price for yield, and we can see a third indicator suggesting we’re seeing momentum wane. Yields flew higher during previous rally, but this one’s been much slower.
None of this guarantees yield won’t break out and go higher. But it does suggest the odds of a breakout are much lower than they could be.
Final thoughts
Putting all of this together, the coming two weeks are going to be critical. While a June low test would be painful for equity holders, I think that pain would be short-lived and a great buying chance. This year’s price action in equities has priced in a huge amount of pain from rates/recession/whatever else you’re worried about, and given the evidence of price action we’ve looked at, at this point I just don’t believe we’re at the beginning or even middle of the bear market.
I’d really like to see rates roll over this coming week and correspond with some sort of bottom in stocks. We’ll see if that happens, but given the evidence we have today, here’s what I think is likely to happen. I think we’ll see a top in rates soon (next couple of weeks), we’ll see the momentum and sentiment indicators in stocks make new bearish highs or lows (depending on the indicator), and that will correspond with a test of the June low in some form or fashion. If all that occurs, stocks will be in a great position to buy, and I’ll be ready to do so.
Of course, I could be wrong, and if I am, I’ll reassess with new evidence if/when appropriate. For now, I think we’re going to lose another 5% to 8% in equities for that June retest, and we’ll see what happens after that. The bottom line for me, however, is that I’m sticking to my “bottom is in” call because I don’t see the evidence to suggest this bear market has staying power. Place your bets.
Be the first to comment