

Pgiam/iStock via Getty Images
The principal focus of this article is on ASGN Incorporated (NYSE:ASGN).
Investing Thesis
Technological progress hasn’t slowed down, instead it appears to be increasing and we are chasing to keep current. As investors our progress is even more dependent on anticipating coming technology and human behavior evolution in the midst of increasingly complex surroundings.
The forecasters who can help us are the pros who everyday Make Markets for our investment portfolios. They have to deal with the huge and irregular anticipation appetites of “institutions” with multi-billion-$ portfolios demanding transactions to adjust for their today’s anticipation of technology. Expectations likely to soon appear to we ten-or 100-share investors maintaining the continual open-interest demands seen in exchange bid and offer quotes.
Those pros employ the well-educated and continuously-informed profit- anticipating researchers and information-gatherers active world-wide (on a 24x7x365 basis) needed to do their essential market-making-transaction jobs.
But they don’t want us in front of them in the buying and selling appetite-lines they intend to profit from by their disruptions. It’s what pays their rents and retirements and those of their employed staffers. So, efficient market transactions have to be quick and clean.
What makes them that way are stock-price-change “insurance” speculators willing to hedge-protect the Market-Makers during the temporary risks that must be taken in the periods of brief disruption. The costs of that protection reveal the coming-price expectations of that community, on both sides of each trade.
For those derived price forecasts we keep score on how the active markets subsequently reward or punish the expectations of prior experiences. That is this article’s job of presenting alternative investing choices for a not-certain near future of the next 3-5 months.
Description of the Primary Investment Candidate
“ASGN Incorporated provides information technology services and professional solutions in the technology, digital, and creative fields for commercial and government sectors in the United States. It operates through two segments: Commercial and Federal Government. The Commercial Segment provides consulting, creative digital marketing, and permanent placement services primarily to Fortune 1000 and mid-market clients. This segment also offers workforce mobilization, modern enterprise, and digital innovation IT consulting services; and cloud, data and analytics, and digital transformation solutions. The Federal Government Segment provides mission-critical solutions to the department of defense, intelligence agencies, and civilian agencies. This segment offers cloud, cybersecurity, artificial intelligence, machine learning, application and IT modernization, and science and engineering solutions. The company was formerly known as On Assignment, Inc. and changed its name to ASGN Incorporated in April 2018. ASGN Incorporated was incorporated in 1985 and is based in Glen Allen, Virginia.” – Source: Yahoo Finance
Yahoo Finance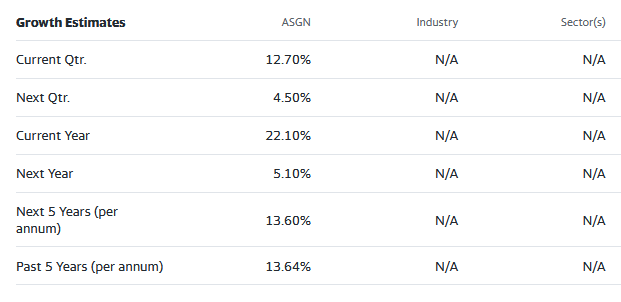
Present Reward & Risk Prospects of Alternative Investments
Figure 1
blockdesk.com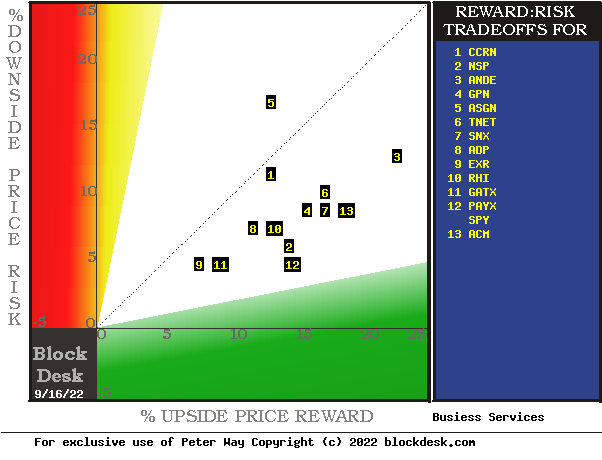
(used with permission)
Expected rewards for these securities are the greatest gains from current closing market price seen worth protecting short positions. Their measure is on the horizontal green scale.
The risk dimension is of actual price draw-downs at their most extreme point while being held in previous pursuit of upside rewards similar to the ones currently being seen. They are measured on the red vertical scale.
Both scales are of percent change from zero to 25%. Any stock or ETF whose present risk exposure exceeds its reward prospect will be above the dotted diagonal line. Capital-gain attractive to-buy issues are in the directions down and to the right.
Our principal interest is there in ASGN at location [5]. A “market index” norm of reward~risk tradeoffs is offered by SPY at [12]. The most appealing (to own) by this Figure 1 view is PAYX also at location [12].
Comparing features of Alternative Investment Stocks
The Figure 1 map provides a good visual comparison of the two most important aspects of every equity investment in the short term. There are other aspects of comparison which this map sometimes does not communicate well, particularly when general market perspectives like those of SPY are involved. Where questions of “how likely’ are present other comparative tables, like Figure 2, may be useful..
Yellow highlighting of the table’s cells emphasize factors important to securities valuations and the security ASGN, most promising of near capital gain as ranked in column [R]. Pink cell fills indicate inadequate proportions of essential performance competitive requirements, as in [H], [L-N] and [T].
Figure 2
blockdesk.com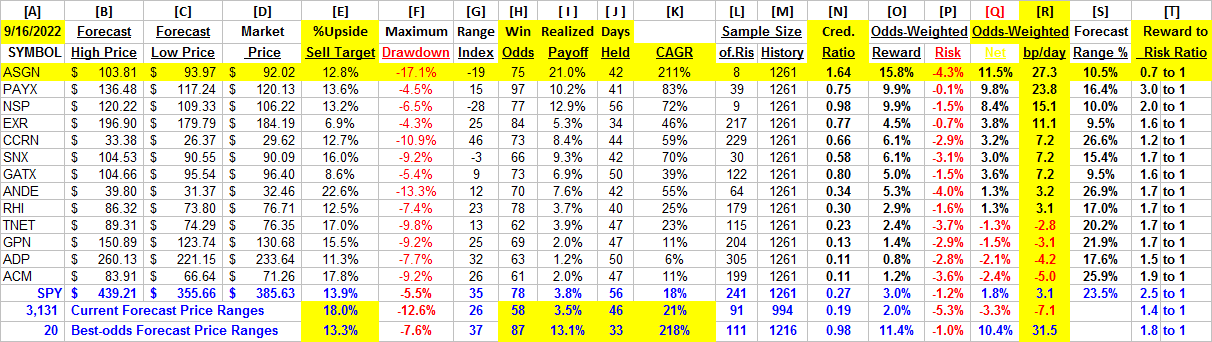
The price ranges implied by the day’s transactions activity are in columns [B] and [C], typically surrounding the day’s closing price [D]. They produce a measure of risk and reward we label the Range Index [G], the percentage of the B to C forecast range which lays between D and C.
Today’s Gs are used for each stock’s past 5-years of daily forecast history [M] to count and average prior [L] experiences. Fewer than 20 of Gs or a shorter history of Ms are regarded as statistically inadequate.
[H] tells what percentage of the L positions were completed profitably, either at range-top prices or by market close above day after forecast close price entry costs. The Net realization of all Ls is shown in [ I ].
[ I ] fractions get weighted by H and 100-H in [O,P, & Q] appropriately conditioned by [J] to provide investment ranking [R] in CAGR units of basis points per day.
The pink cell highlighting provides fatal investment evaluation conditions for several candidates, occasionally including the market-index ETF SPY. Additional market perspective is provided by the 3,000+ securities for which price range forecasts are available. They currently suggest that while market recovery is under way, it is still far from generally attractive.
On the other hand, R column scores for ASGN and the top 20 forecast population support the primary candidate’s competitive capability and notes the presence of several other demonstrated prospects.
Recent Trends of Price Range Forecasts for ASGN
Figure 3
blockdesk.com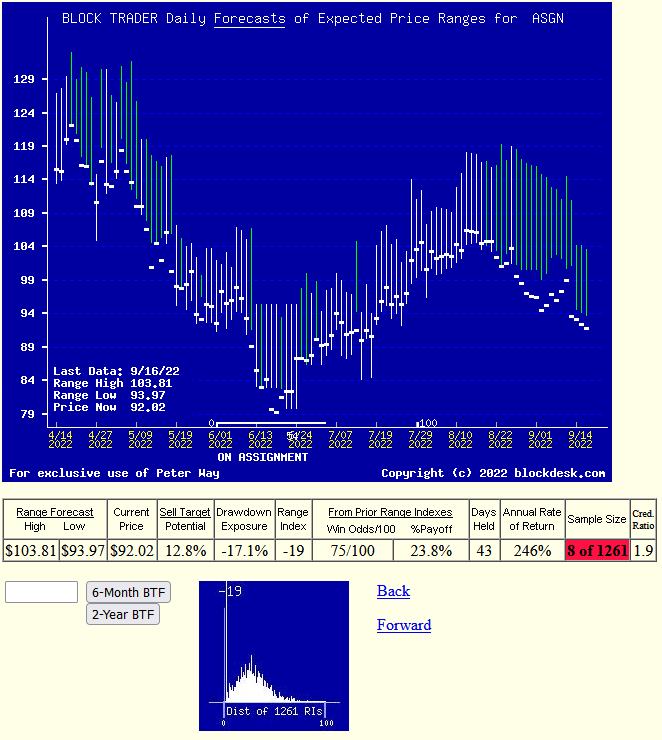
(used with permission)
This IS NOT a typical “technical analysis chart” of simple historical (only) observations. Instead it pictures the daily updated Market-Maker price range forecasts implied by live real-capital commitments in real time. Its communicative value is present here by visual comparisons at each forecast date of the proportions of upside and downside price change expectations by the market-making community, as influenced by the actions of an interested and involved big-$ institutional investing community.
Those forecasts are typically resolved in time horizons of less than a half year, and often in two months or shorter. This one states that of the 20 prior forecasts like today’s, most were completed in 43 market-days (9 weeks) profitably at average +16% profits, a CAGR rate of +102%. No promises, just fun with history.
Conclusion
Comparison of the performances of near-term Market-Maker forecasts for ASGN Incorporated with similar forecasts of other technologically-active securities pursued by investor referencing, it seems clear that this stock can be an attractive investment choice for investors pursuing near-term capital gain strategies.
Be the first to comment