

24K-Production
Thesis
We updated in our August article on the Vanguard S&P 500 ETF (NYSEARCA:VOO) that investors should expect near-term downside volatility, given its overbought indicators. Accordingly, the pullback from VOO’s August highs has been rapid and steep, with the VOO losing more than 10% of its value over the past five weeks.
As a result, the VOO has also given up all its gains from August as it attempts to form another bottoming process predicated on its September price action. The downside volatility has been intense, as the market initially shook out investors after Jackson Hole in late August. However, last week’s recovery was quickly digested, as August’s CPI print exceeded consensus estimates, triggering the worst sell-off in a single session since June 2020.
However, we noted that VOO’s short- and medium-term momentum indicators had moved back into oversold zones. Therefore, we deduce that the index is primed to stage a rebound from the current levels if the market intends to take this higher. Thus, VOO is back to a critical juncture as investors seek clarity on its near-term directional bias.
Notwithstanding, we believe that our thesis of a medium-term bottom in June remains intact. Our view is also corroborated by our analysis of constructive price action in speculative growth stocks represented by the ARK Innovation ETF (ARKK) and the S&P 500’s relationship with the Russell 2000 index (RTY).
We discuss why we are confident the current pullback proffers investors another fantastic opportunity to add exposure, despite an increasingly hawkish Fed and looming recession.
Don’t Be Spooked By August’s CPI Print
Last week’s CPI print spooked the market as investors focused on the potential of an even more significant 100 bps rate hike (18% probability as of September 16) at the upcoming FOMC meeting. Therefore, it raised fears among market participants who chased the summer rally through August highs, as investors fled the scene once more. Accordingly, it drove the familiar “sell first, ask questions later” theme that has been overplayed in 2022.
Despite that, investors need to note that August’s 8.3% YoY rise was below July’s 8.5% uptick. It was also well below June’s 9.1% increase. Therefore, it’s arguable that inflation has likely peaked in June, which corroborates with our thesis of a sustained market bottom (as discussed in our previous article).
Fundstrat also highlighted that it believes inflation has likely peaked, as it accentuated: “Even for those in the ‘inflationista’ camp or even the ‘we are in a long-term bear’ camp, the fact is, if headline CPI has peaked, the June 2022 equity lows should be durable.”
JPMorgan (JPM) added weight to that observation as it articulated: “The data appear to be increasingly supportive of a soft landing (rather than global recession), given moderating inflation and wage pressures, rebounding growth indicators, and stabilizing consumer confidence.”
Also, we have often reminded investors that the market is a forward-discounting mechanism. While no one can pinpoint the exact tops/bottoms with remarkable accuracy consistently, we believe the market’s June bottom looks increasingly resilient, given the continued moderation in CPI. Therefore, we surmise that the market is unlikely to break below its lows in June. Instead, we deduce that the market used the CPI print to shake out weak hands once more as it forms its bottoming process.
Leuthold Group also urged investors to look ahead, despite the high pessimism, as it articulated:
The fact of the matter is that once inflation has peaked, the stock market has bottomed, and I think the next move is probably up. I think it’s very clear to me that inflation number one, has peaked, and number two, is coming down broadly. On major inflationary peaks, you can’t wait for inflation to get all the way back down to where the Fed wants it to get. You have to buy when inflation peaks. – Insider
S&P 500 Was Dragged Down By Tech’s Weakness
VOO price chart (weekly) (TradingView)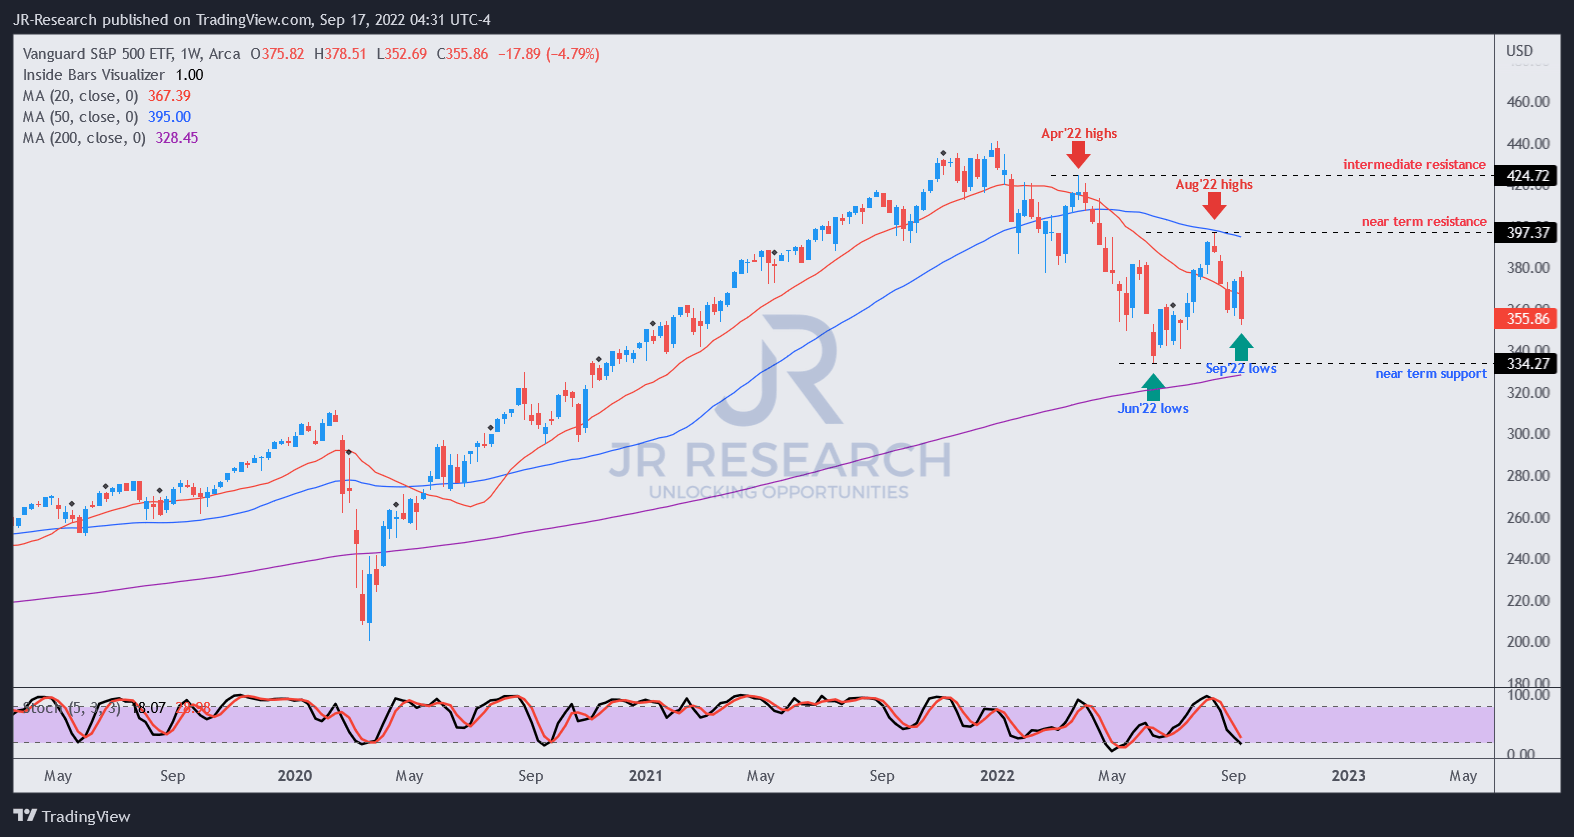
VOO has broken below its August lows as it digested July gains further. However, the rejection at its August highs was notable, as it couldn’t retake its 50-week moving average (blue line). Therefore, it spurred bearish sentiments as the bears prognosticated their conviction of the end of a bear market rally.
While the rejection was unconstructive, investors should consider that the rapid recovery from its June lows deserved a pullback to digest some overbought froth.
VGT price chart (weekly) (TradingView)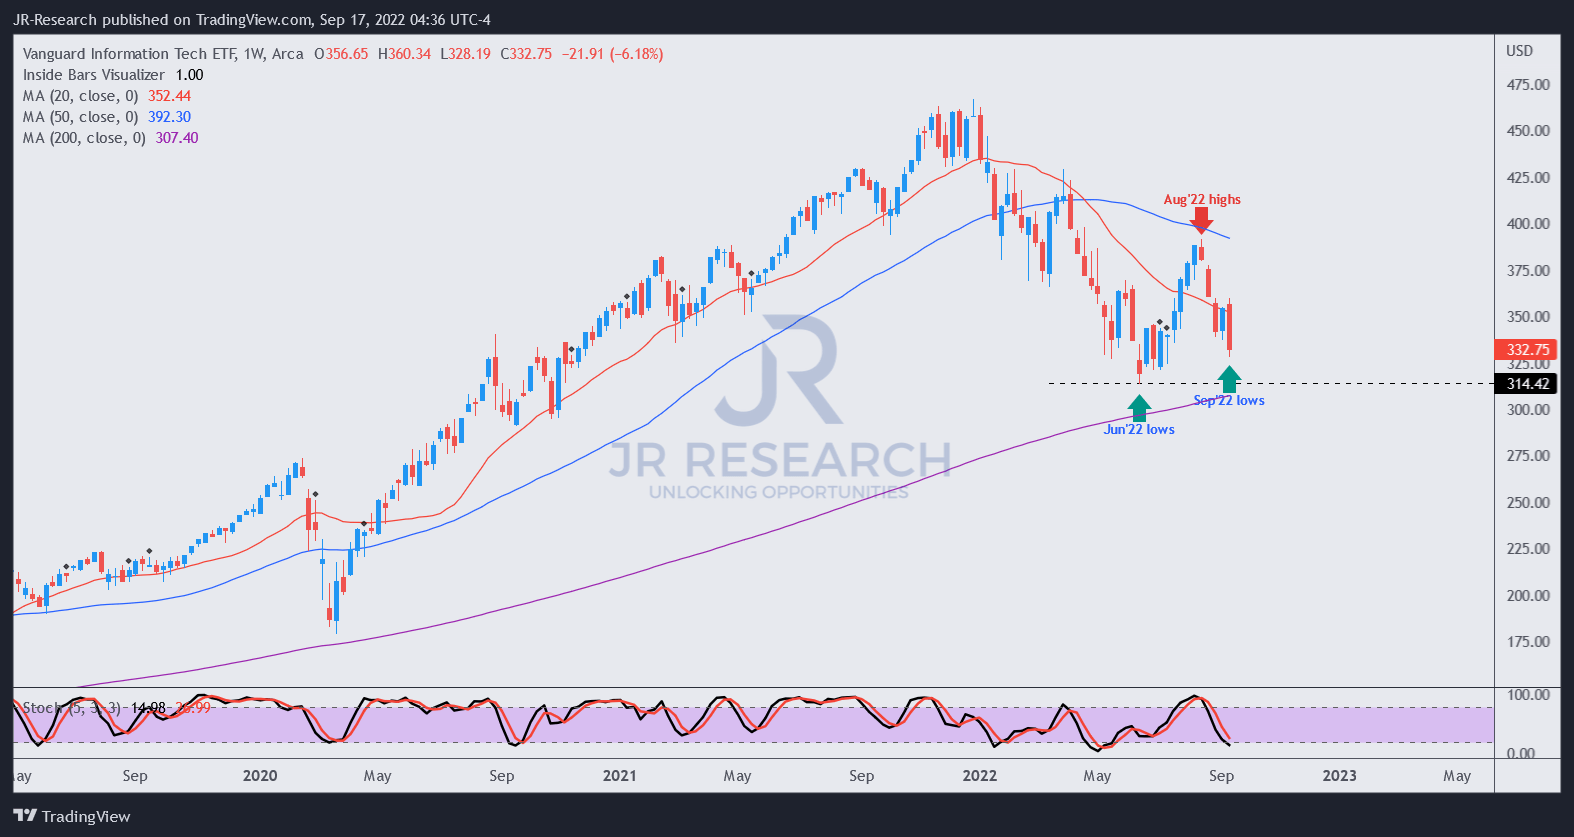
Furthermore, broad weakness in tech, driven by deep pullbacks in SaaS and semi stocks, also sent the Tech ETF (VGT) down below its August lows. Moreover, given tech’s weighting in the VOO (27.3%), it contributed markedly to the intense selling in the S&P 500, as seen above.
But, Not Everything Looks Bad
ARKK price chart (weekly) (TradingView)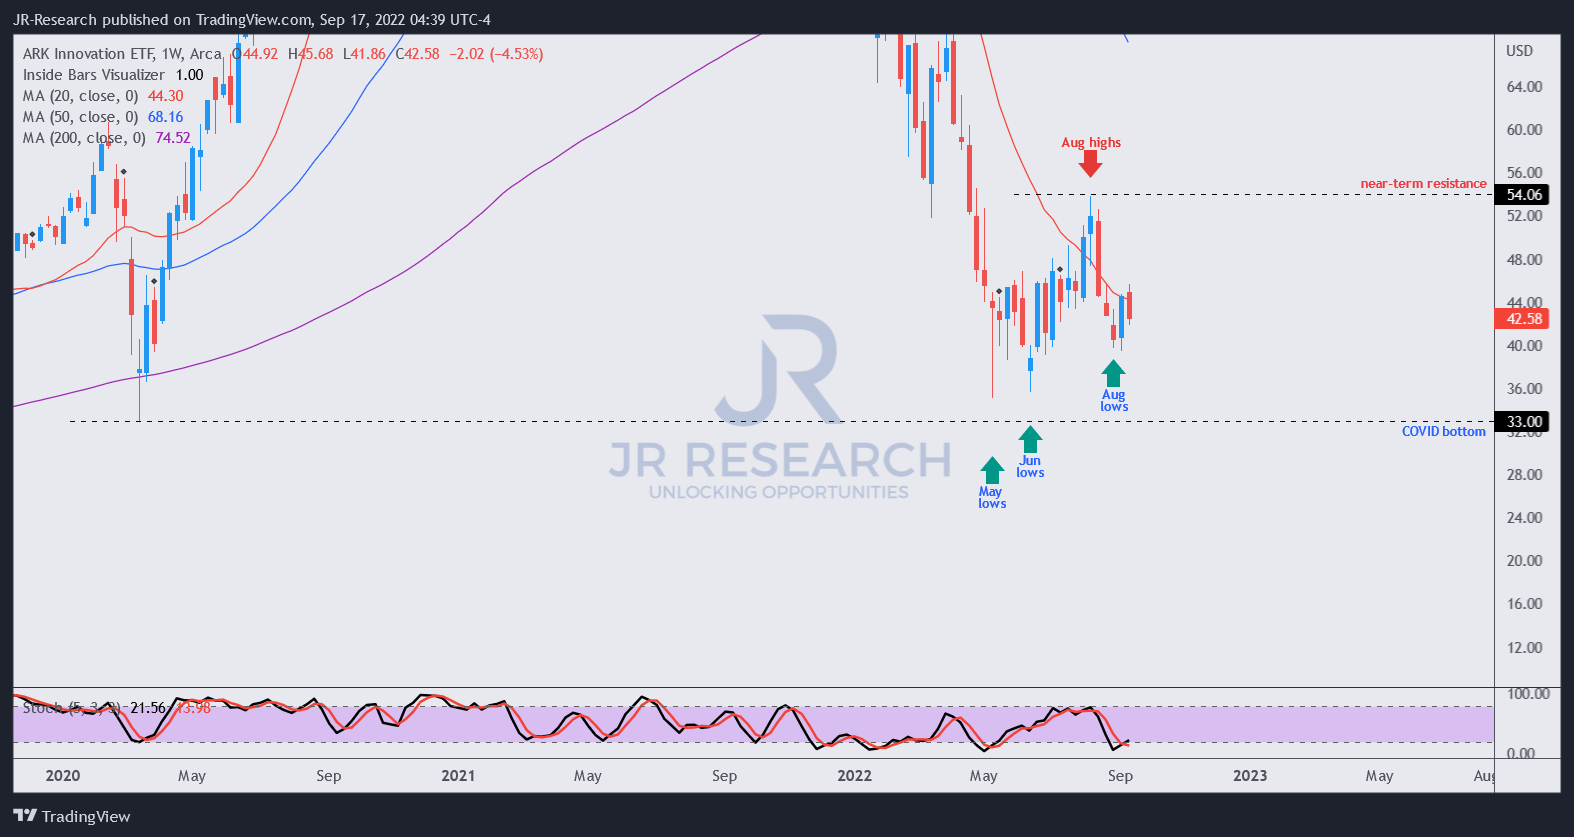
We need to highlight that investors should also assess the price action in other thematic ETFs, such as the ARKK. Our experience informs us that speculative growth stocks have shown a tendency to lead the broad market into a downturn, as seen in November 2021.
Likewise, we think the ARKK’s constructive price action has demonstrated its resilience, despite the broad market pullback. As seen above, ARKK has held its August lows decisively. Moreover, September’s weakness has failed to unhinge ARKK from its bottoming process since May 2022. Therefore, we postulate that the recent weakness in the S&P 500 is not broad-based but narrowly driven by the pullback in the S&P 500’s leading tech constituents.
VCR price chart (weekly) (TradingView)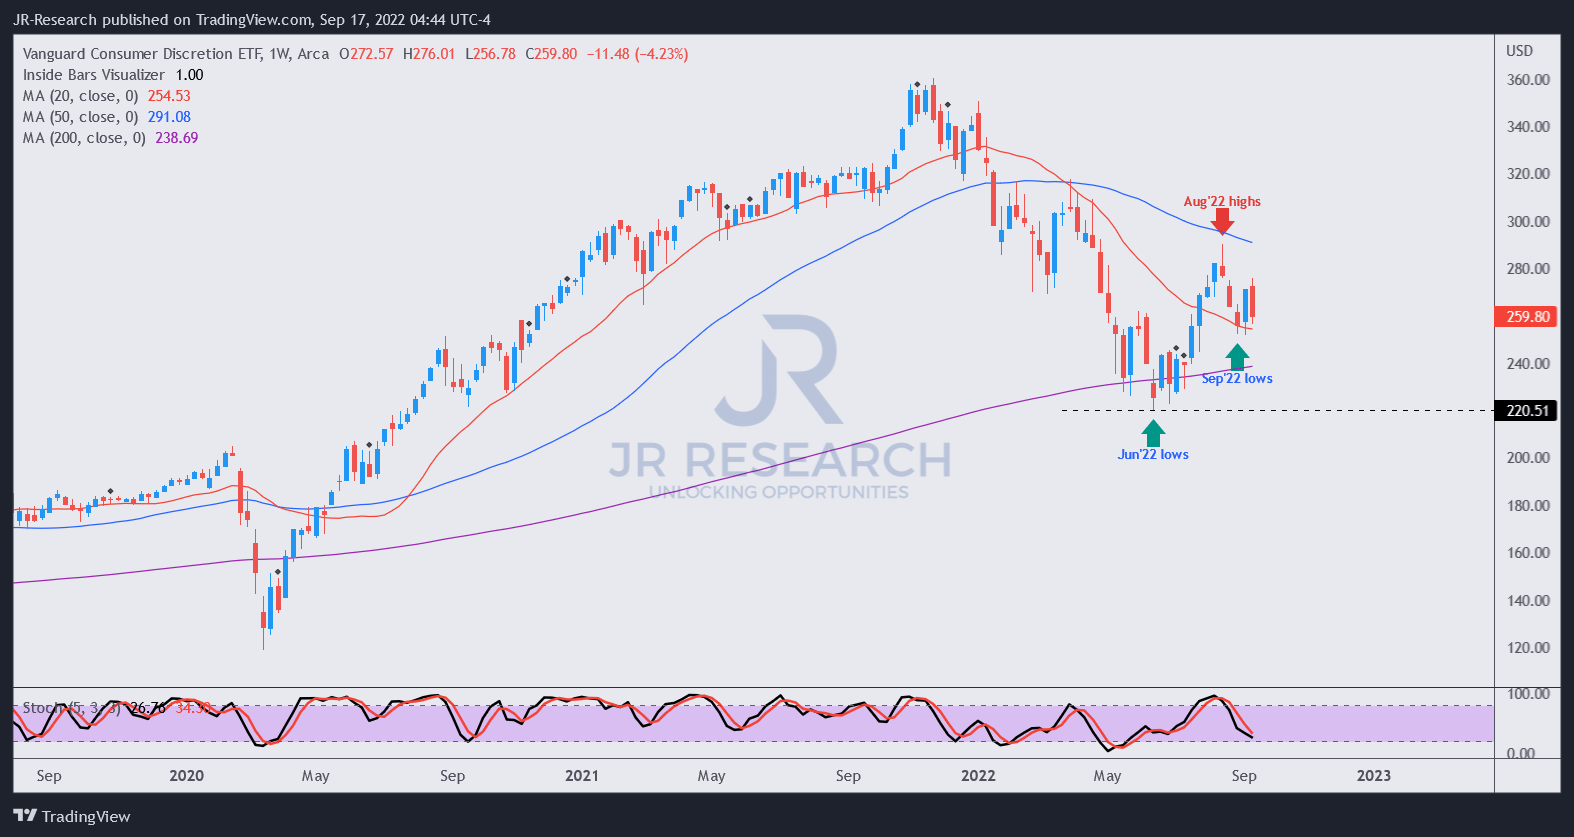
We also corralled positive price action from the Vanguard Consumer Discretionary ETF (VCR). While it also pulled back expectedly from its August highs, it has been supported resiliently. Therefore, VCR’s price action suggests that tech’s deep pullback has not been reciprocated, which augurs well.
RTY/SPX price chart (monthly) (TradingView)
Also, the price chart for the Russell 2000/S&P 500 futures (SPX) has demonstrated its robust bottoming process since May 2022. Investors should note that the RTY has consistently led the S&P 500 into a bear market and out of one over time. Accordingly, September’s selling has not broken below May lows, suggesting that the bears could lose further downward momentum.
Is VOO ETF A Buy, Sell, Or Hold?
We reiterate our Buy rating on the VOO.
We are confident that the recent pullback represents a fantastic opportunity for investors who missed June lows to add further exposure aggressively.
Moreover, tech’s deep pullback has not been reciprocated throughout the market. Therefore, we believe it augurs positively for the market moving ahead, suggesting the bears are losing momentum toward the downside.
Be the first to comment