

Scott Olson/Getty Images News
The S&P 500’s forward estimate rose again this week, but that will be discussed below. Note the S&P 500 PE today at 15.5x, and the S&P 500 earnings yield is at 6.42%.
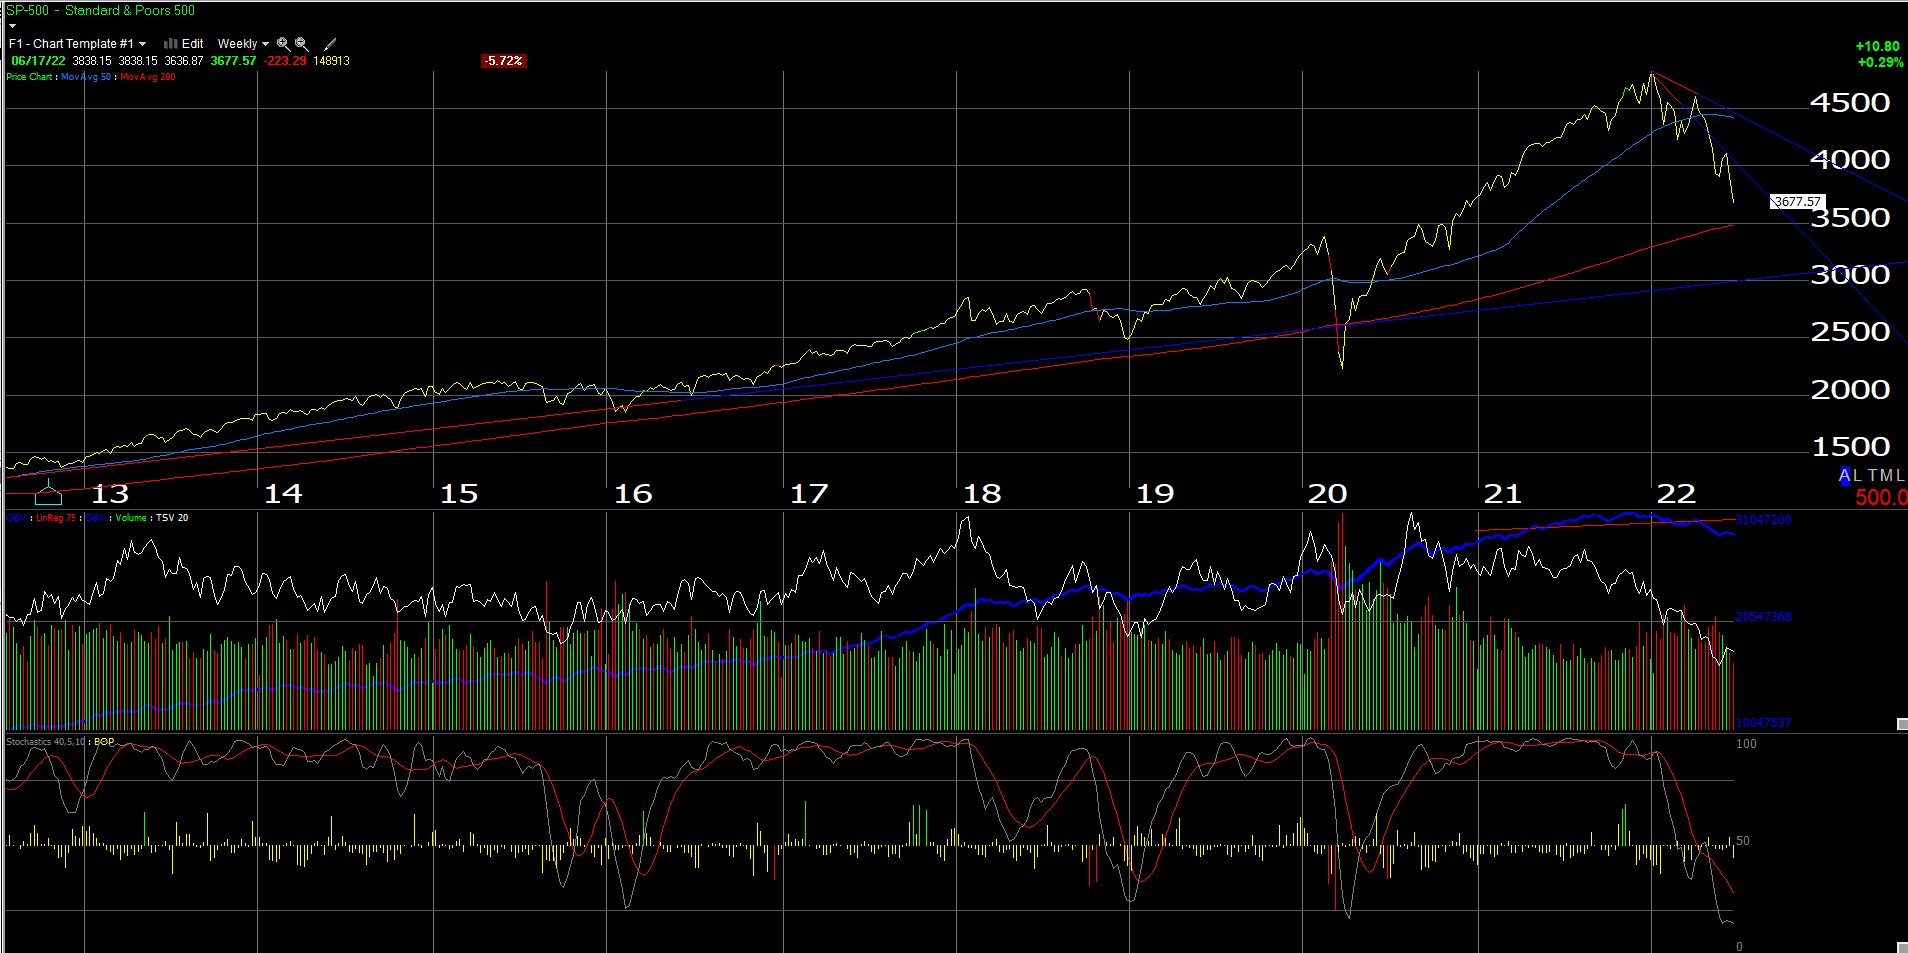
Had to start the weekend missive off with a “weekly” chart of the S&P 500. Note the 200-week moving average resides at the 3,500 level or roughly 175 points further down from where the market closed today, Friday, June 17th, 2022.
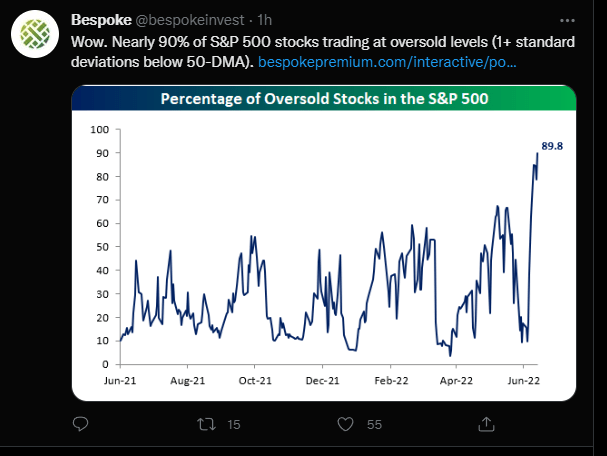
This chart from Bespoke shows that as of this morning, 90% of the S&P 500 is currently at “oversold” levels.
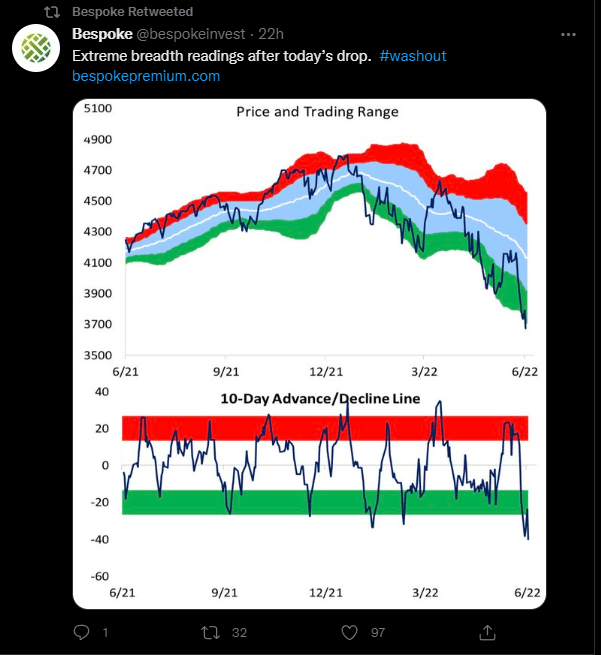
This Bespoke chart also shows the extreme readings, reflecting oversold ranges and market breadth.
S&P 500 Earnings Data Update:
- The forward estimate jumped to $236.06 from last week’s $235.61. The forward estimate started the year at $223, but it’s been hovering around $233 – $236 since April 15th, 2022;
- The PE this week slumped to 15.5x after the week’s near 6% loss;
- The S&P 500 earnings yield jumped to 6.42% from last week’s 6.04% and 2022’s start of 4.77%;
- The quarterly bottom-up estimate remained exactly the same this week at $54.91;
The S&P 500 earnings data continues to hold up with less than 2 weeks left in the quarter. The Adobe (ADBE) disappointment and the DocuSign (DOCU) miss have me wondering whether Microsoft (MSFT) has a guide-down coming in the July ’22 release, but Oracle’s (ORCL) numbers were pretty good. That being said, all these companies have definitive niches, but are broadly considered software.
FedEx (FDX) and Lennar (LEN) report this coming week. FDX is held in client accounts and is one of my favorite industrials. FedEx reports earnings Thursday, June 23rd, after the bell. Will have an earnings preview over on Seeking Alpha. Toll Bros (TOL) and Lennar have been a house of pain this year, with LEN peaking at $116 per share in December ’21, now trading pre-earnings near $64 – $65.
Summary/Conclusion
There is still little signs of weakness either in the forward or current S&P 500 earnings data. Take of that what you wish. The S&P 500 PE ratio has fallen from 20x – 21x to start the year to now 15.5x. That’s amazing. That’s true “PE compression”. The S&P 500 earnings yield peaked at just over 7% in December ’18 during Jay Powell’s last tightening cycle, with the S&P 500’s earnings yield ending this week at 6.42%.
If the S&P 500 does hit 3,500 in the next few months, with the same forward EPS estimate of $236, the S&P 500’s earnings yield jumps to 6.74%.
It was Bespoke’s data that caught the eye this week. The oversold measures for the S&P 500 seem rather dramatic. With two weeks left in the quarter or rather 9 trading days, the odds of a quarter-end rally are likely high, but that’s not a forecast. It all depends.
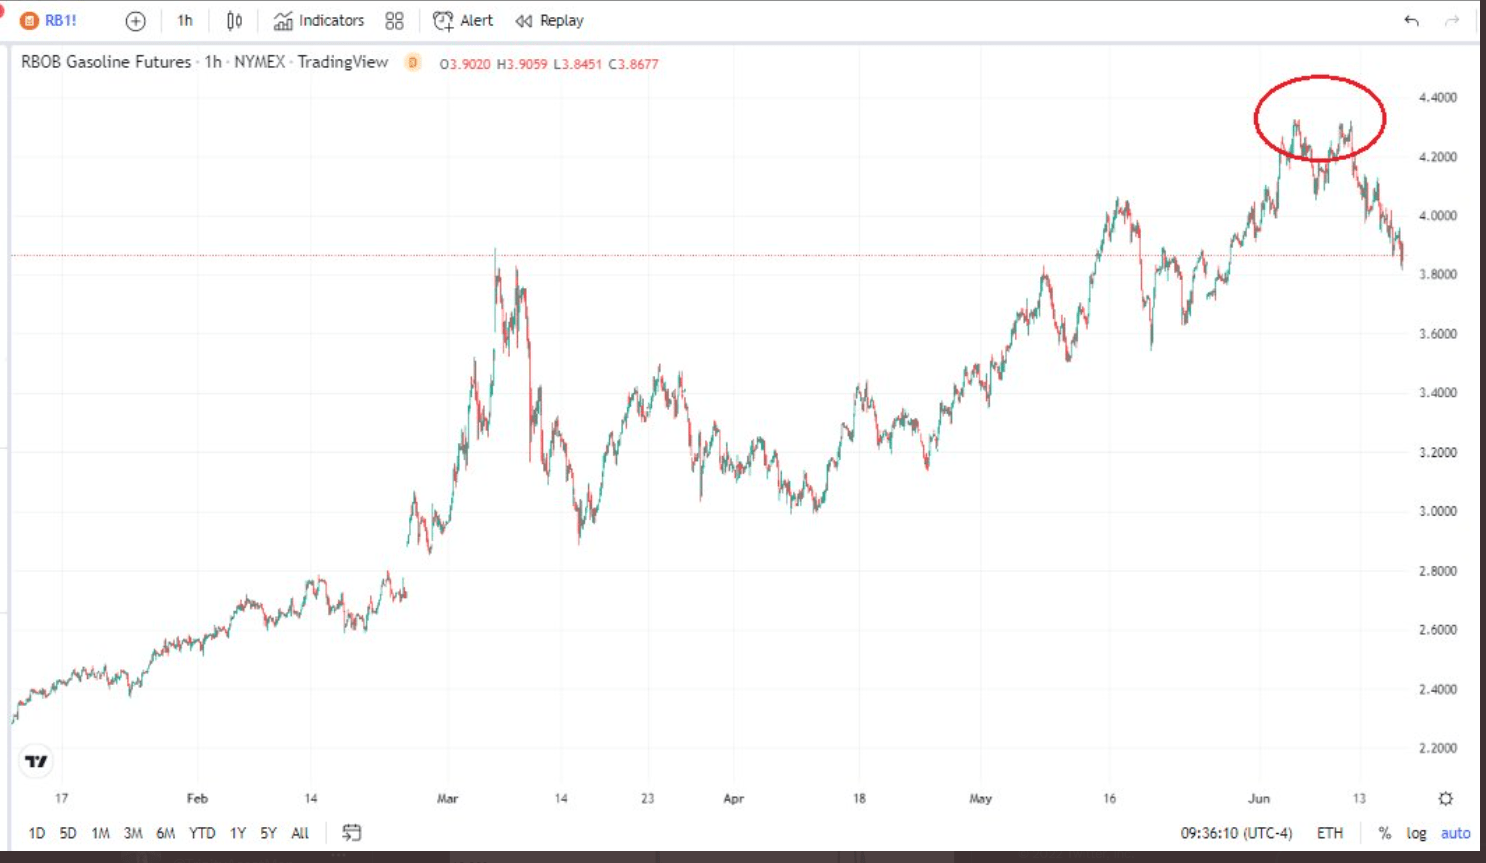
Energy finally cracking this week didn’t seem to spur much of a rally. Mike Zaccardi’s (@mikezaccardi) showing the double-top in gasoline was sent to clients hoping to lift their spirits.
None of this is a forecast or a prediction. However, it does seem as if a quarter-end rally could happen, given the stretched nature of the market. However, this current dynamic of higher bond yields and a lower stock market could return. The June jobs report is July 8th, the CPI data follows the next week on July 13th, then the July FOMC meeting doesn’t happen until July 26 – 27.
The fact that energy stocks fell sharply this week did almost nothing for the stock market, even on Friday, June 17th, when the complex fell sharply, is disappointing. (Great call by Carter Worth on @CNBC’s Mad Money when he was on a few weeks ago saying sell the sector.) Most investors are likely viewing this as a temporary pullback to be bought. Clients have had no positions in energy for years. The sector is still a relatively minor 5% of the S&P 500 by market cap.
The only question I have nearing the end of the 2nd quarter, 2022 is do I sell all credit risk from the bond allocations of client accounts in the event of a recession. That seems Draconian to me since all corporate high-yield was sold in March or April, (and it was short-duration high yield or the SHYG) and all high yield muni exposure was sold, and it was all Nuveen’s muni high yield funds. If it’s a mild recession as I would expect, if crude oil and gasoline don’t explode materially higher, selling all corporate credit risk seems too extreme.
The fact is, “liquidity risk” is the silent killer of bond markets. 2008 was the mother of all liquidity and credit risk crises, but liquidity can dry up in corporate bond land, and the mutual funds owned for clients feel that. (As a rule, I don’t buy individual corporate bonds for clients.) It ultimately depends on how S&P 500 earnings hold up, and where “neutral” is on the fed funds rate. Rick Rieder started to talk more about bond market liquidity on BlackRock’s last monthly bond call for investors.
CNBC has been full of market “top” and “bottom” callers for decades. For me to think that the S&P 500 is permanently healing itself and the major drawdown or recession risk is over, the S&P 500 must recover the 3,180 level or the May 20th low, and then recover the March ’22 lows around 4,157 and 4,161. Readers don’t need to call absolute bottoms or tops – in fact, I think it is very dangerous. You can be patient.
Take all this with a skepticism and not as a forecast or predictions. It’s a very unusual year, after 2 years of gross distortions to the US economy. The Barclay’s Aggregate (AGG) is off to its worst start to a year ever, while the S&P 500 is off to its 2nd worst start to a year since 1940. (See Charlie Bilello’s work on Twitter.) How’s that for extremes?
Thanks for reading.
Editor’s Note: The summary bullets for this article were chosen by Seeking Alpha editors.
Be the first to comment