

Scott Olson
Introduction
To understand where the market will move over the next year, the easiest metric to look at is historical changes in the federal funds effective rate. As we all know, the Fed is currently raising rates to combat high inflation, and this has only happened a few times over the past forty years. Also, it is expected for rates to peak soon as inflation is beginning to trend down. I will target the six months prior to the peak as a way to compile historical S&P 500 (SP500) return expectations.
To do so, I will use the data provided by the FRED system. I then looked at the data to determine when effective rates were rising then either peaked or plateaued. This led to me finding six periods between 1981 and 2022 to use for the analysis. As rates have failed to peak in 2022, and we do not know where the Fed will end up, I looked at the total returns three times during the rising rate periods. This provides an adjustment in case it takes up to six months for rates to peak over 2023.
Federal Funds Effective Rate
St Louis Fed, FRED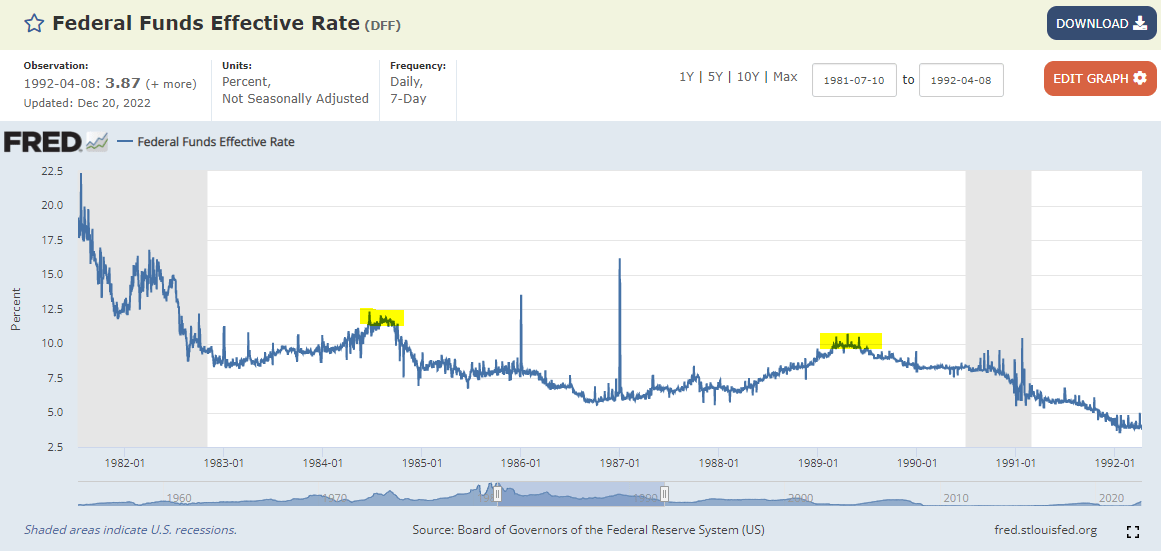
Also, it is important to compare these results to the broader growth trend of the market. As per the following SA article quote, the historical annualized return of the S&P 500 is slightly above 10%. Bear this in mind as we move forward from a 2022 that is set to be quite contrary to the historical data, ending close to -20% for the year.
The S&P 500 average return is 10.67% annualized since the inception of its modern structure in 1957. Dating back to its earliest pre-modern structure in 1928, the S&P 500 has returned 10.22%. This near-century consistency in the long-term average rate of return supports the often quoted “10% average return on the stock market.”
In fact, according to CNBC, multiple years of negative returns in a row is an extremely rare event:
Think about that: for all the worry about down markets, the S&P has dropped two consecutive years or more only four times since 1929. That’s pretty remarkable.
All other down years were one-offs (there were 12 of them), and the market was higher in the next year.
There’s something else to note about the consecutive down years: they follow big economic events, wars or big geopolitical conflicts.
Therefore, the probability that 2023 will end negative is already quite low. While I assume many will argue that the “economic events”, wars, and geopolitics of 2022 will cause prolonged negativity, there are other data points that suggest the downside remains a low probability event. Every year there are talking points indicating recessions, and every year a part of the market prepares for a bear market. But, as the following data collection shows, the key issue of Fed hikes have done little to stop the upward track of the market.
Data
The 70s are known for having extensive periods of high inflation, and the effective rates reached the 20s percentile range. However, the rates were extremely volatile and not equatable to modern policy in my opinion. After the early-80s recession, FFER policy became more controlled. The first period of rising rates occurred beginning in early 1983, with the peak occurring in the fall of 1984. This hawkish period did not cause a recession, but let’s look at generalized 1-year returns before and after the six months leading up to the peak.
April 1st, 1984
-
S&P 500 rose 3% over the year leading up to the date.
-
Rose 13.6% the following year.
June 1st, 1984
-
Prior year: -5.9%
-
Post Year: 22.7%
August 1st, 1984
-
Prior year: -2.5%
-
Post Year: 21.2%
Average Prior: -1.8%
Average Subsequent: 19.2
So far, the data seems to correlate to 2022/23 as the S&P 500 offered poor returns the year prior. If so, investors may be in store for high returns in 2023 approaching 20%. This is also quite contrary to those who may suggest higher interest rates suppress earnings and valuations. However, one time period is not enough to be conclusive so let’s continue looking at other time periods.
The next period of rising rates was from 1988 to 1989. A recession also did not occur until rates had already begun falling by mid 1990. The outlook seems quite poor from this sense, as 2022 investors would be quite upset with waiting for a recession for almost two years. Let’s see if the stock market reflects the prolonged weak economy.
December 1st, 1988
-
Prior year: 17.5%
-
Post Year: 29.3%
February 1st, 1989
-
Prior year: 16.5%
-
Post Year: 11.5%
April 1st, 1989
-
Prior year: 15.7%
-
Post Year: 14.3%
Average Prior: 16.6%
Average Subsequent: 18.4
Interestingly, the period leading up to peak effective rates in 1989 failed to slow down momentum from years prior. The pattern is less similar to December 2022 as trailing performance was very positive. Either way, this is not the doom and gloom that many currently are suggesting in their outlook for 2023. In fact, the 80s through the late 90s was one long, secular bull market, and interest rates did little to change that. Perhaps a similar trend is continuing, and I would recommend the secular demographics theory for those interested. For now, let’s continue compiling the data.
The next period of rising rates came in 1994 as the Fed increased from 3% to 6%. Again, no recession is recorded in the years before or after this rising rate period. One difference to consider compared to other time periods so far is the fact that at the peak, rates plateaued rather than fell and perhaps this will be an influence on S&P 500 returns.
December 1st, 1994
-
Prior Year: -2.8%
-
Subsequent Year: 35.2%
February 1st, 1995
-
Prior Year: -1.9
-
Subsequent Year: 35.7%
April 1st, 1995
-
Prior Year: 14.3
-
Subsequent Year: 30.3%
Average Prior: 3.2%
Average Subsequent: 33.7
Unfortunately for bears, the data again is positive for the year following a peak in the FFER. The data is also more similar to 2022 with negative to flat returns in the year prior to the identified period. I also notice that returns in the subsequent period have all been above the historical S&P 500 average of between 9-10% per year. Perhaps the post-inflation period of the 80s and 90s is not a valid period of comparison for today, so let’s move more recent.
One of the most famous times of rising interest rates came with the Dot-Com Crisis of the late 90s and early 2000s. Starting in 1999, rates began to rise from a relatively high floor of the upper 4%s. The peak then occurred by the summer of 2000 around 6.5%. This time, most investors know that the market took a hit after the crash, and there was a recession soon after. The problem is whether the timing of the peak coincides with the crash in the market.
January 1st, 2000
-
Prior Year: 18.5%
-
Subsequent Year: -11.8
March 1st, 2000
-
Prior Year: 11.6%
-
Subsequent Year: -10.0%
May 1st, 2000
-
Prior Year: 8.4%
-
Subsequent Year: -13.7
Average Prior: 12.8%
Average Subsequent: -11.8%
The data now begins to show a shift in performance following rate hikes. After the tremendous 20 year bull market, there was bound to be a reset. But, this only resulted in around a 12% drop in price. Considering that the S&P 500 is already down 20% from highs, the downside over the next year seems limited, if at all. We must consider all scenarios though, and the next scenario is quite impressive: the Great Financial Crisis.
After an impressive run after the Dot Com Crash, the Fed slowly increased rates from 1% to 5% between 2004 and 2006. The peak came in Summer 2000, and this event was the first period of the measured, step-like interest hikes that are now common and may be influential. Another key point of the hikes through 2006 is that they plateaued until 2007 before declining rapidly with the recession. As such, the decline may not be priced in during the subsequent year.
March 1st, 2006
-
Prior Year: 6.7%
-
Subsequent Year: 8.67%
May 1st, 2006
-
Prior Year: 12.3%
-
Subsequent Year: 13.9%
July 1st, 2006
-
Prior Year: 7.2%
-
Subsequent Year: 18.7%
Average Prior: 8.7%
Average Subsequent: 13.8
As you can see, peaking rates are again not an issue. However, unlike years prior, there was also strong momentum leading up to the event. This prevents the data from being fully reflective of the market’s current trading pattern. It is also possible that the market’s recession-based suffering may be prolonged longer than a year from now, and this would mean the downside would come in 2024.
The last period I will look at is the first occasion of rising federal funds effective rates after the 08 recession. From nearly 0% rates between 2008 and 2016, the Fed ramped up the percent to 2.5% over the course of five years. Far different than our current rapid climb above 4% in just nine months. However, rates fell relatively fast by late 2019 and before the pandemic caused extremely loose monetary policy. Let’s see if the data fits in before the pandemic black swan event disrupts the general balance of policy.
September 1, 2018
-
Prior Year: 17.0%
-
Subsequent Year: 0.33%
November 1, 2018
-
Prior Year: 6.24%
-
Subsequent Year: 11.9%
January 1st, 2019
-
Prior Year: -6.9%
-
Subsequent Year: 29.7%
Average Prior: 5.5%
Average Subsequent: 14.0%
Analysis
Interestingly, the data is a mixed bag on this occasion, highlighting volatility during the period. While the rate hikes did not lead to downside, for some periods, the upside was negligible. On the other hand, the years prior were also variable with a generally bullish trend throughout. Certainly not a crash, at least until the pandemic. With all the time periods out of the way, it is time to analyze the data.
First, I averaged the returns across all time points and the results show that during the periods heading into and after a peak in the Federal Funds Effective Rate, total S&P 500 returns were positive. The subsequent period saw the highest likelihood of positive returns, and the average 14.6% 1-year return is quite high. This suggests that 2023 will in turn end positive as it is only 12 months away. Of course, the data is highly volatile due to daily swings in price and minor news.
One problem that arises is that 2022 has not performed similarly to the time periods reflected in the data. To date, the morning of December 22, the S&P 500 index is down 18%, and 20.5% year-to-date. This negative performance may indicate a different future return, so I also calculated the average return of all prior periods that had negative returns. This represented 5 out of 15 occasions, or a third of the historical data. Although, the difference in return is significant as the average loss during the negative prior periods was only 4.0%. At the same time, total returns in the subsequent year were far above average and almost 30% on average. Clearly, poor years in the market often led to swift rebounds.
Another way one can look at the data is that recent policy shifts have had a different effect on the returns for the market over subsequent time periods. This means that investors are now pricing in the effects of Fed policy to a different degree than in years prior. To determine if this is the case, I averaged the returns for the three most recent periods: Sept-Jan 2019-20, March-July 2006, and Jan-May 2000. Now, we have data that may suggest the upside for 2023 may be limited to a degree. In fact, the average subsequent return of 5.3% is half the historical S&P 500 average.
| Data Set |
Prior Period |
Subsequent Period |
|
Average Return: All Periods (%) |
5.1 |
14.6 |
|
Average Return: Periods With Negative Prior Returns |
-4.0 |
28.9 |
|
Average Return: Three Prior Rate Hike Periods (%) |
9.0 |
5.3 |
Another indicator we can analyze is the relation between earnings growth and valuation for next year. While I believe earnings momentum can be maintained through the year, the respective valuation the market allows may be different. When looking at the same time periods above, the Shiller PE ratio trended upwards in the first three cases, downwards during the Dot-com Crisis, and flat during the lead ups to the financial crisis and pandemic.
Again, I could adjust the data for valuation, but the total returns take into consideration both valuation and growth. With both valuation and earnings growth moving in a positive direction thanks to inertia from 2021, and a bounce off lows seen in 2022, the positive return expectations above seem realistic.
Discussion
If this data reflects the correct influences on the market due to rising and then peaking interest rates, the average return of 14.6% would lead the S&P 500 to end at 4,354, assuming January starts out at 3,800. Interestingly enough, this is still less than the trading levels of 2021 and the first three months of 2022. I feel quite confident in that number as it both implies some rebound momentum, but adjusts for the high valuations seen in 2021.
Remember, 4,354 in 12 months is far different than 4,354 in a month or two. There is no data to suggest that the next twelve months will have purely upward linear growth. Also, if adjusted for the other average return data sets, we will find the S&P 500 will range from 4,001 to new all-time-highs of 4,898. With all three averages combined equally, the S&P 500 may end at 4,418. Either way, the data suggests that the upward growth momentum of S&P 500 constituents will be enough to support these prices despite shifting sentiment. There are some caveats to consider:
-
The expected low range may become more likely if negative geopolitical sentiment with Russia and China increases.
-
The high range may be more possible if company growth rates remain strong despite the higher rates.
-
The constituents of the S&P 500 change frequently, with the shift towards info tech the main disruption. As a result, a higher growth rate and valuation are viable. If energy markets remain strong, we can also see Energy holdings continue outperforming.
-
This data is valuation agnostic, but long-term downward trends in the S&P 500 P/E average may result in further downside momentum (this applies if the market believes rates will continue to rise beyond 5-6%). More on this later.
I am sure more data-driven investors can shift the weightings of each average according to differing probabilities and come to more tailored expectations, but I believe using the broader average is a more bias-free approach. One issue that may change the thesis is the fact that this research assumes the rates will peak sometime in the next six months, rather than later on in the year. However, the longer the Fed holds off, the stronger the economy, and the higher likelihood that the returns beat expectations.
Working backwards from my return estimates, it can be assumed that earnings growth can go one of three ways:
-
Positive growth of 14.6% with no change in Shiller P/E from 29.7 as of December 22.
-
Less growth between 0 and 14%, but with a corresponding rise in Shiller P/E that is supported by historical trends.
-
Or, fast earnings growth above 15% but with a continued decline in Shiller P/E to offset the gains.
The most viable option in my eyes is less growth with a rising P/E. With inflation remaining an issue, but some areas seeing a pullback in demand, FactSet has listed analyst expectations for earnings growth in CY 2023 to be 5.5%. The positive growth rate is below average, but far from the recessionary doom and gloom investors have priced in over the past few months. This will allow for a return of positive sentiment for the Shiller P/E to rise 9% to approximately 32.4, or around 23x for a normal P/E.
As such, the normal ratio would remain below other periods such as 2016-18, the late 90s and early 2000s, and even the early 90s. These are all periods that have been reflected in the data I have accumulated. Again, the total return averages paint a very clear, and supported, expectation for growth for the year, and I will allow the data to drive my strategies.
Conclusion
For now, I will stick with my estimate of the S&P 500 Index ending at 4,354, give or take 100 points for volatility. This would account for an approximate SPY (SPY) price of $433, or VOO (VOO) of $398.
I prefer to take a data driven approach as timing the market is difficult. Over the next twelve months, I would take advantage of the positive growth expectation by adding on drawdowns. Of course, this is all purely speculation as well. I will always be an advocate of recurring investments, but the data is quite positive for a 1-year trading opportunity.
Remember, these are only 12 month expectations, and it is clear from the time periods I look at that it may be important to trim holdings soon after. For now though, I believe a continued upward trend is likely. I look forward to seeing how the year pans out.
If you have the time, feel free to adjust the data I have presented with your own weightings and expectations and share them in the comments. Also, share your thoughts on whether you agree with my positivity! I am sure there are many angles to take and approach the year ahead.
Thanks for reading.
Editor’s Note: This article was submitted as part of Seeking Alpha’s 2023 Market Prediction contest. Do you have a conviction view for the S&P 500 next year? If so, click here to find out more and submit your article today!
Be the first to comment