

tdub303
2Q22 GAAP earnings dropped from record highs in 1Q22 and are now lower than Core Earnings[1] for the first time since 1Q21. All eleven sectors saw a year-over-year rise in Core Earnings through the trailing-twelve months (TTM) ended 2Q22, just as they did in 1Q22.
Generally Accepted Accounting Distortions
GAAP Earnings for the S&P 500 understated Core Earnings for the first time since 1Q21. The steeper decline in GAAP Earnings relative to Core Earnings follows the pattern observed in the quarters leading up to the Great Recession.
GAAP Earnings rose slower over the last year, at 19%, compared to 26% for Core Earnings. Since 2020, true corporate profits have been much less volatile than indicated by GAAP earnings. For instance:
- In 2020, GAAP earnings fell 30% YoY compared to an 18% fall for Core Earnings.
- In 2021, GAAP earnings rose 108% YoY compared to a 62% rise for Core Earnings.
- In the TTM ended 2Q22, GAAP earnings rose 19% YoY compared to a 26% rise for Core Earnings.
Figure 1: S&P 500 Core Earnings Vs. GAAP Earnings YoY Percent Change: 1Q20 – 2Q22
Core Vs GAAP Earnings S&P 500 2Q22 (New Constructs, LLC)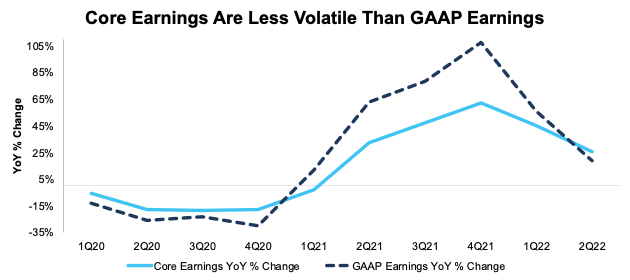
Our Core Earnings analysis is based on aggregated TTM data for the sector constituents in each measurement period. The August 12, 2022 measurement period incorporates the financial data from calendar 2Q22 10-Q, as this is the earliest date for which all the calendar 2Q22 10-Qs for the S&P 500 constituents were available.
More Than Half the S&P 500 (by Market Cap) Have Overstated GAAP Earnings[2]
Forty percent, or 201, of the companies in the S&P 500 report GAAP Earnings that overstate Core Earnings for the TTM ended 2Q22.
When GAAP Earnings overstate Core Earnings they do so by an average of 26%, per Figure 3. The overstatement was greater than ten percent for 18% of companies. For comparison, in the TTM ended 2Q21 the percent of companies that overstate Core Earnings was 42%.
Figure 2: S&P 500 GAAP Earnings Overstated by 26% On Average
Overstated GAAP Earnings in S&P 500 2Q22 (New Constructs, LLC)
We use Funds from Operations (FFO) for Real Estate companies rather than GAAP Earnings.
The 201 companies with overstated GAAP earnings make up 51% of the market cap of the S&P 500, which is down from 55% in 1Q22 and 54% in 2Q21.
Figure 3: Overstated Earnings as % of Market Cap: 2012 through 8/12/22
Overstated S&P 500 Earnings by Market Cap (New Constructs, LLC)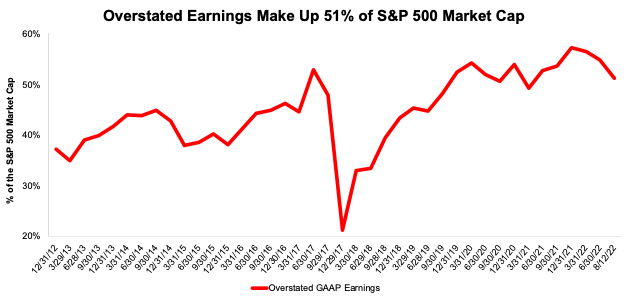
Key Details on Select S&P 500 Sectors
All eleven sectors saw a year-over-year rise in Core Earnings through the trailing-twelve months (TTM) ended 2Q22, just as they did in 1Q22.
The Energy sector saw the largest YoY improvement, $146.2 billion, in Core Earnings, which rose from $14.5 billion in 2Q21 to $160.7 billion in 2Q22.
The Technology sector generates the most Core Earnings of any sector and grew Core Earnings by 15% YoY in 2Q22. On the flip side, the Real Estate sector has the lowest Core Earnings, and the Consumer Non-cyclicals sector had the weakest YoY growth in 2Q22.
Below we highlight the Consumer Cyclicals sector and a stock with some of the most Earnings Distortion (i.e., overstated GAAP earnings) in the sector.
Sample Sector Analysis: Consumer Cyclicals Sector
Figure 4 shows Core Earnings for the Consumer Cyclicals sector, at $157.3 billion, rose 7% YoY in 2Q22, while GAAP earnings, at $160.3 billion, rose 10% over the same time.
Figure 4: Consumer Cyclicals Core Earnings Vs. GAAP: 2004 – 2Q22
S&P 500 Consumer Cyclicals Core Vs. GAAP Earnings (New Constructs, LLC)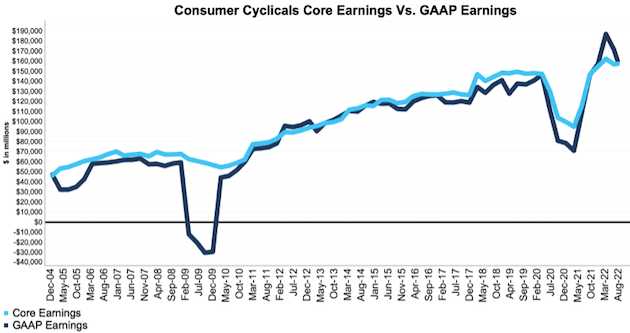
Our Core Earnings analysis is based on aggregated TTM data for the sector constituents in each measurement period. The August 12, 2022 measurement period incorporates the financial data from calendar 2Q22 10-Q, as this is the earliest date for which all the calendar 2Q22 10-Qs for the S&P 500 constituents were available.
GAAP Earnings Overstatement Details: MGM Resorts International (MGM)
Below, we detail the hidden and reported unusual items that GAAP Earnings miss but that we capture in Core Earnings for MGM Resorts International. After adjusting for unusual items, we find that MGM Resorts’ Core Earnings of $297 million, or $0.65/share are much worse than reported GAAP Earnings of $3.2 billion, or $7.01/share.
Below, we detail the differences between Core Earnings and GAAP Earnings so readers can audit our research.
Figure 5: MGM Resorts’ GAAP Earnings to Core Earnings Reconciliation
MGM GAAP to Core Earnings Reconciliation (New Constructs, LLC)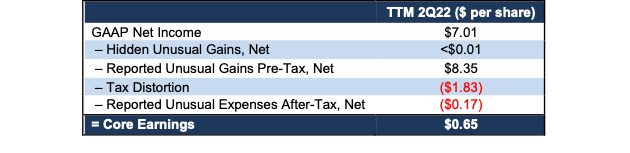
More details:
Total Earnings Distortion of $6.36/share, which equals $2.9 billion, is comprised of the following:
Hidden Unusual Gains, Net = <$0.01/per share, which equals $1.7 million and is comprised of:
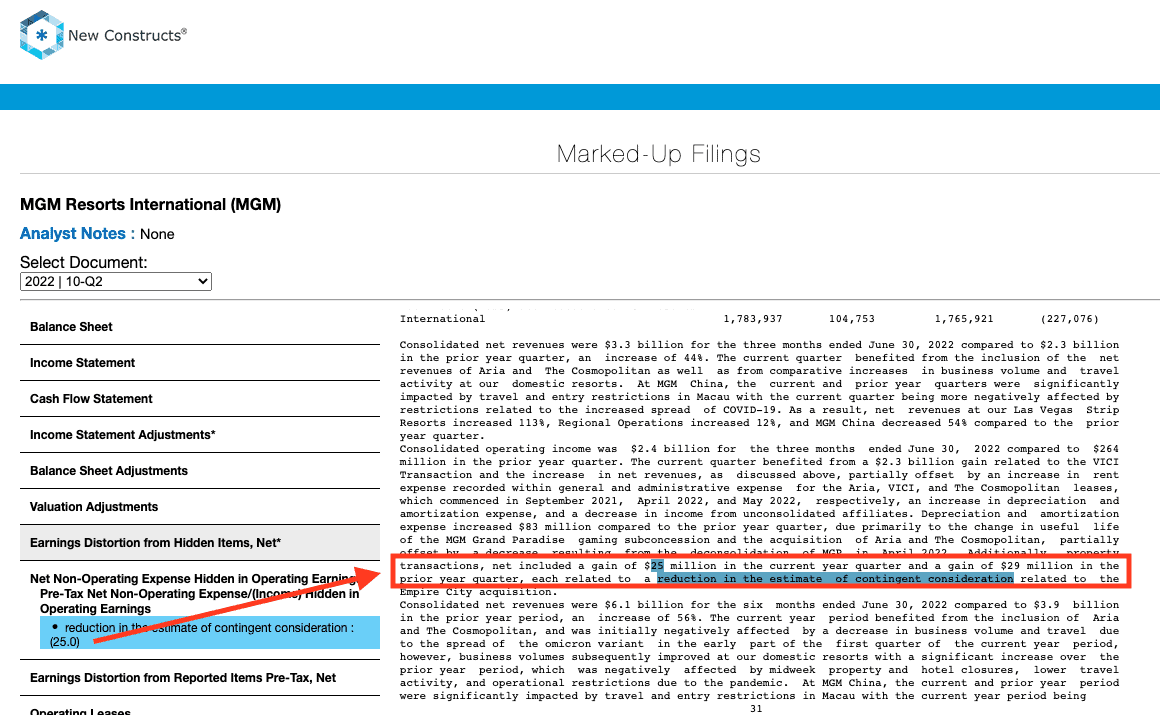
- $25 million gain related to a reduction in the estimate of contingent considerations in 2Q22
- -$23 million in transaction costs in the TTM period based on
Reported Unusual Gains Pre-Tax, Net = $8.35/per share, which equals $3.8 billion and is comprised of:
- -$63 million in other expenses in the TTM period based on
- $3.9 billion in restructuring gains in the TTM period based on
Tax Distortion = -$1.83/per share, which equals -$833 million
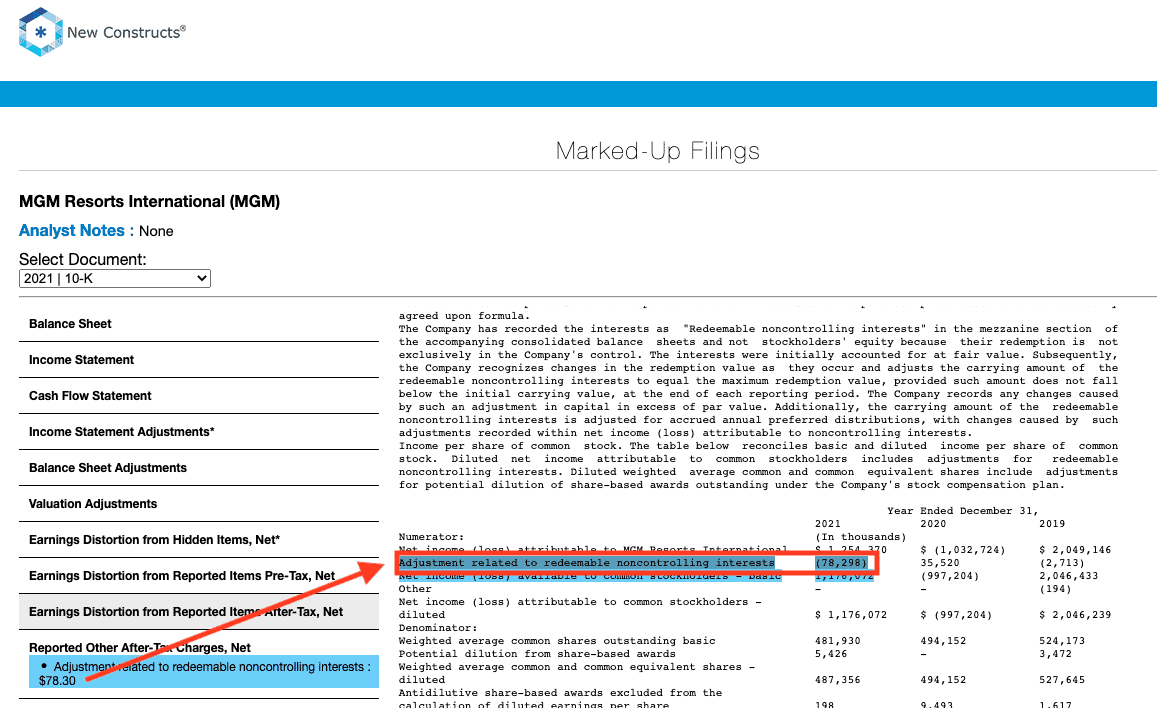
Reported Unusual Expenses After-Tax, Net = -$0.17/per share, which equals -$78.3 million and is comprised of
- -$78 million adjustment related to redeemable noncontrolling interests in 4Q21
This article originally published on August 24, 2022.
Disclosure: David Trainer, Kyle Guske II, Matt Shuler, and Brian Pellegrini receive no compensation to write about any specific stock, style, or theme.
Appendix: Calculation Methodology
We derive the Core Earnings and GAAP Earnings metrics above by summing the Trailing Twelve Month individual S&P 500 constituent values for Core Earnings and GAAP Earnings in each sector for each measurement period. We call this approach the “Aggregate” methodology.
The Aggregate methodology provides a straightforward look at the entire sector, regardless of market cap or index weighting and matches how S&P Global (SPGI) calculates metrics for the S&P 500.
[1] Based on the latest audited financial data, which is the calendar 2Q22 10-Q in most cases. Price data as of 8/12/22.
[2] Overstated companies include all companies with Earnings Distortion >0.1% of GAAP earnings.
Be the first to comment