

Rand Price Outlook:
Sour Sentiment Weighs on the Rand
The South African Rand has continued to falter as the Emerging Market struggles to contain the spread of the second wave of the coronavirus pandemic. Despite the reimplementation of more stringent lockdown measures (implemented on 28 December 2020), the number of cases has continued to rise with the new variant of Covid-19 (linked to SA) increasing the rate of transmission. Although South Africa has now managed to secure a batch of the vaccine, with private medical aids funding a large portion of the cost, the country will likely only receive the vaccine in the second quarter of 2021. The dismal economic outlook weighed on the Emerging Market currency (EM), causing the currency to depreciate against major currency pairs.

Recommended by Tammy Da Costa
Introduction to Forex News Trading
USD/ZAR Technical Analysis
For the past few weeks USD/ZAR price action has moved along with a key Fibonacci retracement drawn from the 2018 low up to the 2020 high. The three month sell-off that ran through mid-December finally found support in the pair around the 14.50 area – which is where the 61.8% retracement of that major move plots. That support held from its appearance on December 18th through to this week’s open. But, as ZAR weakness took over, price action jumped up to the 50% retracement of the same major move, taken from around the 15.43 area; and this has since held the highs for the past couple of days.
However, prices remain above the 55-period Exponential Moving Average while a MACD crossover below the zero line indicates that bullish momentum may prevail with 16.00 being the next big level of interest.
Starts in:
Live now:
Jan 11
( 03:01 GMT )

Join James Stanley’s Price Action Webinar
Cross-Market Weekly Outlook
USD/ZAR Daily Chart
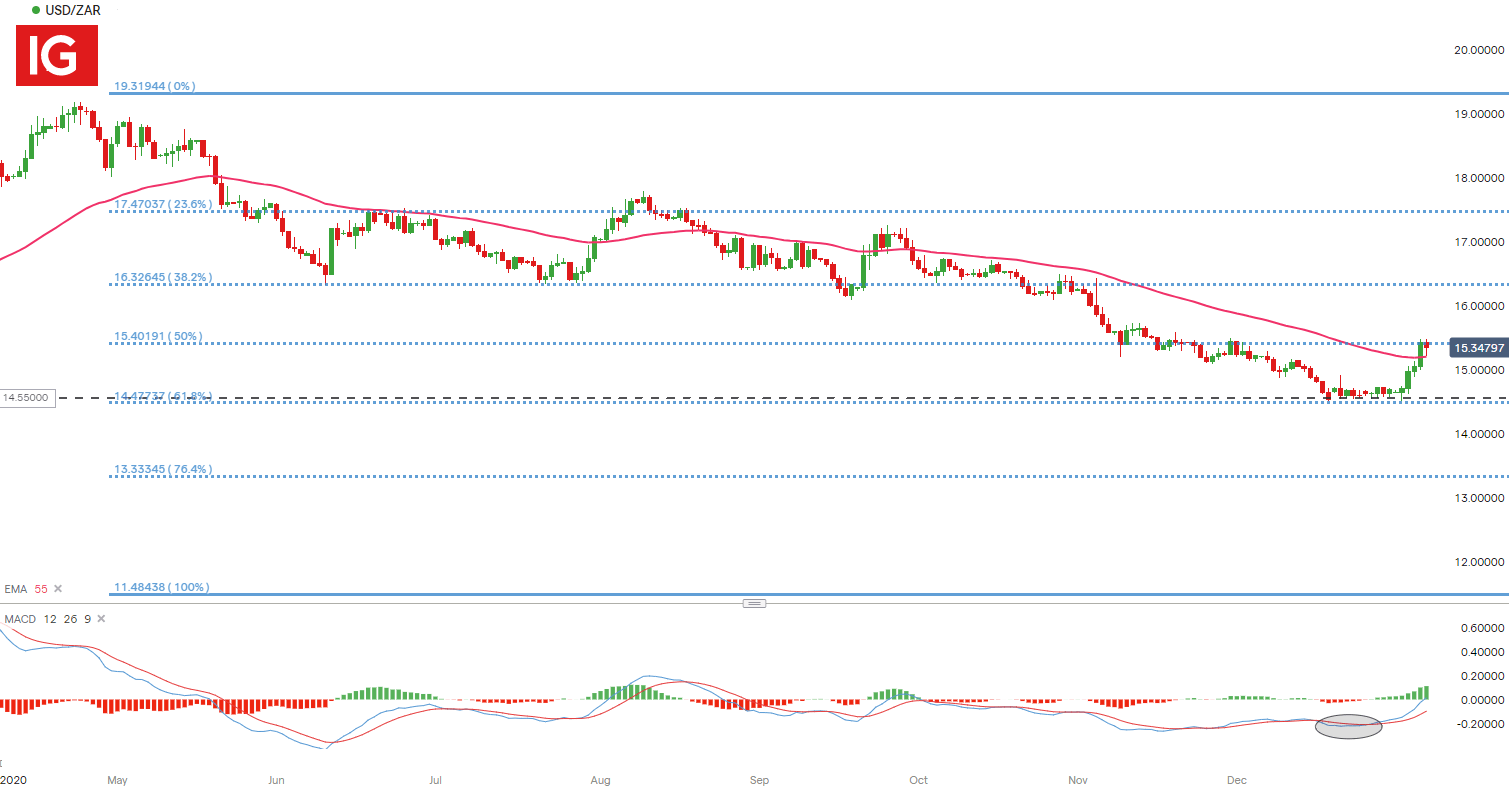
Chart prepared by Tammy Da Costa, IG
GBP/ZAR Technical Analysis
Despite a post-Brexit trade deal fueling the demand for GBP, gains were limited amid increased speculation of further rate cuts by the Bank of England (BOE). This comes after the United Kingdom entered into its third lockdown in an effort to curb the spread of Covid-19, pushing price action into a confluent zone formed by the key Fibonacci retracement levels from the move between December 2019 low and May 2020 high. Meanwhile, price action remained above the 55-period EMA, with the Relative Strength Index (RSI) currently bordering 70, a possible indication that the pair may still be considered overbought. For now, the key psychological level of 21.00 remains as resistance, with the 61.8% Fibonacci retracement level providing support at 20.343.

Recommended by Tammy Da Costa
Can you prepare for news events?
GBP/ZAR Daily Chart
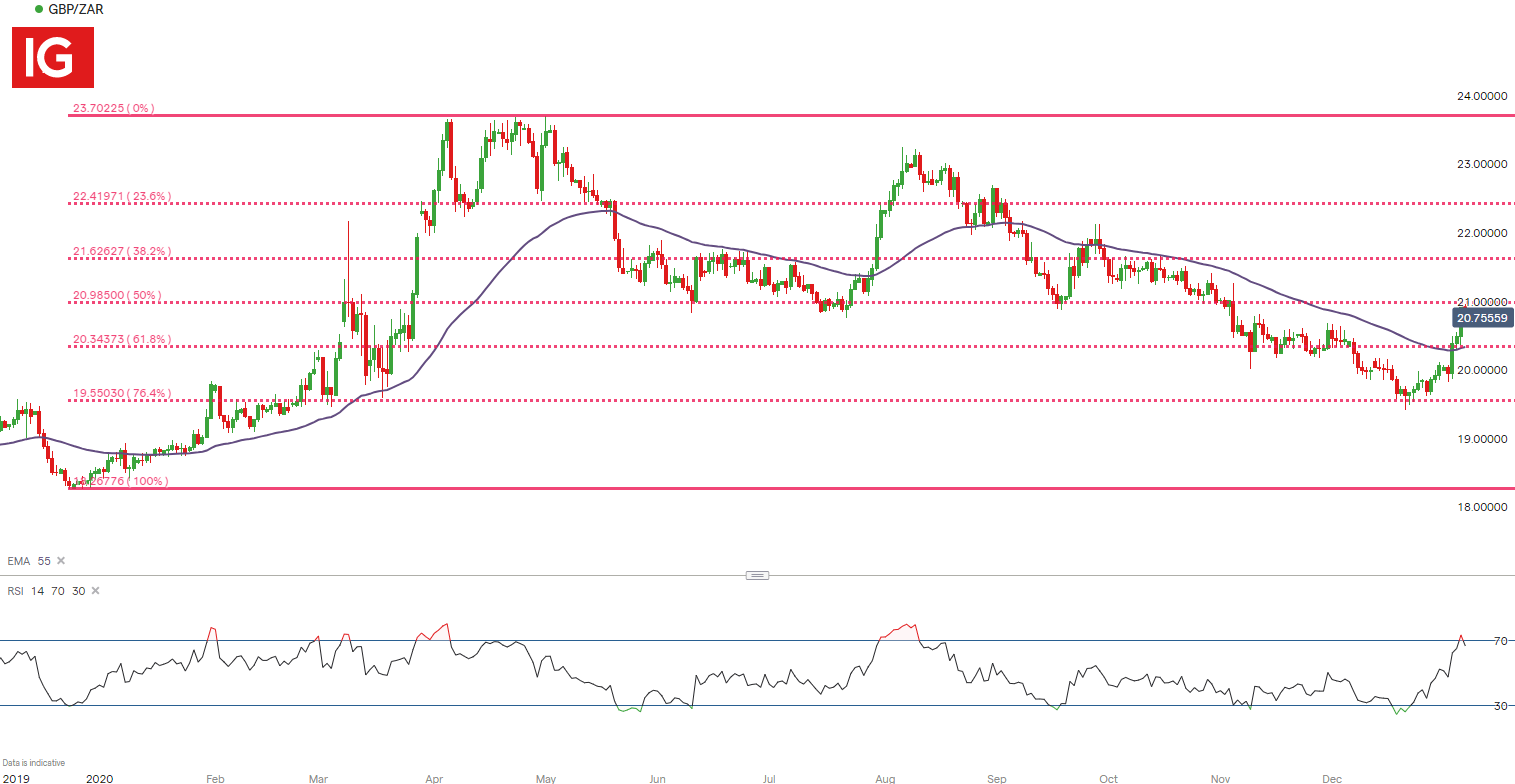
Chart prepared by Tammy Da Costa, IG
EUR/ZAR Technical Analysis
The upward momentum in EUR/ZAR has come to a halt after prices bounced off the wall of resistance formed by the 38.2% retracement level, around 18.916. Much like the pairs discussed above, price action remains above the 55-period EMA, with the RSI resting just below the 70 line. Currently, 19.00 continues to keep bulls at bay while bears look to break below current support, formed by the 50% Fibonacci retracement level at 18.296.
Recommended by Tammy Da Costa
Download our free Euro Forecast
EUR/ZAR Daily Chart
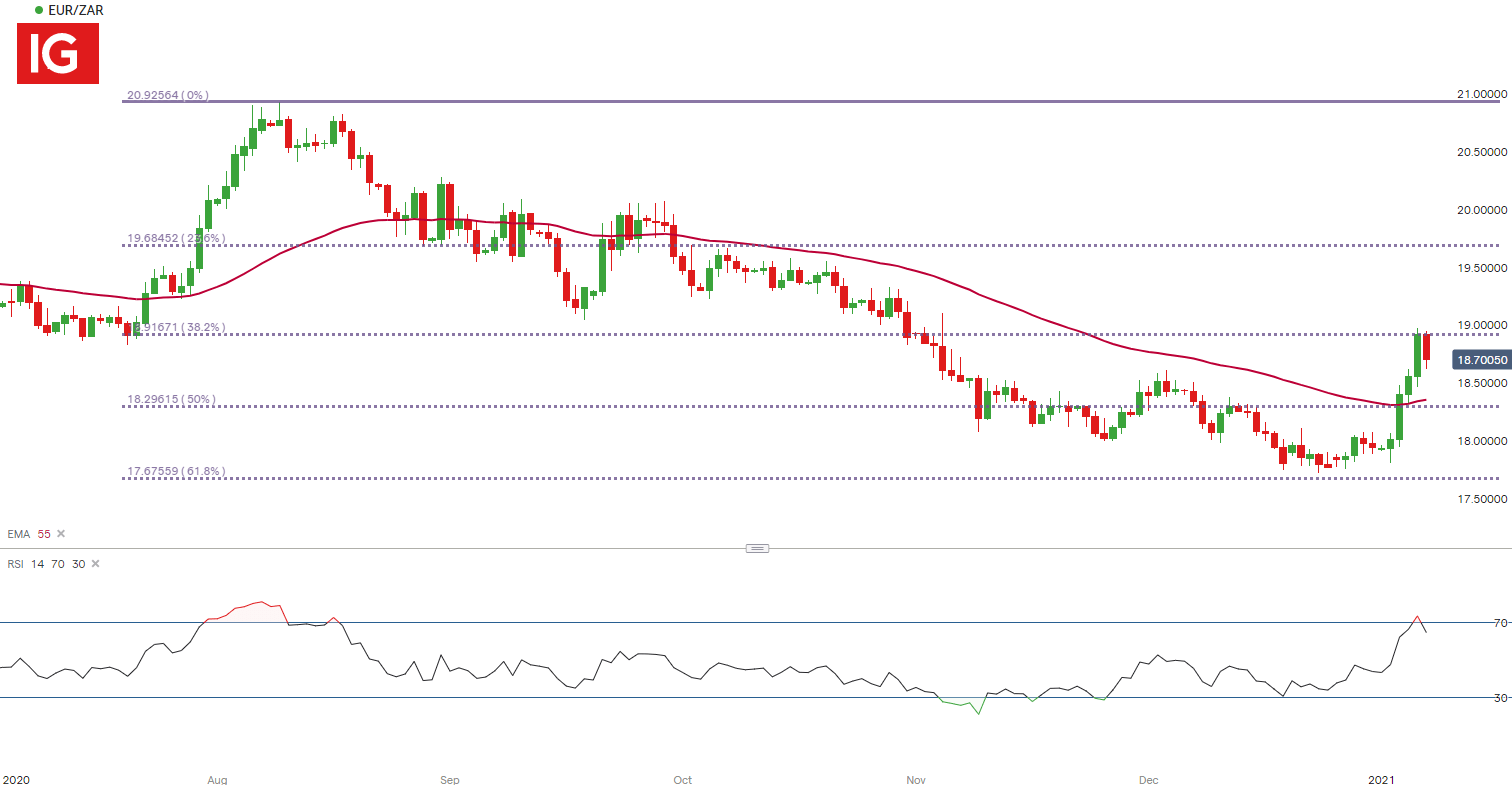
Chart prepared by Tammy Da Costa, IG
— Written by Tammy Da Costa, Market Writer for DailyFX.com
Contact and follow Tammy on Twitter: @Tams707
Be the first to comment