

William_Potter
Thesis
We have looked at a number of 60/40 or 70/30 CEFs as of late, hence we are going to do a re-fresh on Source Capital (NYSE:SOR) and see how the fund is doing and how it benchmarks against the cohort. The 60% equity, 40% bonds portfolio is the result of a classic portfolio build, that advocates for lower volatility by utilizing this asset distribution matrix. In a normalized rates environment when equities sell off, bond yields decrease, hence the relationship does exhibit a set-off. This year has been different, with one of the most negative historical performances for this type of portfolio:
Historic Performance (Compound Capital)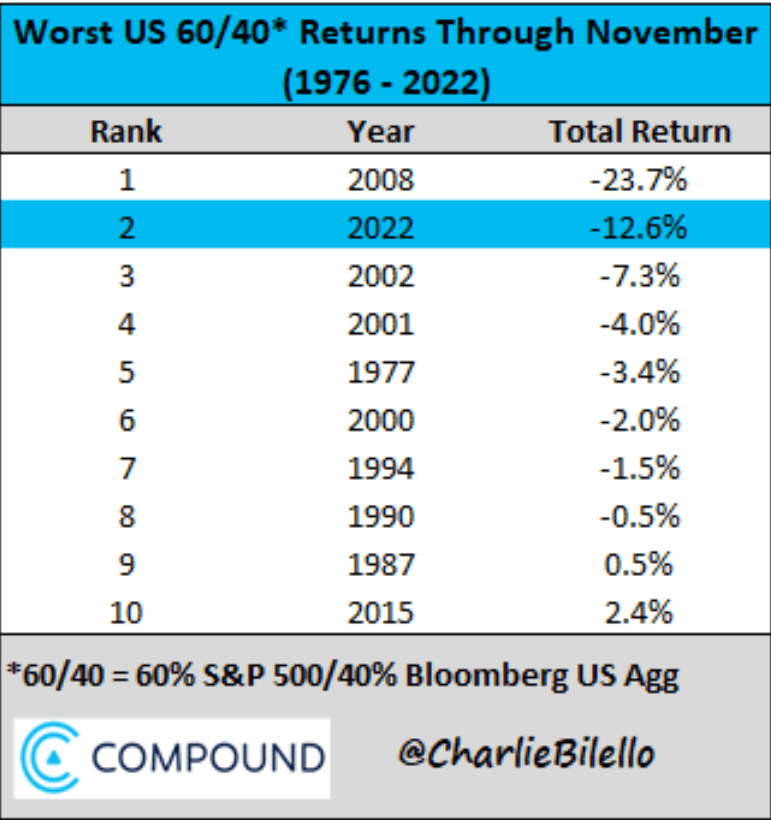
Due to both rising rates and lower equities, the 60/40 portfolio has taken a severe beating. There are many voices questioning the long term viability of this set-up. We do not think the 60/40 portfolio is dead, and with most of the rate hikes now behind us, the market is now starting to price in rate cuts for late 2023 / beginning of 2024.
We have analyzed and reviewed a number of CEFs in this space:
* Clough Global Equity (NYSE:GLQ) which we reviewed here
* Clough Global Dividend and Income Fund (GLV) which we reviewed here
* Thornburg Income Builder Opportunities Trust (TBLD) which we analyzed here
* and the iShares Core Growth Allocation ETF (AOR) which we reviewed here
We are going to summarize them and look at their leverage, risk/reward metrics and performance to gauge the best allocation from the cohort. Ultimately, like in any other instance, the CEF wrapper purely transforms capital markets gains into monthly dividends, so if the CEF structures do not deliver an outperformance or even a matching performance to a plain vanilla index via an ETF, there is no point investing in such instruments.
CEF Comparison (Author)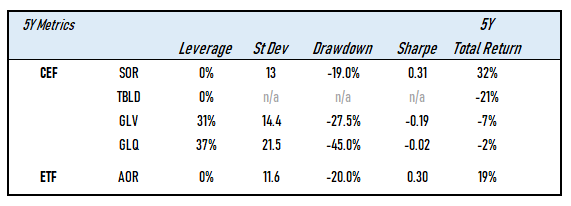
We have parsed out the CEFs vs the ETF in the above table. We can see there are some CEFs with no leverage (such as SOR and TBLD), while the ETF, by its construction has zero leverage. The highest standard deviation is exposed by the most leveraged name, i.e. GLQ. GLQ has the largest drawdown as well, but not the lowest Sharpe ratio. That is reserved for GLV, which we penciled in as a Sell in our most recent article. The highest Sharpe ratio (risk/reward ratio) comes from SOR. So does the largest 5-year total return.
Performance Comparison
On a year to date basis, SOR is the best performing fund:
Total Return (Seeking Alpha)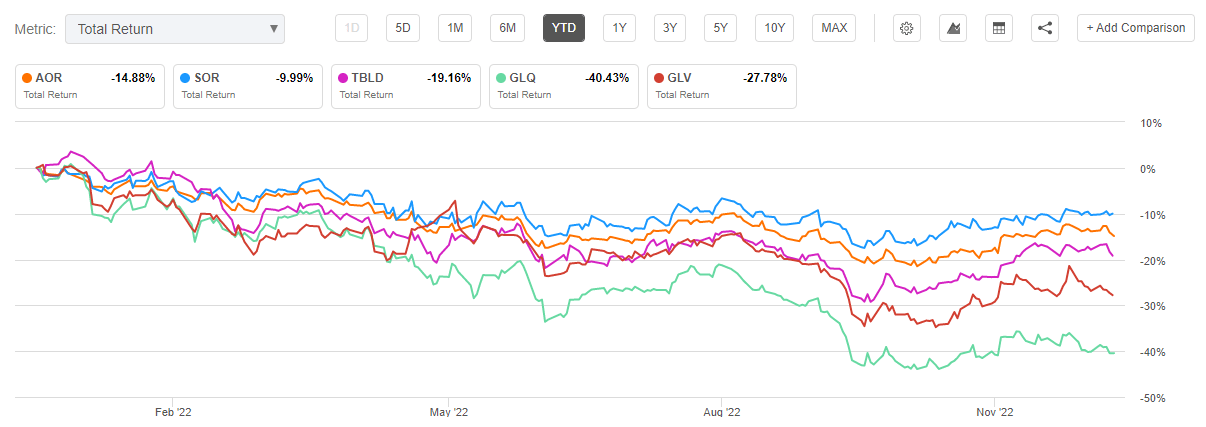
Moreover, SOR has the shallowest drawdown from all of the analyzed vehicles. On the metric observed above, SOR outperforms handily the AOR ETF, which speaks well to the fund.
The story is very similar on a 5-year time frame:
Total Return (Seeking Alpha)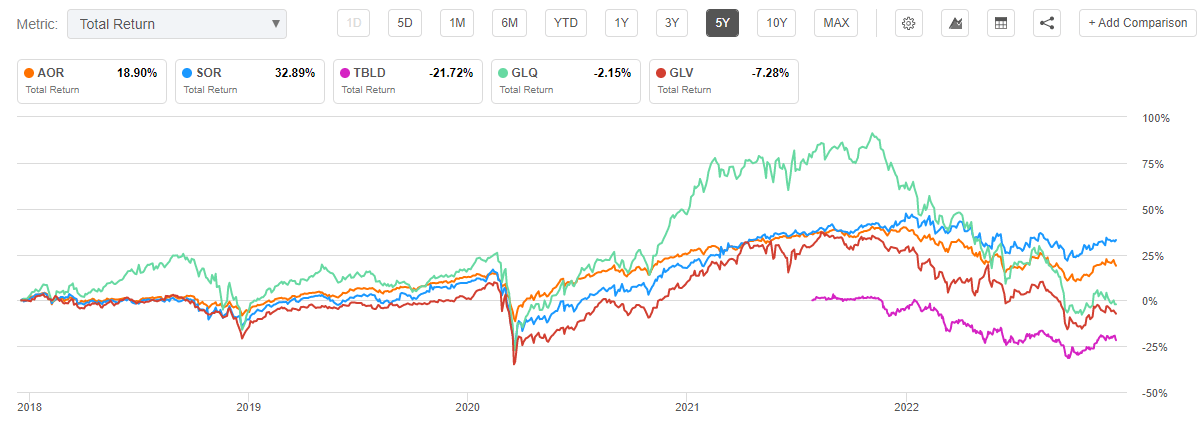
We can see that the most leveraged fund GLQ was the outperformer during the zero rates environment, but due to the market drawdown this year the fund has fallen the most. Leverage helps on the way up, but it really drags you in on the way down.
SOR Holdings
The fund has decreased its equity sleeve as of late:
Allocation (Fund Fact Sheet)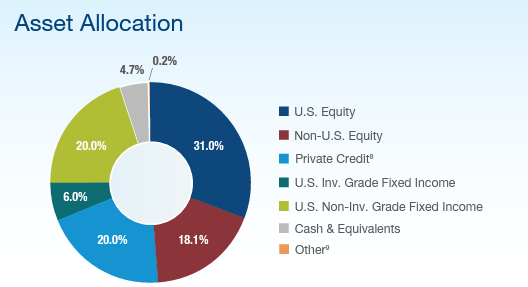
We can see from the above pie chart that the CEF has reduced the equity slice to roughly 50% now (when adding the U.S. Equity and the Non-U.S Equity slices). On the bond side it has an even distribution among Private Credit, IG Credit and Non-IG names.
We like the set-up here because it takes advantage of the CEF structure correctly – i.e., CEFs allow for active management within a broader mandate, and this is exactly what investors should expect from a savvy and active management team. We did not like how some buy-write CEFs completely failed to take advantage this year from the decreasing markets by writing more call options on their portfolios, for example. We are firm believers that the advantage of the CEF structure and the appeal of the vehicle lies in active management and ability to adapt to market cycles. When a risk-off cycle develops, managers should become more risk-averse to their ability. For SOR this means less of an equity allocation.
On the equity side the fund has the following names as its top holdings:
Top Holdings (Fund Fact Sheet)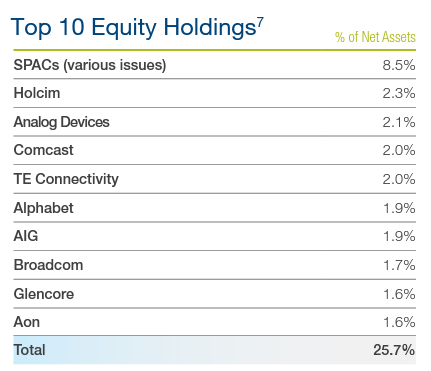
On the bond side the fund is tilted towards BB credits:
Rating Matrix (Fund Fact Sheet)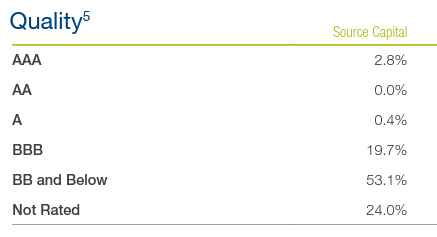
Conclusion
SOR is a 60% equity/40% bonds CEF. The fund benefits from an active and agile management that has recently moved the equity sleeve to only 50% to account for the current bear market. The fund has no leverage, but manages to outperform the entire CEF cohort in the space and the plain vanilla ETF that replicates the index. Despite its dreadful performance in 2022, the 60/40 portfolio is not dead, and we believe the peak in rates has already occurred. The equities markets will be under pressure going into 2023, but we will get back to a negative correlation between stocks and bonds next year. An investor looking at the CEF wrapper in order to extract monthly dividends from a 60/40 portfolio would do well to choose SOR from the analyzed cohort.
Be the first to comment