

YvanDube
Investment Summary
Equity and cross-asset managers are seeking to step up in quality and resiliency to position for the distribution of potential outcomes in the global economy. This increasingly includes prospects of economic recession and/or persistent inflation. Note, the deflationary drivers of the past decade [globalization of supply chains, labour migration, technology, etc.] are starting to diminish, and we are in uncharted waters in the real economy.
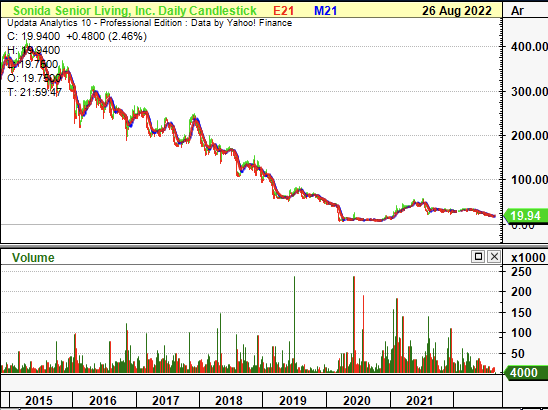
Exhibit 1. SNDA 6-month price action followed by 5-year action
Data: Updata Data: Updata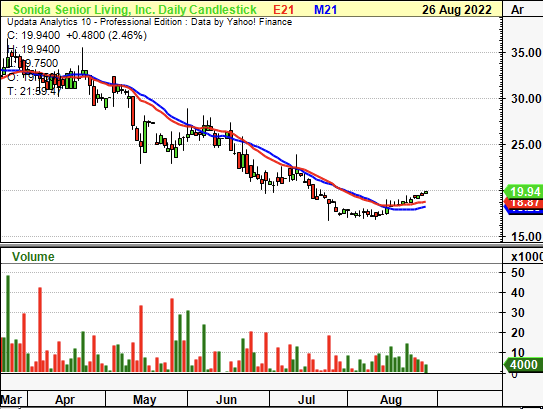
As such, we are considering paying fair value for only the highest quality earnings and equity value that is on offer in the healthcare universe. In that vein, our findings indicate that Sonida Senior Living, Inc. (NYSE:SNDA) displays a loose affinity to this kind of equity premia we are seeking exposure too. Investors are asked to pay ~129x EV/EBITDA for a set of undesirable investment characteristics, when there is ample quality available in other sections of the market. With this in mine, we rate SNDA a hold.
Q2 earnings mixed, but not terrible
Second quarter earnings give unique insights into expected financial performance for FY22. Total revenue came in at $59.6 million, a gain of ~360bps YoY, with the 87% of turnover stemming from resident revenue, up from 81%. Management fees and community reimbursement revenue each narrowed YoY. Meanwhile, OPEX lifted ~10.5% YoY to $41.5 million, and total expenses to $67 million, resulting in an operating loss of ~$8 million.
However, with SNDA it’s all about occupancy, given the bolus of its turnover is acquired from resident revenue. Weighted average occupancy [days occupied divided by total available days] was 83.2% for the quarter – up 510bps YoY, but still ~50bps behind pre-pandemic rates. Unit capacity reduced 20bps to 5,617 and this was offset by a $154,000 YoY gain in average monthly rate.
Exhibit 2. Occupancy trends normalizing back towards pre-pandemic levels
Data: SNDA 10-K August 2022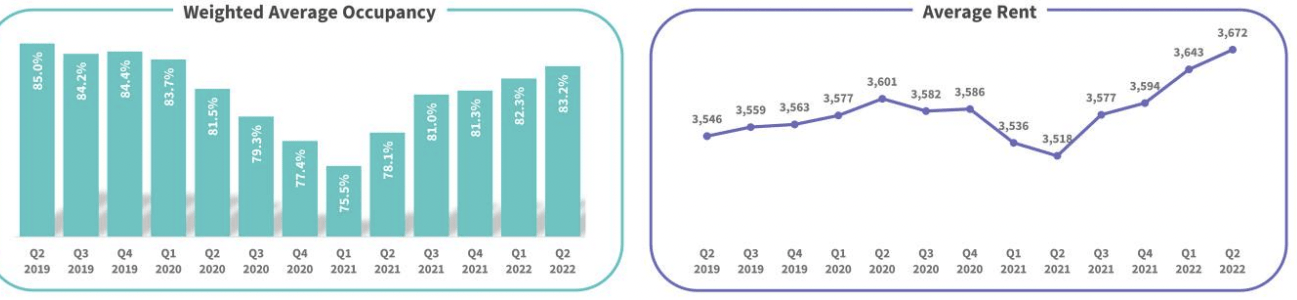
As a result of the momentum in occupancy rates, same-store revenue per available room (“REVPAR”) saw an ~11.5% gain whilst revenue per occupied room (“REVPOR”) gained ~440bps YoY. Each of these gained 200bps and 80bps from Q1 FY22, respectively. Same store NOI therefore gained 204% YoY to $3.4 million, producing a net operating margin of 660bps from 240bps in Q2 FY21. Underpinning these trends was a 41% decrease in contract labour, a step further to management’s goal of completely eliminating contract labour entirely from the portfolio.
Sequential decline in performance
Rate growth is a key driver of corporate profit (measures via EPS) for SNDA and has underpinned earnings growth this YTD. The company believes there’s further capacity to stretch rates even higher in FY22, but we aren’t so sure on the validity of this, particularly on a comparative basis. We are arguably heading into a weaker period of economic growth that’s marred by pressures from inflation and interest rates. Therefore, residential living is at the forefront of the debate, and the pricing environment will become less benign and more competitive as a result, by our estimate. As seen below, NOI margin has tightened since FY19, despite growth trends in resident revenue.
Exhibit 3. Whilst resident revenue has curled up since FY20, NOI margin continues to tighten
This isn’t the kind of combination we’d like to see – ideally, NOI margins remain steady or decompress with higher revenue volumes.
Data: SNDA 10-K August 2022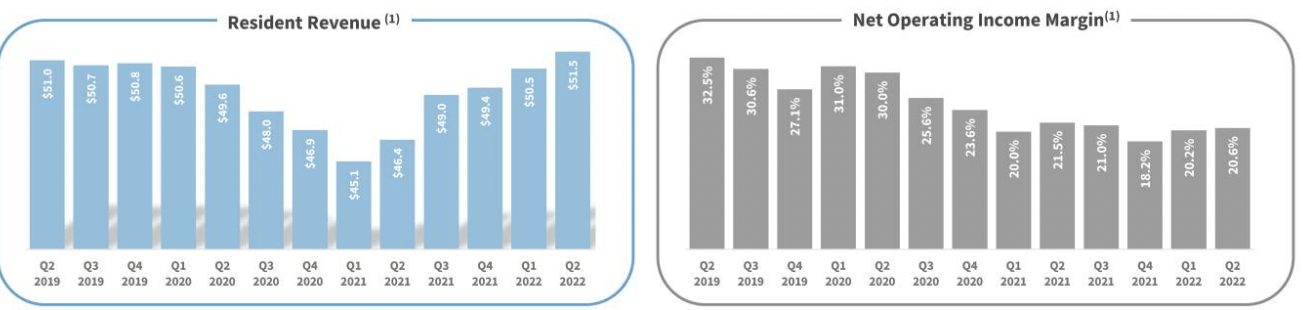
Moreover, as seen in Exhibit 4, GAAP measures of quarterly operating performance has fallen off on a sequential basis since FY17. Vertically down the P&L from revenue down income has narrowed substantially and has with investors now realizing a substantial negative FCF yield. This matches the erosion in shareholder value that’s been exhibited during the same time. Investors are now expected to pay ~4x TTM sales and 129x TTM EV/EBITDA for a series of long-term operating losses, and a $366 million retained deficit (versus retained earnings). This also buys negative working capital of $35 million, ongoing NOPAT losses, a Q2 FY22 FCF loss of $11 million and a negative tangible book value of equity of $69 million.
The loss on FCF and book value would be acceptable and perhaps even preferred if return on investment exceeds the company’s return on investment beat the WACC hurdle, and capital is easily accessible. Here we checked how much NOPAT SNDA generated from the previous period’s invested capital. It also raised ~$155 million for investment into the business last quarter. We also note it has $41.25 million in preferred equity on its balance sheet and debt of $668 million including minority interests.
Exhibit 4. Operating metrics continue to narrow on a sequential basis
Data : HB Insights; SNDA SEC Filings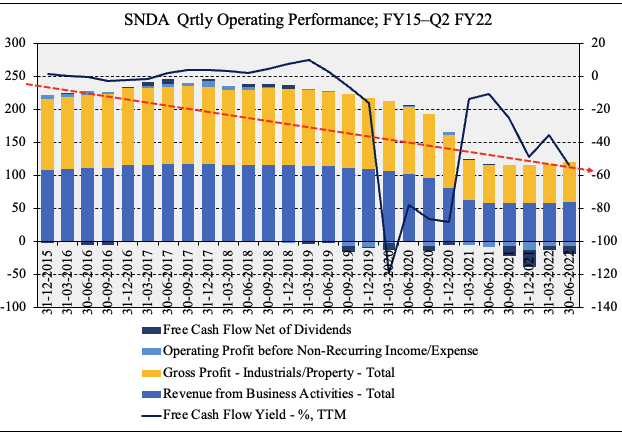
As such, return on invested capital continued its downtrend last quarter and came in at a negative 10bps. These are less than desirable characteristics and paying a relative premium to peers suggests the value proposition mightn’t be worth it with SNDA at this stage. We are seeking exposure to long-term cash compounders who regularly beat the WACC hurdle, and SNDA doesn’t fit the bill here. On this ground in particular we remain neutral on its outlook.
Exhibit 5. Return on investment continues to narrow and fails to justify a negative FCF schedule
Data: HB Insights, SNDA SEC Filings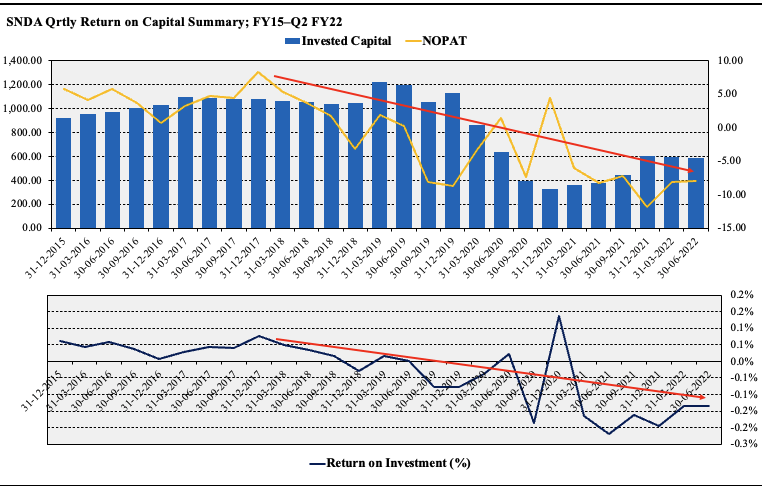
SNDA are nonetheless confident of further rate pass-throughs; per president and CEO, Kimberly Lody on the Q2 earnings call:
“Rate growth has been a positive driver for our business, starting at a lower level earlier in the year and gaining momentum each month with market rate increases and in-place renewals. We believe there is still opportunity to push rates higher in 2022 given positive supply and demand dynamics as well as the tangible value provided by our care teams and resident programs.”
Regarding pricing power and ability to increase costs:
“[W]e’re very optimistic about the pricing power in senior living not only through the rest of this year but into 2023. And the reason for that is multiple items. One is just the ongoing supply-demand. Supply seems to be still — new supply is still a bit limited. So demand is strong..
…two-thirds of our communities above the 85% [occupancy] mark, that gives us additional pricing power when we’ve got higher occupancy in so many of our communities.”
By the way, Lody announced the end of her 8-year tenure with the company, 3.5 of those as CEO. Current COO, M. Ribar will replace Lody as CEO in September.
In short
SNDA’s sequential decline in operating performance since FY17 is unattractive and demonstrates numerous challenges for the company in our estimate. We argue there is no valuation that can be prescribed to the stock in order to justify its inclusion into equity investors seeking to step up in quality and resiliency. With a loose affinity to the equity premia investors are paying a premium for in FY22, plus evidence throughout this report, we rate SNDA a hold.
Be the first to comment