

shapecharge/E+ via Getty Images
Investment Summary
There’s plenty of beaten down names in the large-cap medtech and health care equipment universe that offers compelling long-term value. Whilst this is the case, there’s still the ongoing debate of valuation, and just how exactly to prescribe corporate value. Fundamentals matter and investors have finally begun to realize this once more. With that there’s no question in analyzing Smith & Nephew plc (NYSE:SNN) to see if it’s extended down-leg of 2022 has led to an alpha opportunity. I’ve covered the company at lengths some time ago here, however since then the market has continued to punish the stock amid a flurry of headwinds, including contracting growth and heavy forex headwinds. Net-net, I rate the stock neutral on a $20.70 per share valuation.
Fundamentals Deep Dive
Semi-annual operating trends have remained seasonal to date for SNN, as seen in Exhibit 1. The company has recognized a cycle of upsides and downsides on a rolling basis from FY-date, however these patterns have tightened since FY20. Growth of free cash flow (“FCF”) has also contracted during this time and will serve as a benchmark to gauge the company’s return on investment against later in this report.
Meanwhile, semiannual operating profit has remained flat YoY at $392 million (“mm”), however the cash backing this income has been lumpy, as seen below. As a result realized FCF yields have followed suit in this cyclical fashion. Overall, investors have seen the realized level of FCF yield contract from FY17 high’s, however there hasn’t been a corresponding uptick in operating income as a result of the increased FCF ‘spend’. FCF tightened to $155mm last period and was down on historical averages, coming in at 5.9% of turnover, coming in below the 3-year semiannual average of 12%.
Exhibit 1. Operating trends have remained cyclical yet tightened since the onset of the pandemic
Note: All figures in $mm or %. (Image: HB Insights. Data: HB Insights, SNN SEC Filings)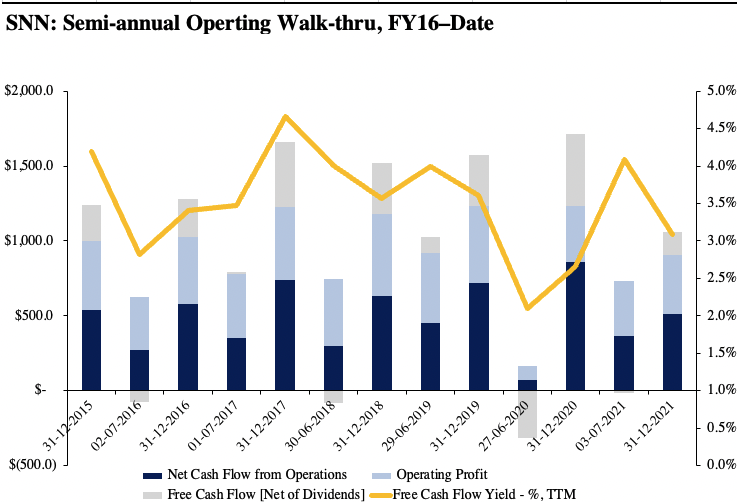
Turning to the latest half, SNN saw top-line growth of 350bps YoY to $2.6 Billion, however this was flat YoY when baking in forex headwinds experienced throughout the year, as seen in Exhibit 2. Moving down the P&L, gross margin came in ~30bps higher YoY at 70.9% as a result of management’s hedging strategy employed earlier in the period. Meanwhile, SNN’s trading margin tightened by ~70bps YoY to 16.9% as a result of inflationary pressures felt across the broad sector.
It bought this down to earnings of $0.38, a 200bps YoY decline, bringing the 3-year normalized EPS to $0.46 – below the company’s FY21 result of $0.57 per share. It also maintained its semiannual dividend of $0.46 per share, although I do not discuss this here in this report.
As seen in the chart below, strength of the USD was a meaningful headwind across all segments for the company last period. In total there was an average 4.3% decline to all operating segments when factoring in forex adjustments for the period. This more than offset the company’s non-GAAP reported YoY growth of 120bps. In addition there was a working capital outflow of $304mm, whereas the company recognized an overall 80bps YoY loss when factoring in all forex adjustments.
Exhibit 2. SNN YoY segment performance and corresponding forex adjustment[s].
Image: HB Insights. Data: HB Insights, SNN 6-K [Half Yearly Accounts].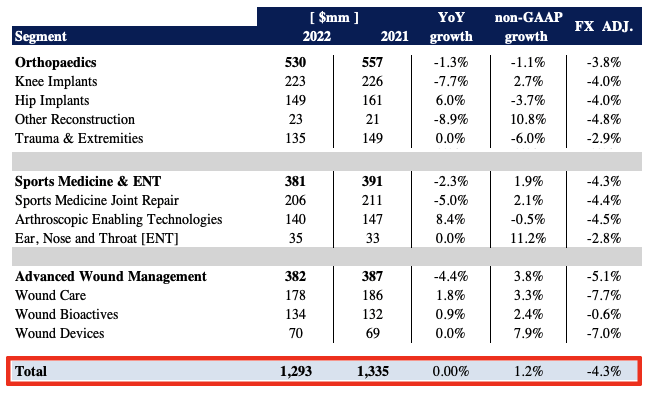
With SNN’s earnings pile sorted I wanted to examine how it’s been investing its cash and what kind of return it’s been seeing. I examined how much NOPAT it is generating from the previous period’s invested capital. A declining and/or negative FCF position is favourable to me if I’m seeing this come through in return on capital.
However, as seen in Exhibit 3, SNN’s FCF and return on invested (“ROIC”) track each other with striking similarity from FY15 to date on a sequential basis. Each have trended down since high’s in FY19 and haven’t recovered to this point since, with TTM ROIC coming in at c.4% in the last earnings print, below the WACC hurdle of 6%. This continues the downtrend in return on investment and I’d be looking for these numbers to recover to the upside as a catalyst to move the share price.
Exhibit 3. Return on investment trends accompanying free cash flow and NOPAT since FY18.
Note: All figures in $mm or %. All calculations are made from GAAP earnings with no reconciliations. Free cash flow calculated net of dividends on sequential basis. (Image: HB Insights. Data: HB Insights, SNN SEC Filings)
This does, however, open up an interesting debate in the SNN investment case. Whilst the aggregate level of ROIC has tightened to record-low levels, and fails to cover the cost of capital, as seen in Exhibit 4, there’s now a divergence in the SNN market cap to the level of ROIC we are receiving, if buying the stock. Meanwhile, from the data, return on capital had been a positive driver of market value for SNN up until FY20.
With shares in the company trading at the lowest prices in years, the question becomes if this creates an opportunity for SNN’s market cap to mean revert to the upside with the pull-through from ROIC. There needs to be some analysis of the market’s psychology behind the stock in order to ascertain this information, as to the distribution of pricing evolution for SNN looking ahead.
Exhibit 4. Question turns to whether SNN will re-rate to the upside when looking ahead.
- Return on investment previously a positive driver of equity returns for SNN up until FY19’/20′.
- First time trading beneath ROIC as seen below.
Data: HB Insights, SNN SEC Filings
Technical factors
In order to gauge what the market’s thinking is around the stock refer to the following series of charts. I wanted to gain an objective insight into price action without the noise of time. As seen in Exhibit 5, the point and figure chart does just that and it’s showing various downside targets clustered in the $17-$20 range. This is coupled with numerous inner and outer resistance lines that SNN must push through in order to reclaim bullish momentum. Price action appears bearish from this chart in my estimate.
Exhibit 5. Multiple downside targets with inner and outer resistance lines
Data: Updata Analytics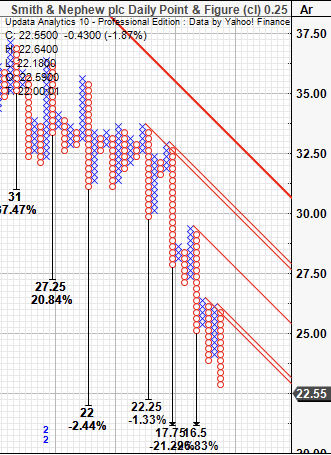
Furthermore, on the 6 month daily cloud chart, shares are trading well below the cloud with the lag line trailing at greater distance. Price distribution is drifting away from cloud support and this further confirms that price action is bearish in my estimation. Long-term trend indicators in momentum and on-balance volume display a continued downtrend with momentum in particular signalling heavy selling activity up until today’s session. Again, this corroborates that price action is not bullish at all.
Exhibit 6. Trading well below cloud support
Data: Updata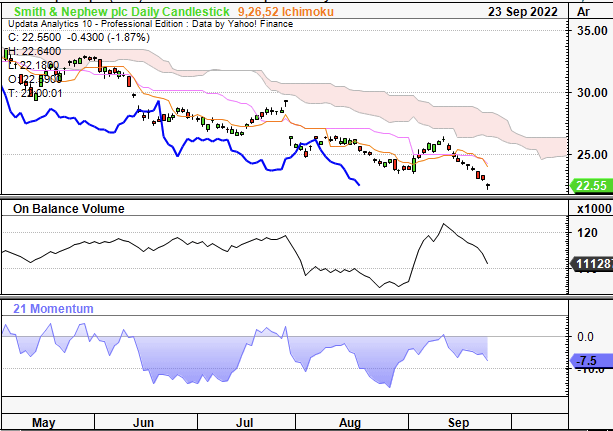
Extending the analysis out to a wider time frame shows some curious results. The $35 mark appears to be a key long-term level of support/resistance for SNN, as seen below, where it had held range for ~16 months in FY17-18. Tracing the fibs down from the FY21 high to the current multi-year low seen below, and this turns out to be the triple-top where the SNN share price then took a nosedive. It would, in my estimation, therefore be crucial to see prices head back to that range, in order to see some value in buying SNN right now.
Exhibit 7. Key level is $35 from long-term chart studies – need confirmation of directional trend back to that level
Data: HB Insights, Updata
Valuation and conclusion
In view of contracting FCF and return on invested capital it doesn’t surprise me to see SNN trading at a discount to GICS Industry peers. However there’s support for the company in other ways that balance the risk/reward calculus. Firstly dividend and earnings yield are marked at a substantial premium to the peer group and is respective on absolute terms at a next 12 months yield 4.6%. In addition, we’re getting shares at a 26% discount to peers on 1.7x book value, with a 9.66% ROE for the company. At this multiple, the investor ROE is 5.6%.
Meanwhile, at c.12x forward earnings, the market’s priced SNN to deliver a below-sector result at the bottom line next year. That’s something to factor in. Presuming the stock will recognize the consensus’ EPS forecast of $1.73 for FY23, at 12x forward earnings this sets a price objective of $20.70, in-range with the current market price. This is supportive of a neutral view.
Exhibit 8. Multiples and comps analysis
Data: HB Insights, Refinitiv Datastream
Net-net, there’s enough weight on either side of the risk/reward calculus to justify a hold recommendation for SNN. The major concern in the investment debate is the extended period of downside on the charts, and I’d need to see that to reverse in order to get more constructive on the stock. Valuations are somewhat supportive that SNN could hold the line, however, there’s a number of factors that could yet to be digested by the market. With these points in mind, I rate SNN a hold on a $20.70 per share valuation.
Be the first to comment