

SectoR_2010/iStock via Getty Images
Thesis
Recent price corrections have brought tech valuations to an attractive level. As an example, the VanEck Semiconductor ETF (NASDAQ:NASDAQ:SMH) has historically been traded at a premium relative to the overall market. For example, when I wrote about SMH about 1 year ago back in July 2021, SMH was trading at a PE of about 32.9x. And the overall market, represented by the SPDR S&P 500 Trust ETF (NYSEARCA:NYSEARCA:SPY), was trading at a PE of about 26.6x. As a result, SMH was boasting a 24% premium over the overall market (which by itself was a lofty level already).
Fast forward to now, recent corrections have brought SMH’s PE to the current level of 17.5x, about a 14% discount from SPY’s 20.2x. To wit, SMH suffered a total loss of almost 30% YTD as you can see from the following chart, and SPY about 14%. To add another reference point, the NASDAQ 100 index, represented by the Invesco QQQ ETF (QQQ), suffered a total loss of 22%. Combined with earnings changes, the PE of SMH now stands at an even larger discount from QQQ (about 25.0x) by a discount of ~30%.
Against this background, the thesis of this article is that such valuation corrections have created an interesting opportunity to consider heavier bets on the tech sector, meaning even heavier than QQQ. Most investors are familiar with the use of QQQ to gain exposure to the tech sector. And as will be elaborated later, QQQ indeed provides a heavier exposure to tech than SPY. However, QQQ itself isn’t a tech play per se considering that less than 50% of its assets (i.e., a minor majority) are invested in information technology stocks. On the other hand, QQQ is still trading at a sizable PE premium over the S&P 500 (by about 23%).
Given the above developments, we will examine the case for SMH through a comparative analysis against SPY more closely next.
Source: Seeking Alpha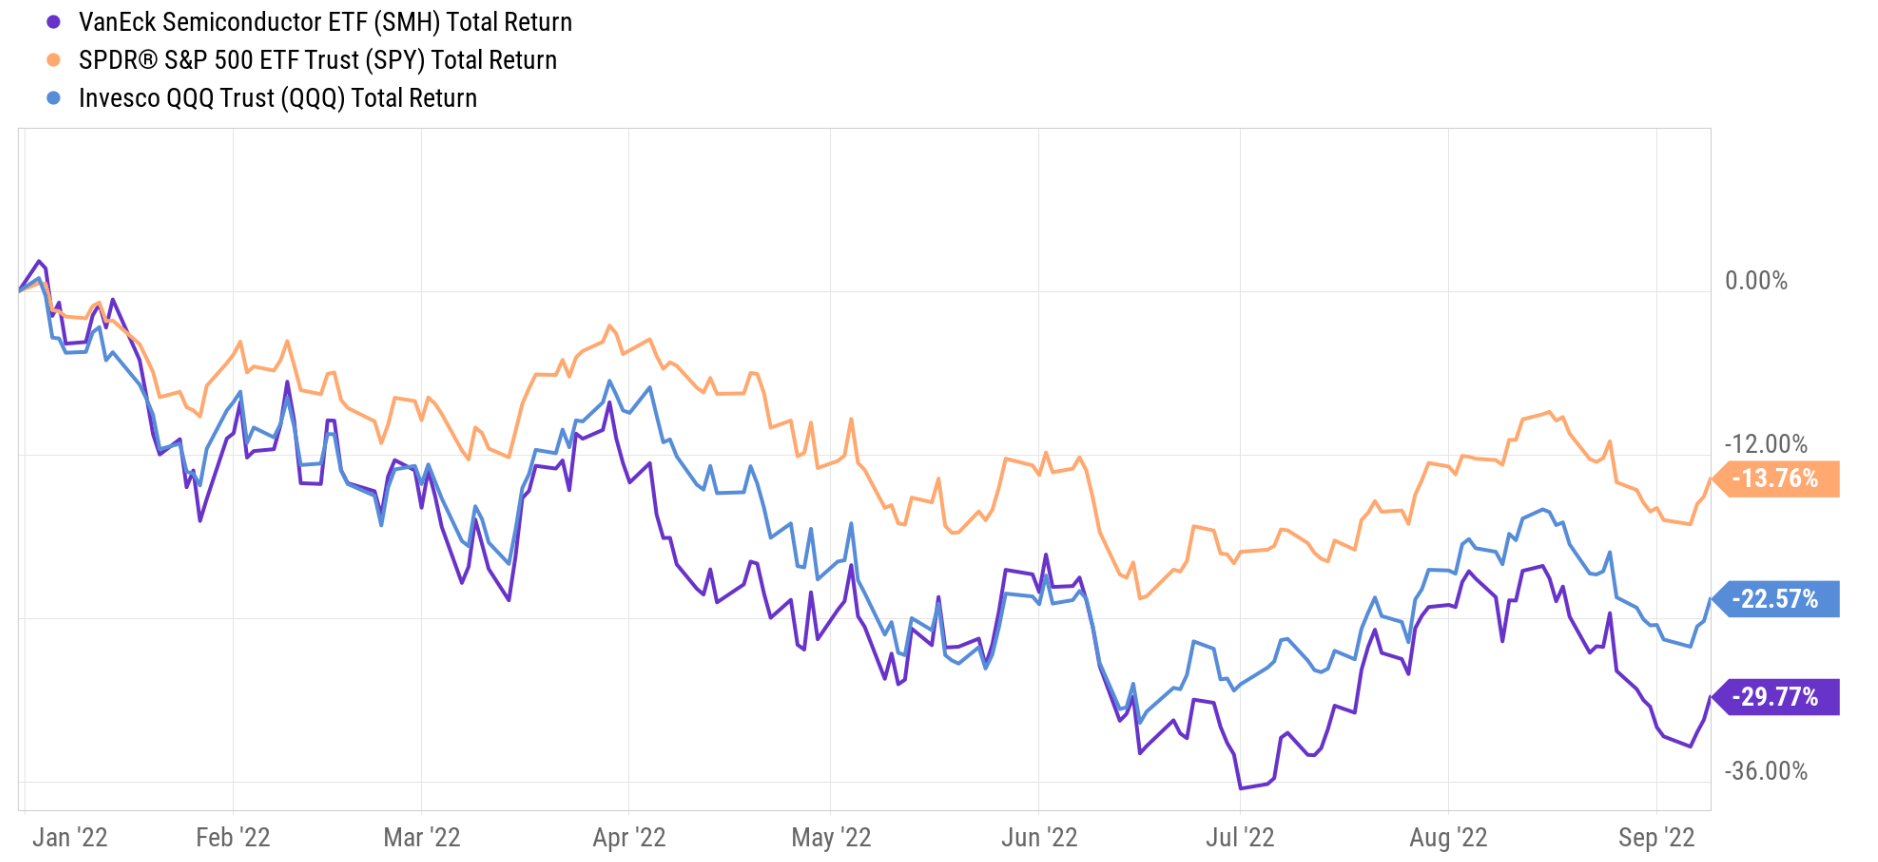
SMH vs SPY: basic information
SPY needs little introduction. It is one of the most popular funds tracking the S&P 500 Index. SMH, in contrast, is a pure tech play completely concentrated in the semiconductor sector. As detailed in the fund description:
VanEck Semiconductor ETF seeks to replicate as closely as possible, before fees and expenses, the price and yield performance of the MVISUS Listed Semiconductor 25 Index (MVSMHTR), which is intended to track the overall performance of companies involved in semiconductor production and equipment.
As you can see from the following chart, SMH is a much smaller fund than SPY, with $6.49B of AUM compared to SPY’s enormous $360B. SMH also charges a higher fee of 0.35% compared to SPY’s 0.09%. Finally, SMH holds a much more concentrated portfolio with only 26 stocks (compared to SPY’s ~500 holdings), and we will revisit the implication of such concentration risks as we go.
Source: ETF.com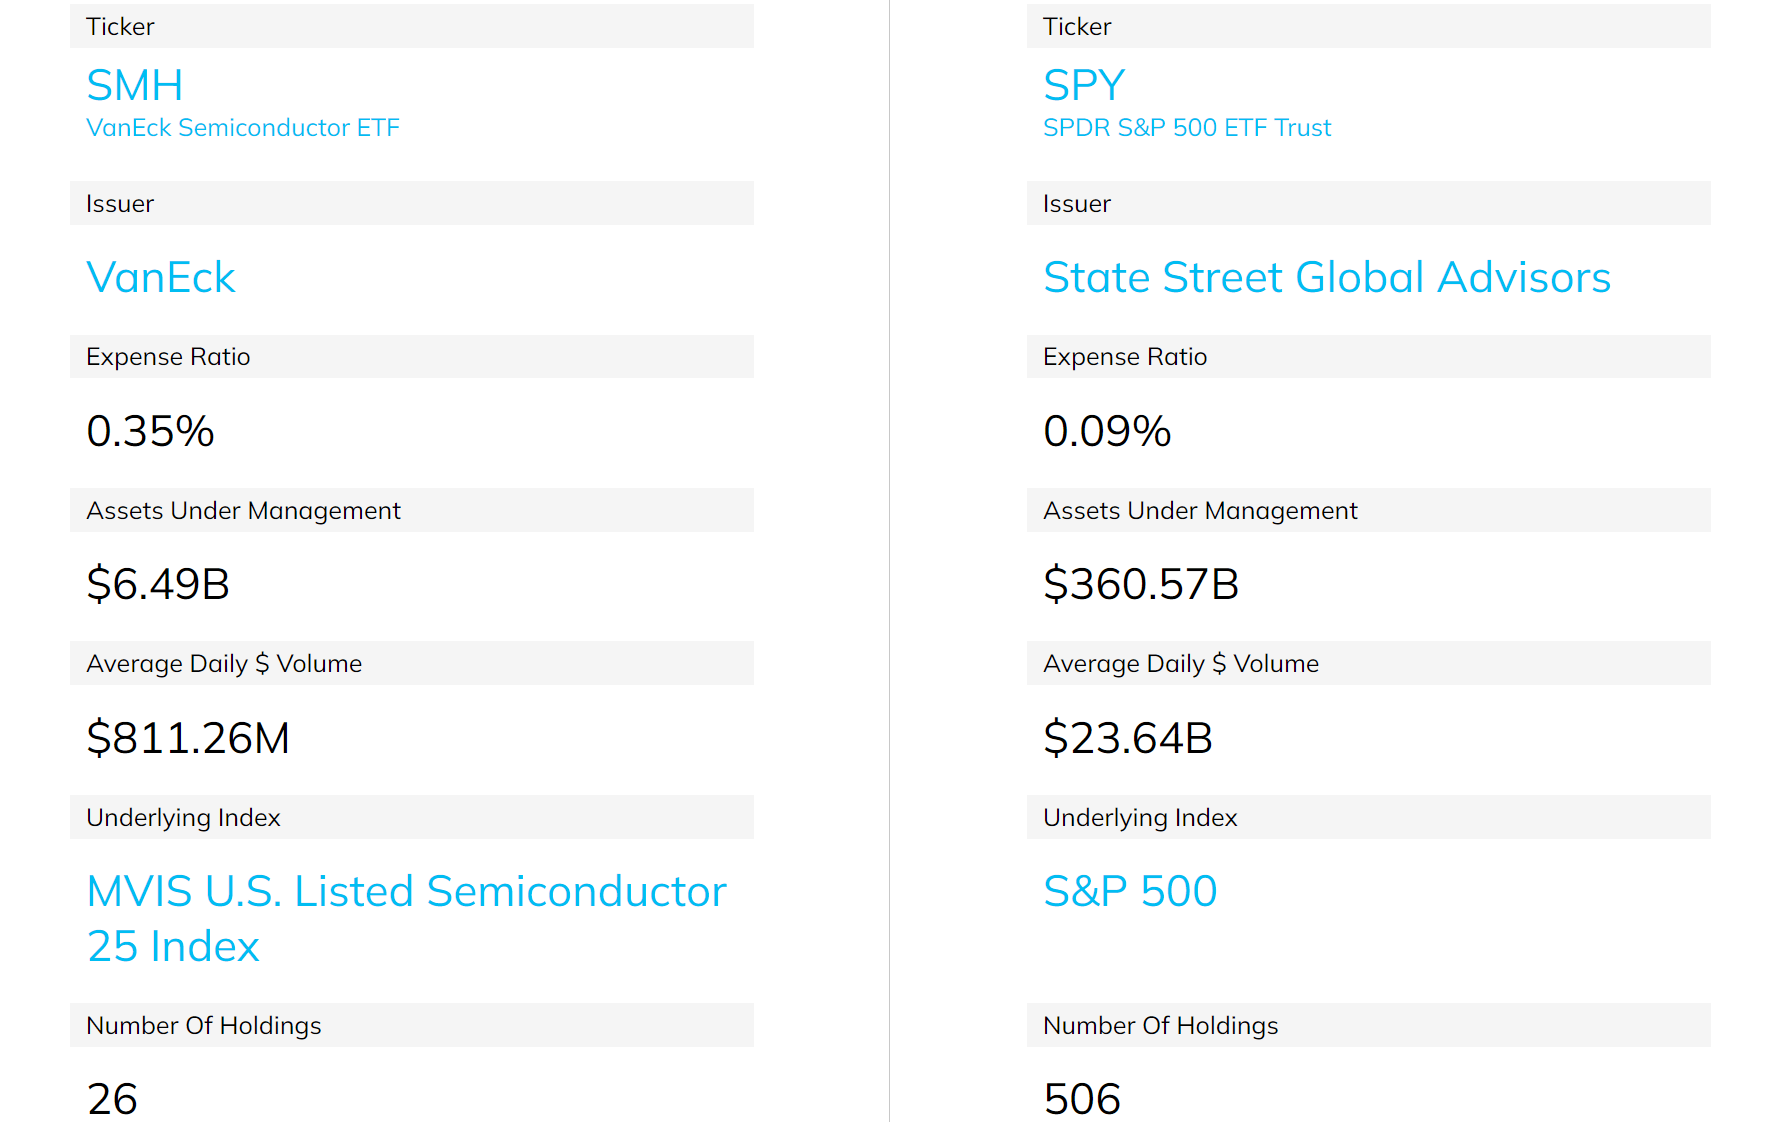
SMH vs SPY: Past performance and risks
Both the SMH and SPY funds have delivered handsome returns in the past as you can see from the chart below. Since the 2008 financial crisis (which I consider to be the endpoint of the last business cycle and the beginning of a new one), SMH has delivered an annual return of 14.8%. And SPY has delivered a CAGR of 9.12%, a solid return by any measure, however, nowhere near the SMH. SMH even outperformed QQQ by a good margin of about 1.1% of alpha per year as seen. The reason is that QQQ is not a pure-tech play because the NASDAQ 100 index tracks the largest NON-FINANCIAL companies listed on the Nasdaq. Many of these companies are not tech companies and I will elaborate on this point later.
When compounded over the years, the above outperformance has accumulated into a sizable difference in total return. With dividends reinvested, SMH has delivered a total return of 758%, beating QQQ’s 663% by 95% and SPY’s 360% by 398% (i.e., more than doubling it).
Although, the downside is the price volatilities due to the concentration risks aforementioned and also the highly cyclical nature of the semiconductor sector. We’ve already seen a glimpse of the price volatility in the YTD performance with SMH suffering a correction that is more than twice that of SPY and about 1/3 more than QQQ. In the long term, SMH has also suffered much larger volatility. As you can see from the following chart, in terms of standard deviation, SMH’s 14.8% is 1.62x higher than that of the S&P 500 (9.12%) and has also been higher than QQQ by about a 1.1%. In terms of worst-year performance, SMH suffered a 45% loss (which will take more than a 81% rally to break even), which was 4% more than QQQ and 9% more than the S&P 500. And finally, in terms of maximum drawdown, SMH’s 49.5% maximum drawdown (which takes an almost 100% rally to break even) is truly nerve-wracking.
And next, we will examine the root cause of the volatilities more closely.
Source: Portfolio Visualizer 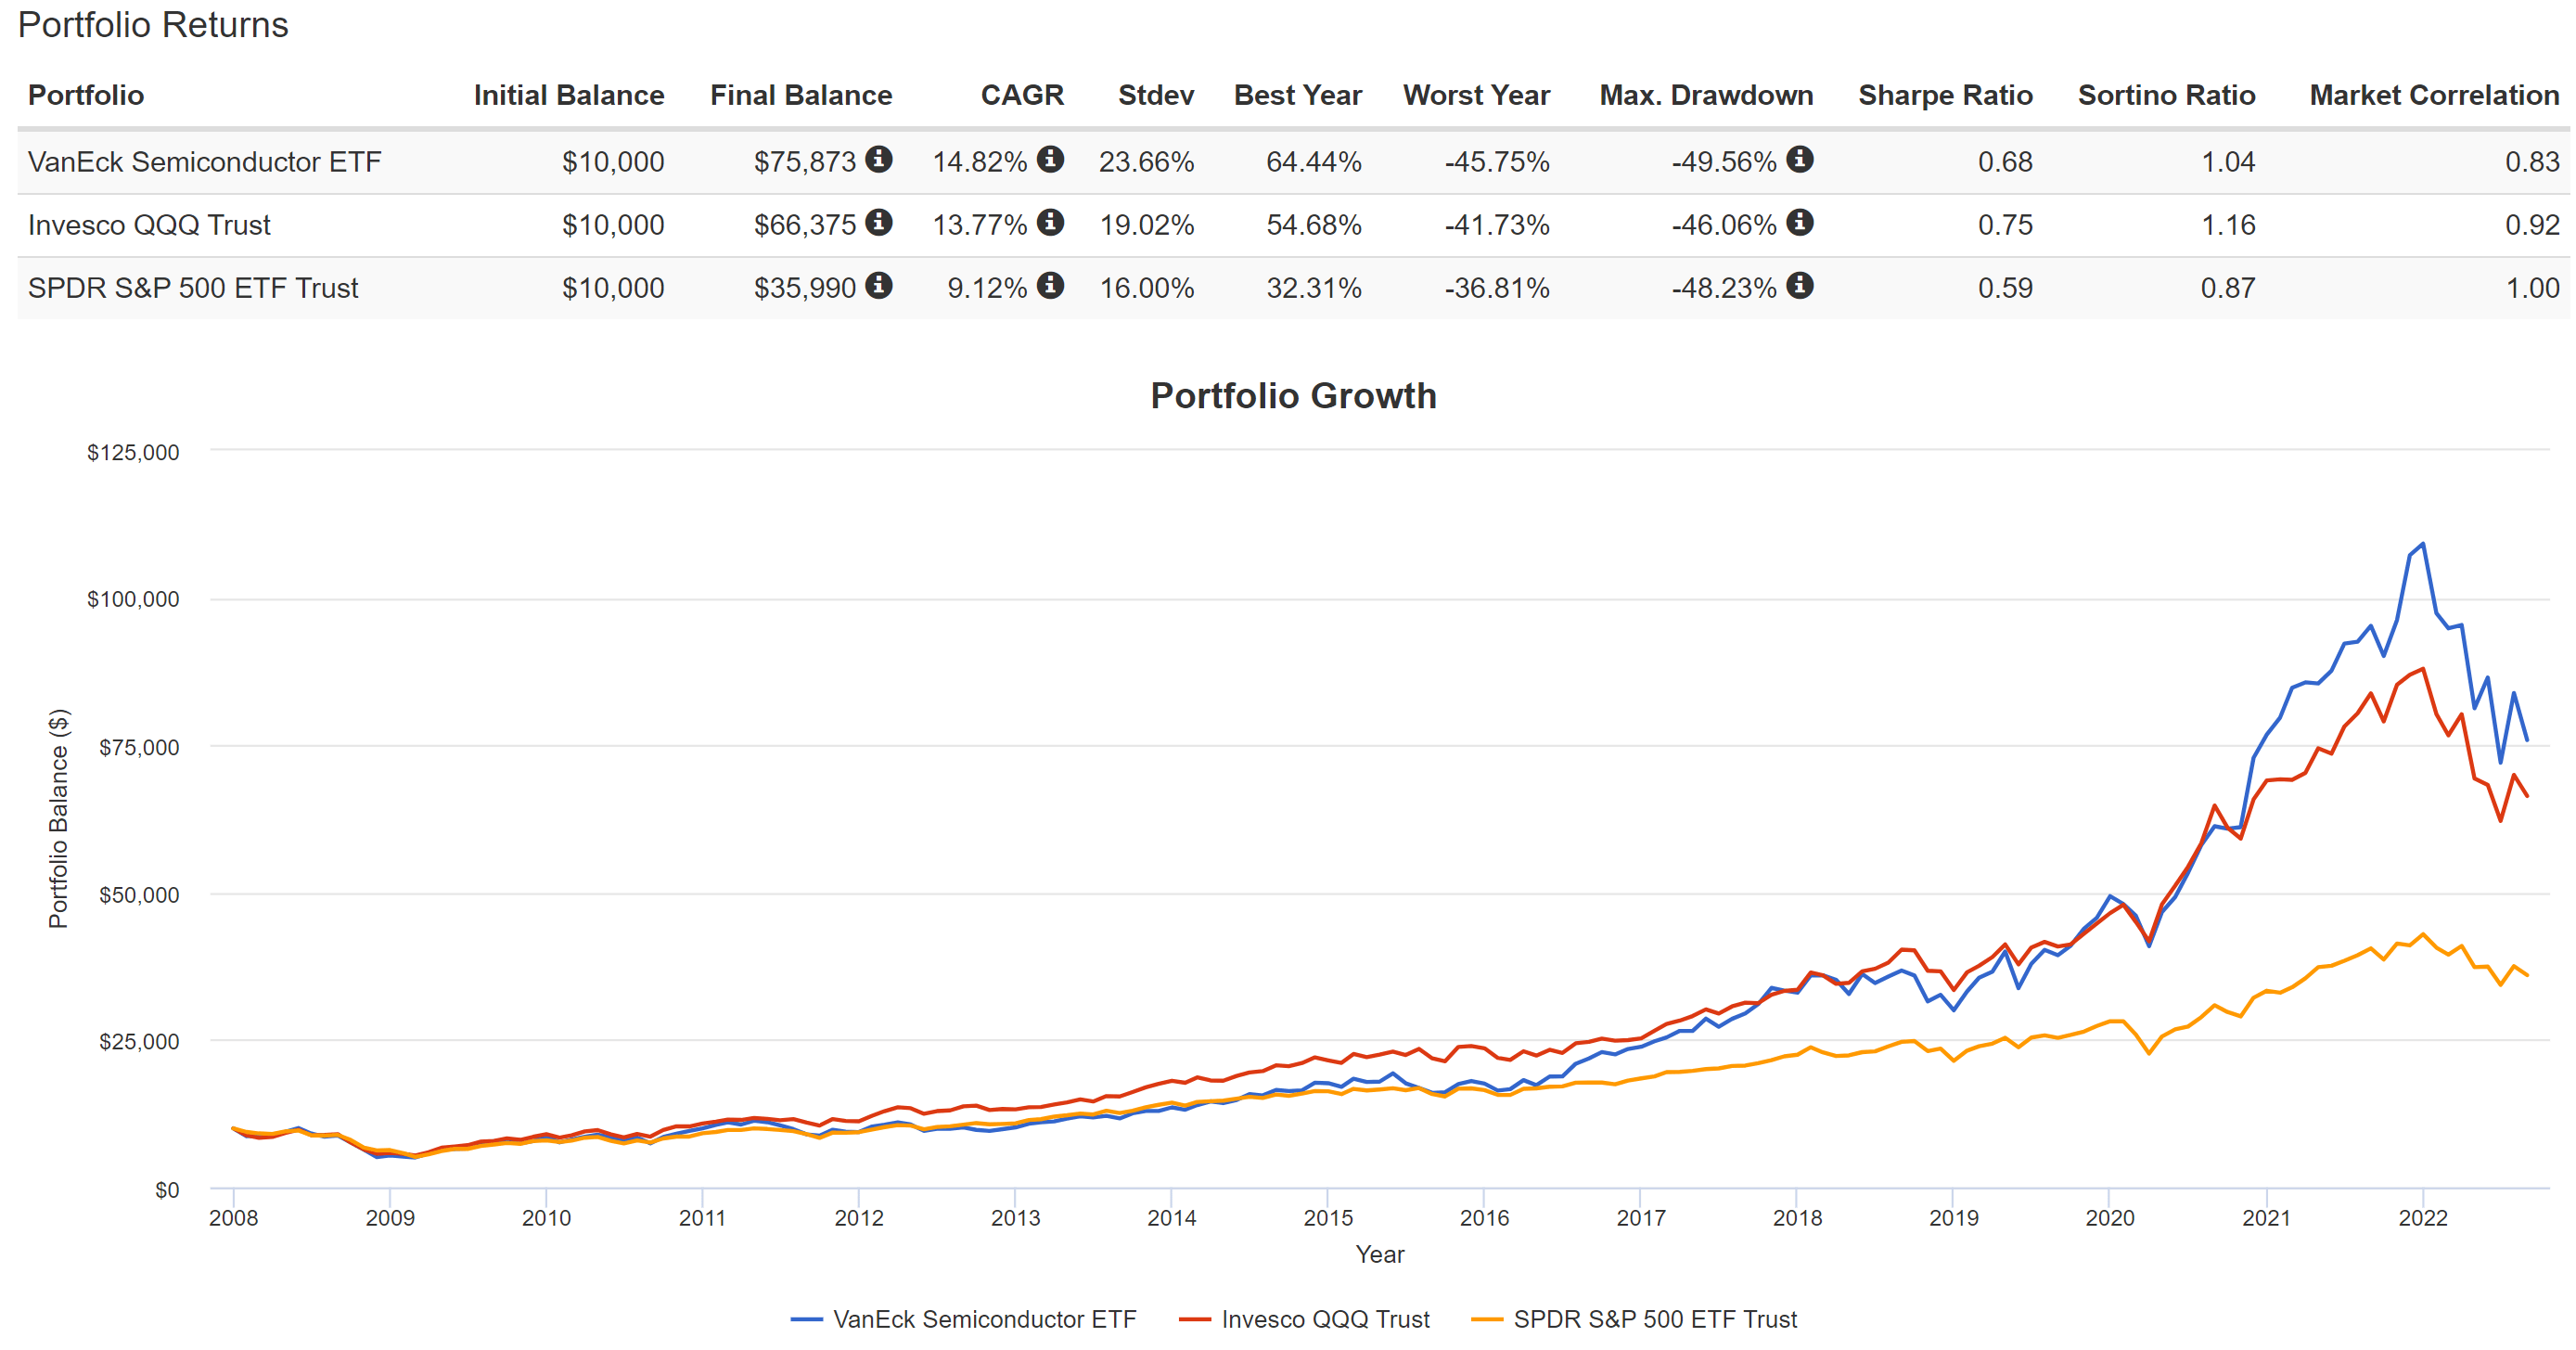
SMH: More concentrated bet on Tech than SPY and QQQ
As aforementioned, SPY tracks the large 500 companies in the U.S., QQQ tracks the largest NON-FINANCIAL companies listed on the Nasdaq, and SMH is concentrated in the semiconductor sector. The chart below provides more specifics to compare their exposures.
SMH’s exposure is effectively 100% concentrated in the information technology sector. In contrast, information technology represents 26.8% of SPY’s total assets and 49.8% of QQQ’s total assets. So as mentioned above, many investors are familiar with the use of QQQ to gain exposure to the tech sector compared to SPY. And QQQ indeed provides the heavier bet that investors seek: its exposure to infotech is almost 2x higher than SPY. However, infotech is only a minor majority for QQQ, and QQQ still holds a large portion of “non-tech” stocks such as consumer staples, healthcare, industrials, and utilities.
Source: Author based on fund issuers’ data 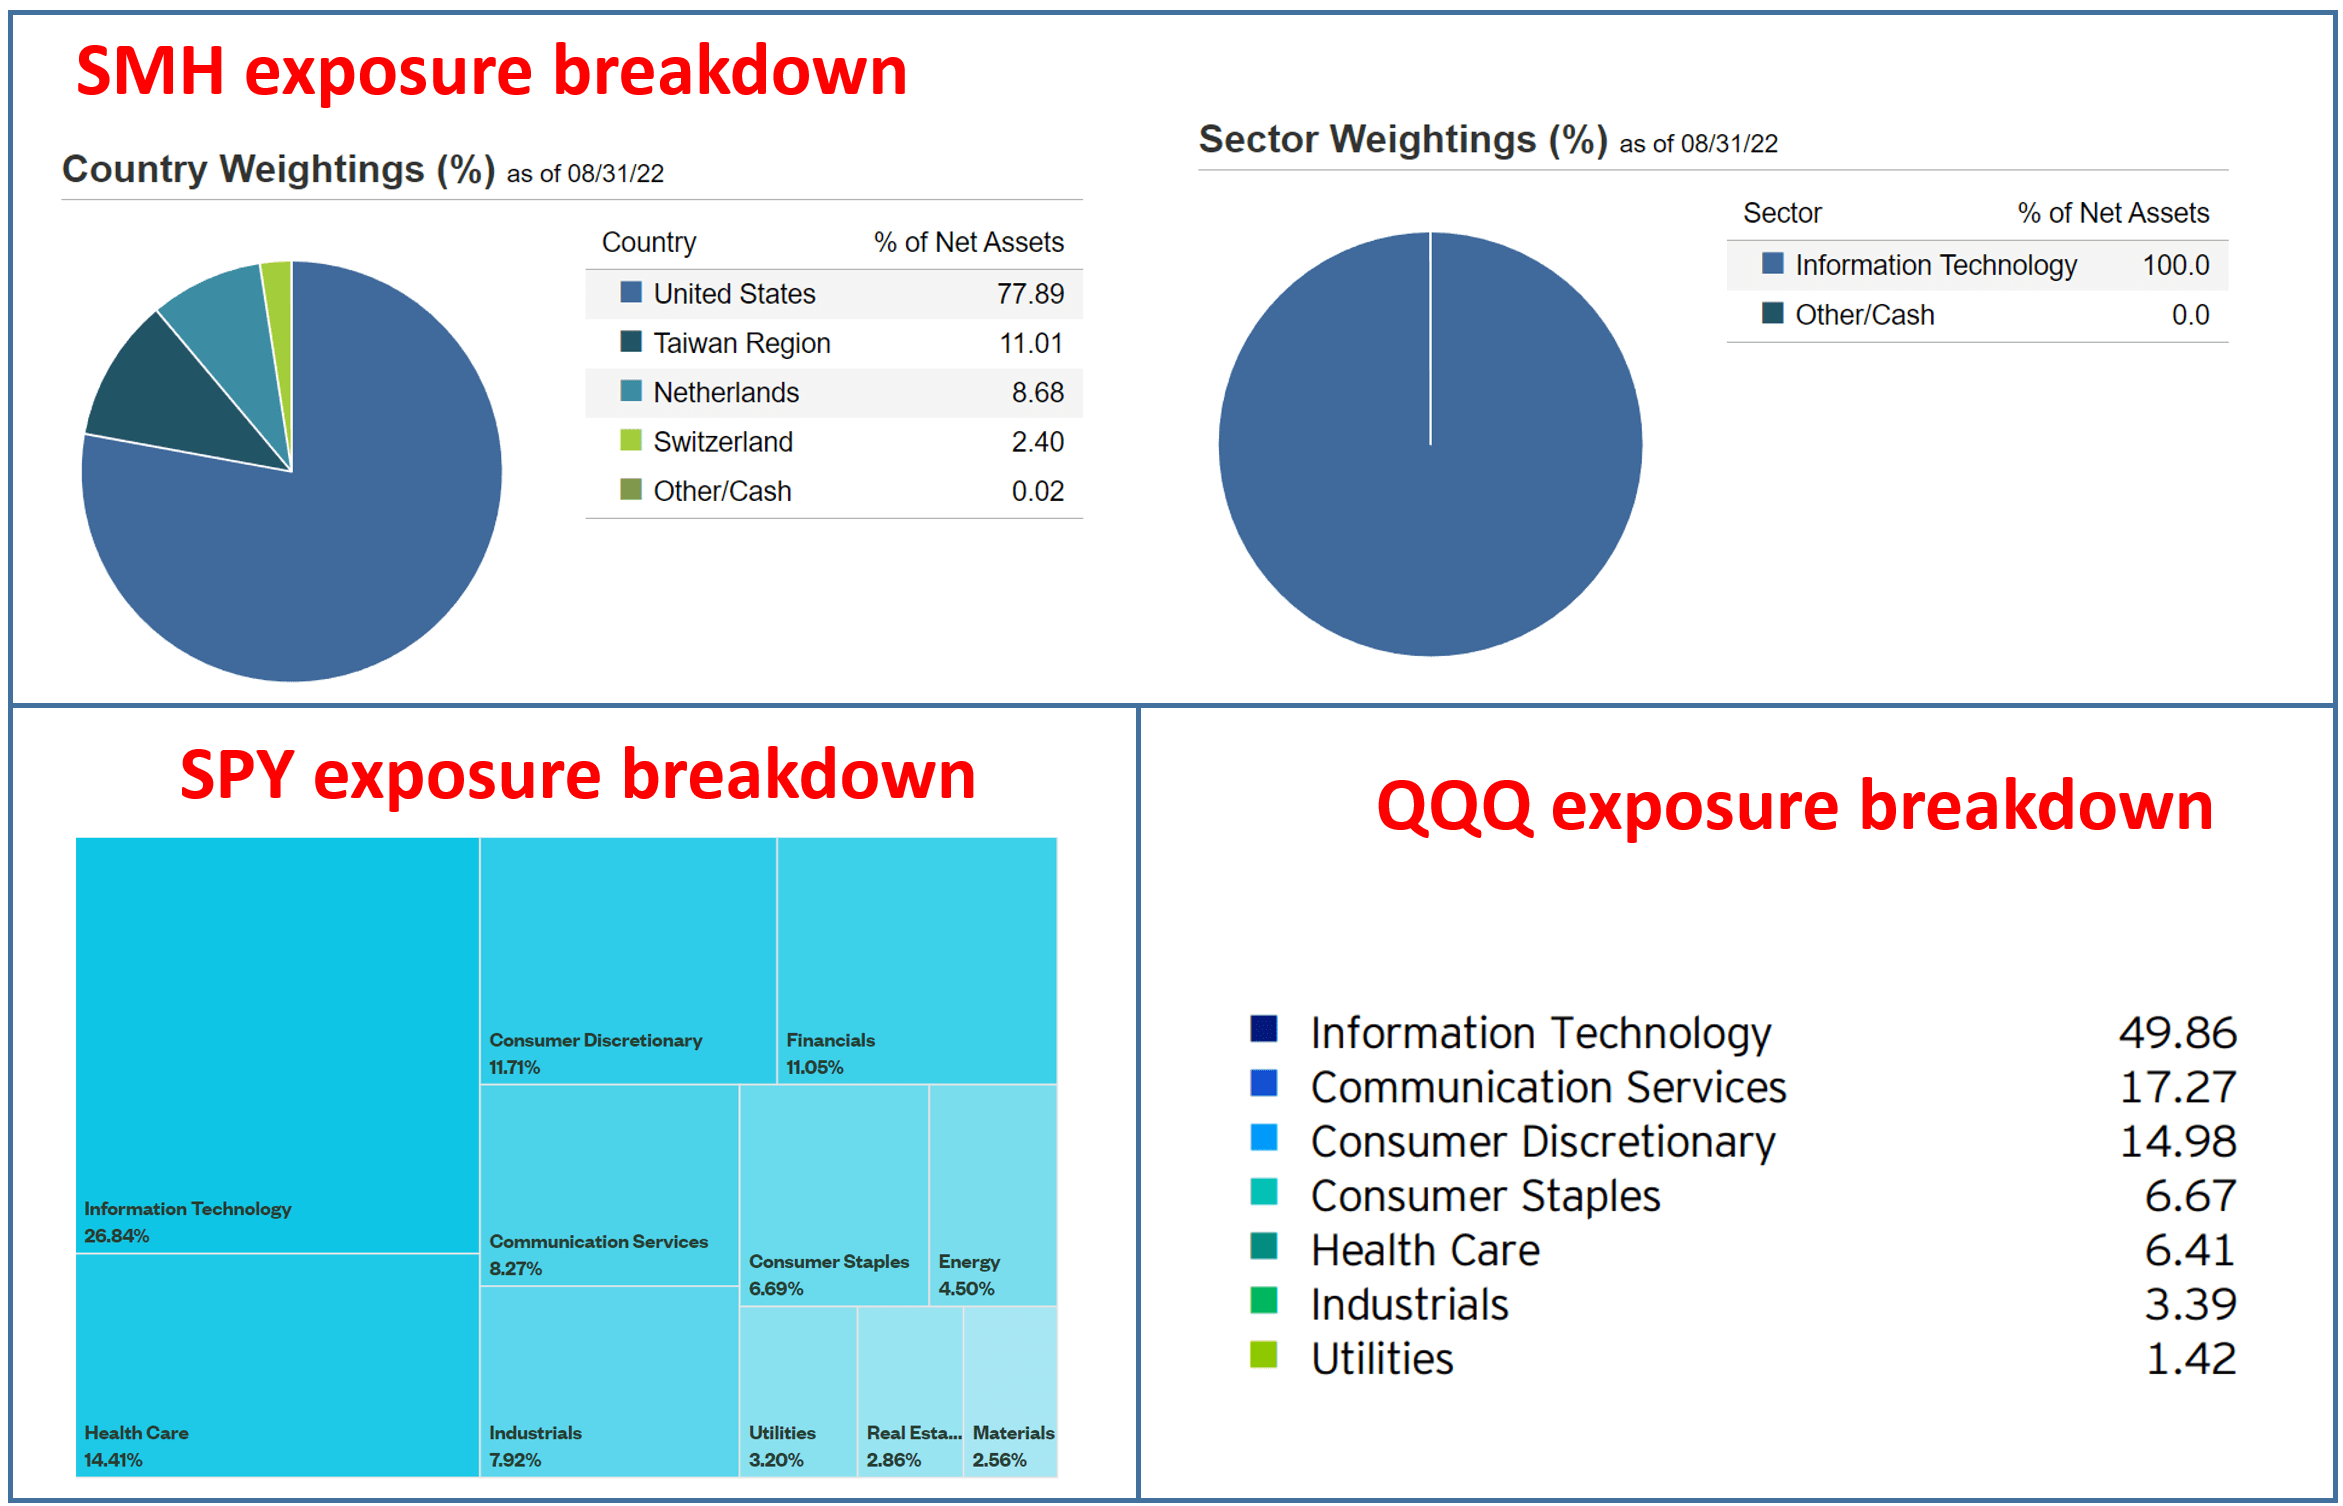
SMH, in contrast, is a pure tech play. The fund is completely invested in the tech sector, especially the semiconductor sector. You can also see the concentration and composition more vividly by looking at their top ten holdings. Note that among these three funds, only one holding overlaps: Nvidia (NVDA). But NVDA represents the second largest holding in SMH (with a 7.58% allocation). In contrast, it only represents the 10th largest holding in SPY (with only about 1.37% allocation) and the 7th largest holding in QQQ (with only about 3.2% allocation). Also note that both SPY and QQQ’s top 10 holdings include staples like Johnson & Johnson (JNJ), Costco (COST), and PepsiCo (PEP), while all SMH holdings are semiconductor stocks.
To me, this is key for SMH’s long-term performance. It places a concentrated bet on one of the most innovative sectors: information technologies. For this reason and the current valuation, I see favorable odds for SMH to keep outperforming both the S&P 500 and also QQQ in the long term, as to be detailed next.
Source: Vanguard.com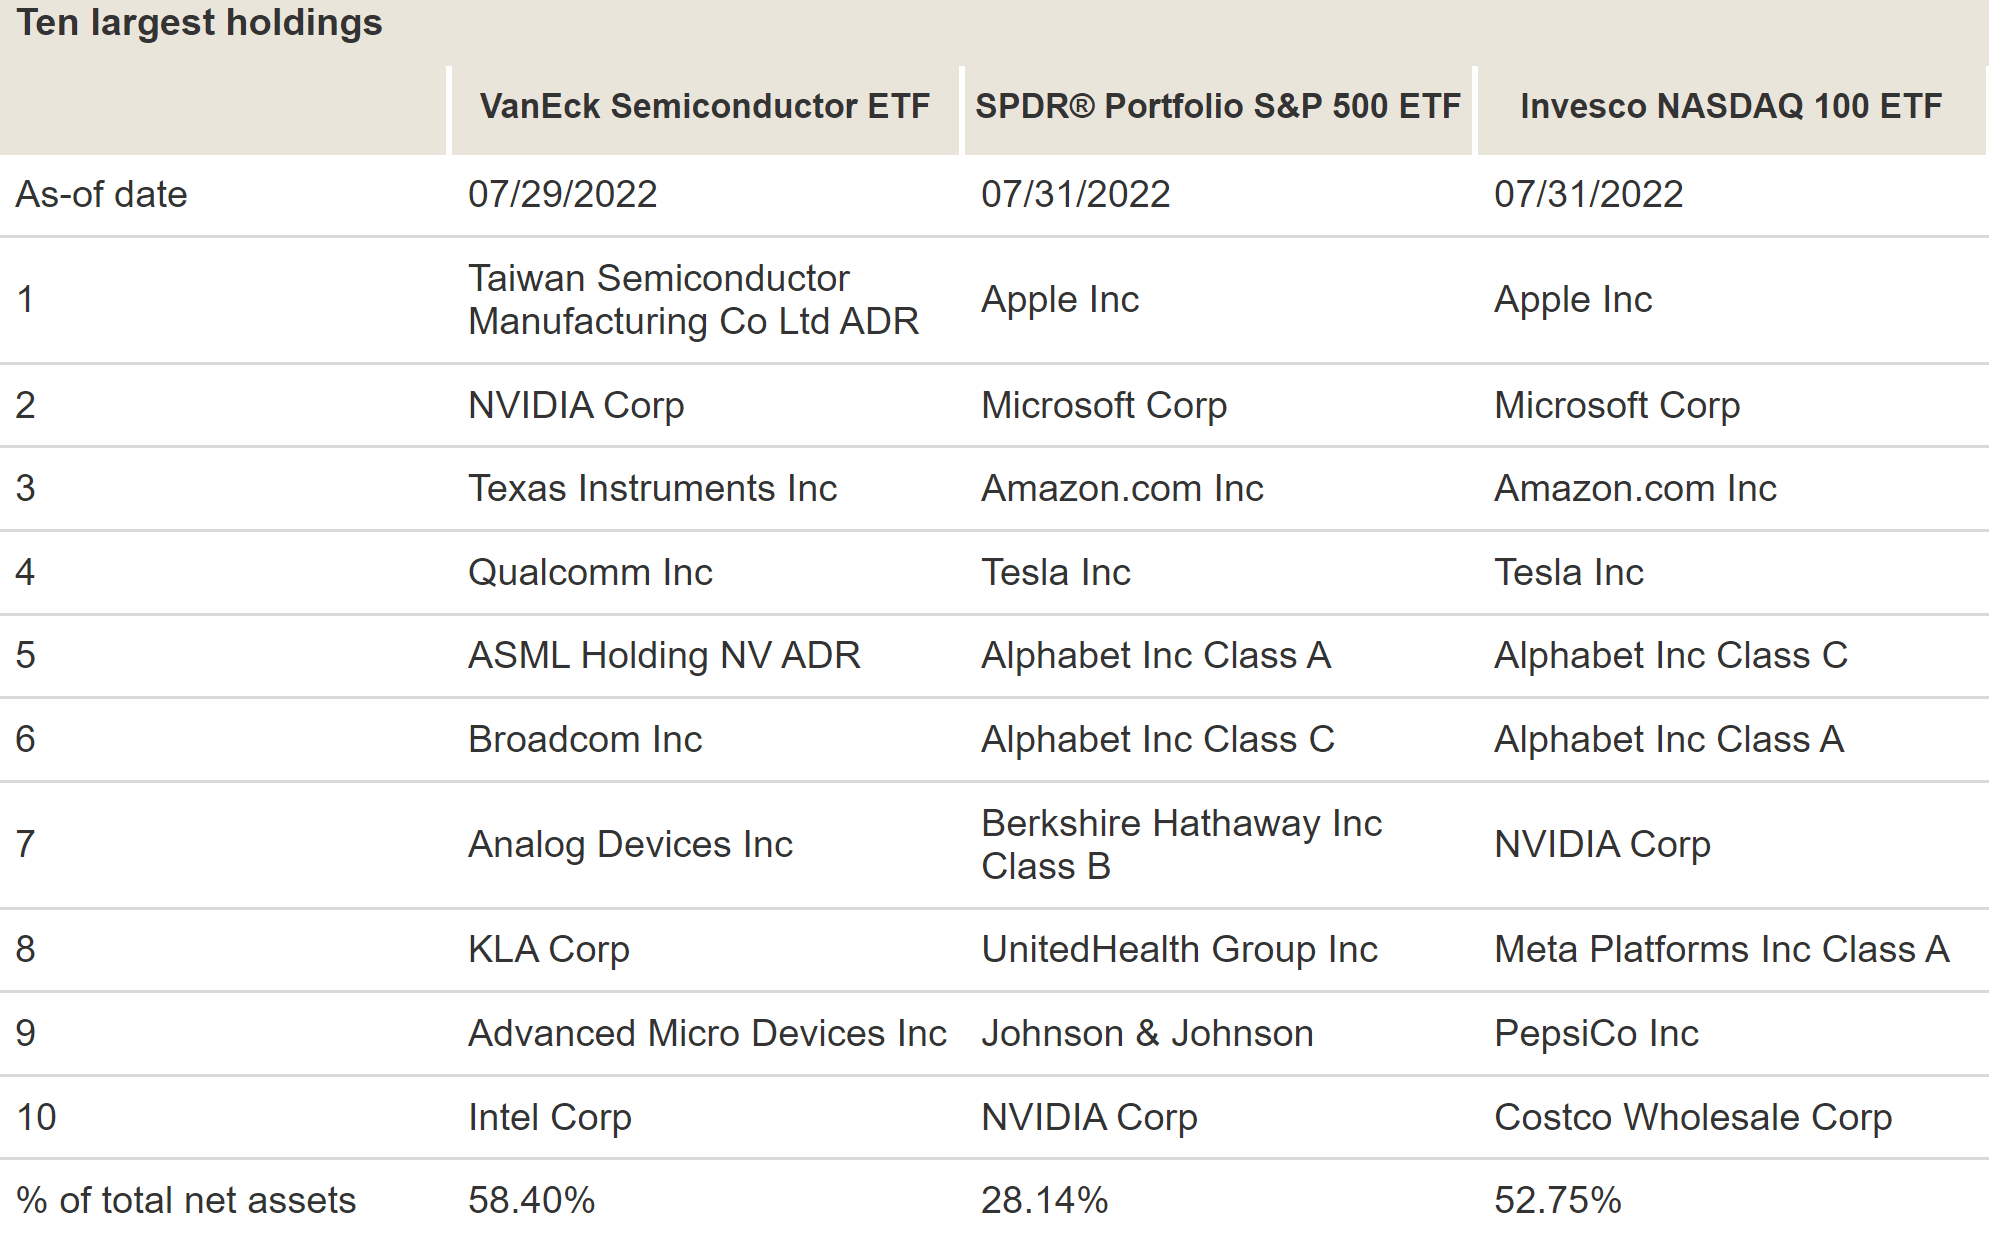
SMH, SPY, and QQQ: valuation and profitability comparison
As aforementioned, SMH has historically been traded at a premium relative to both the S&P 500 and QQQ because of its growth potential. However, recent price corrections have brought its valuation to a discount. SMH’s current PE of 17.5x as shown below. Compared to SPY’s PE of 20.2x, it is for sale at a ~14% valuation discount. Compared to QQQ’s PE of 25.0x, its valuation discount is even larger at a whopping 30%.
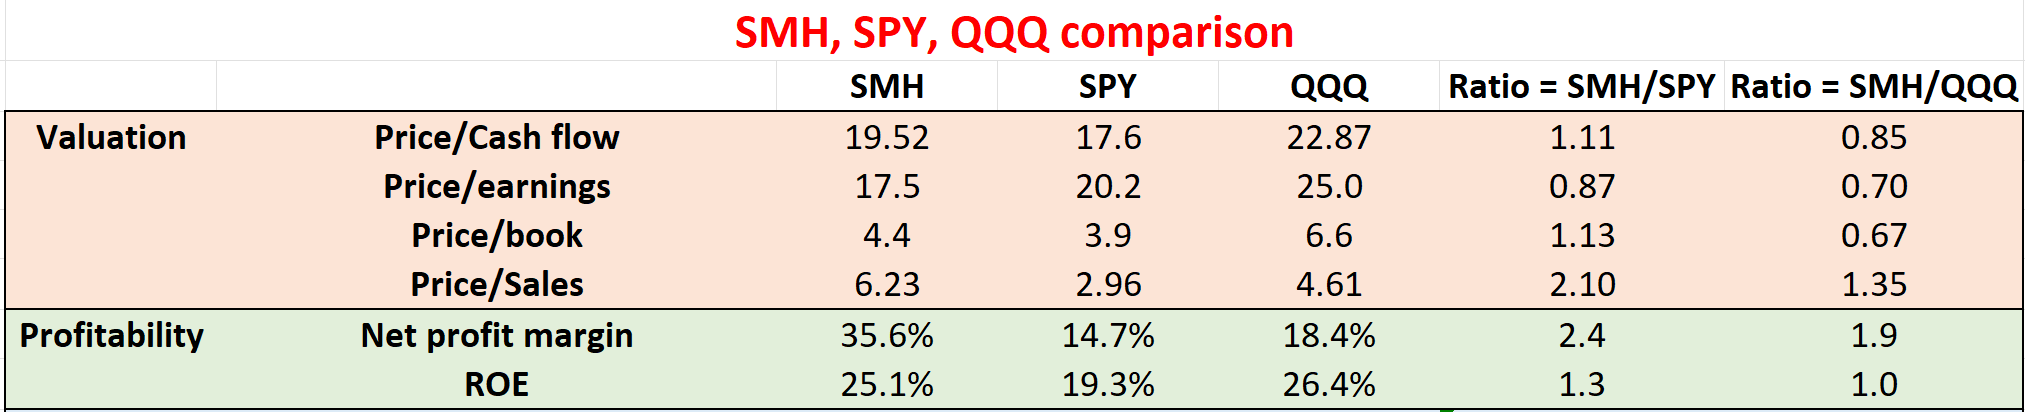
Other metrics paint the same picture as seen from the second chart below (with data taken from either Vanguard or Yahoo Finance). The price-to-cash flow ratio of SMH is 19.52x, below QQQ’s 22.87x by about 15.0%. And price-to-book value ratio of SMH is 4.4x, below QQQ’s 6.6x by about 33%, or a third, despite essentially identical ROE (25.1% for SMH and 26.4% for QQQ). Finally, do not be alarmed by SMH’s higher price-to-book or price-to-sales ratio compared to SPY. Its price-to-book ratio of 4.4x is higher than SPY by about 13%, but its ROE is higher than SPY by about 30%. And its price-to-sales ratio of 6.23x is higher than SPY by about 110%, but its net margin is higher than SPY by 140%.
Source: Vanguard.com Source: Author based on Vanguard and Yahoo Finance data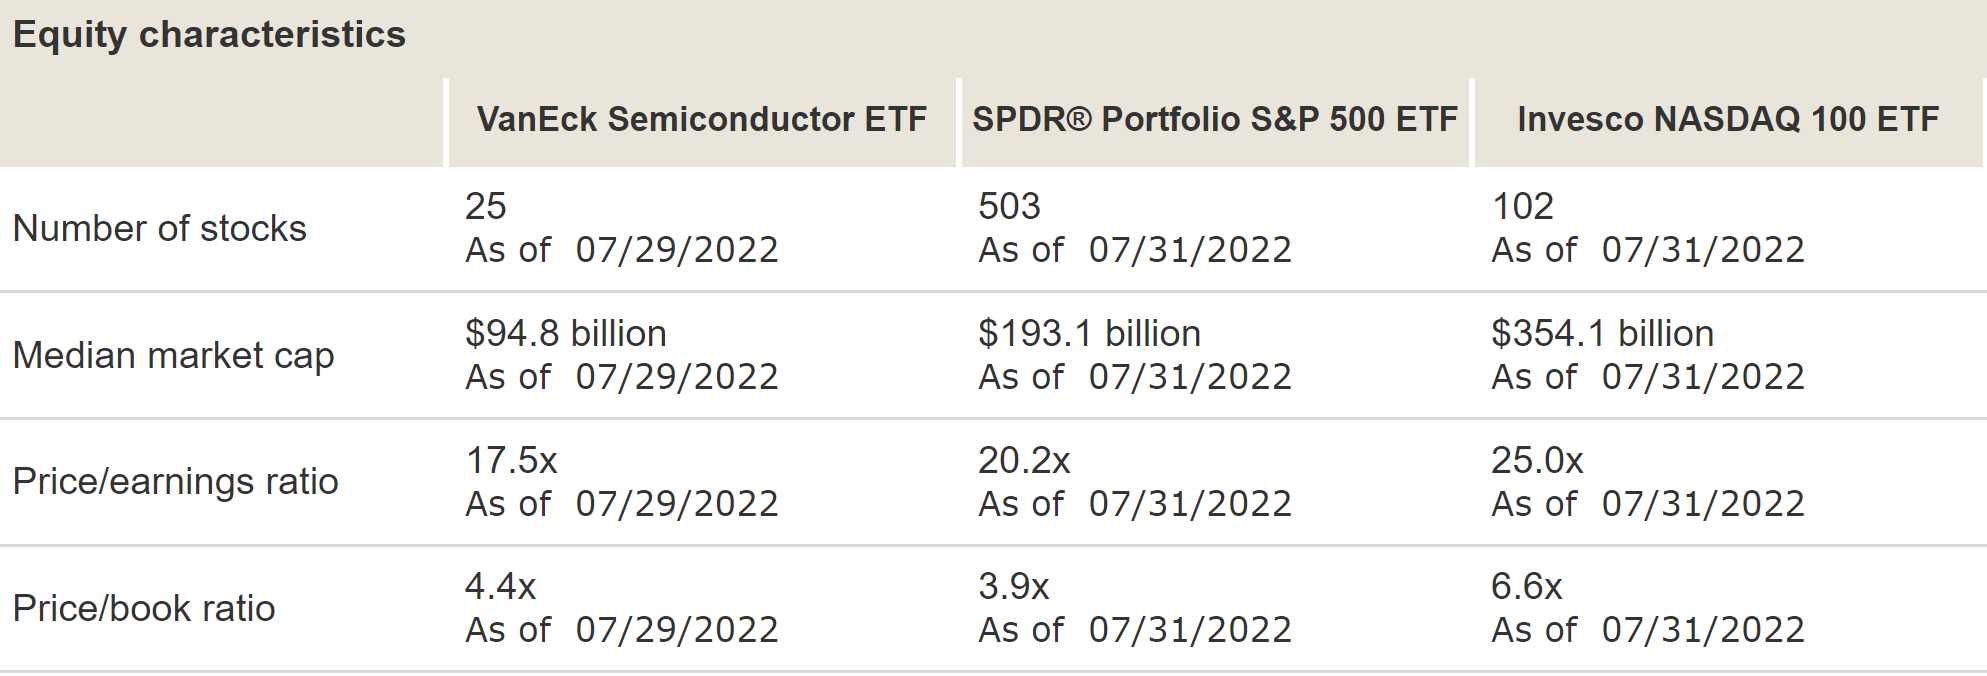
Final thoughts and risks
To recap, there are good reasons to start considering a more concentrated bet on the tech sector with a fund like SMH. It is a pure play on the information tech stocks and a step up from QQQ. SPY and QQQ have never been bad choices with their low fees and broad market representation. However, recent developments have brought the valuation of SMH to an attractive point in comparison. The semiconductor fund is now trading at substantial PE discounts relative to both SPY (by 14%) and QQQ (by 30%) despite its far superior profitability metrics.
Finally, risks. Before we close, I want to reiterate the risks so that investors can pick the right fund for their timeframe and risk tolerance. As aforementioned, SMH has demonstrated substantially higher concentration risks and volatility risks, compared to both QQQ and SPY.
SMH also charges an expense ratio of 0.35%, while SPY charges 0.09% and QQQ charges 0.2%. The extra fee will always create a drag on SMH (0.24% per year compared to SPY and 0.15% compared to QQQ). Also, note that SMH also has a much higher turnover ratio of 20% (compared to 4% from SPY). Finally, if you recall from an earlier chart, SMH has a sizable overseas exposure. Its asset consists of 78% U.S. stocks and 22% foreign stocks, while both SPY and QQQ hold only U.S. stocks. Both the higher turnover rates and foreign exposure might create tax implications for some accounts. As seen in the chart below, its outperformance has been partially canceled off by the tax headwinds. As an example, on a 3-year basis, it outperformed SPY by 13.3% (23.8% total return vs 10.5% from SPY) before taxes. After taxes on distributions and the sale of fund shares, the outperformance narrowed to about 9.9% only (18.7% after-tax returns vs 7.8% from SPY).
Source: Vanguard.com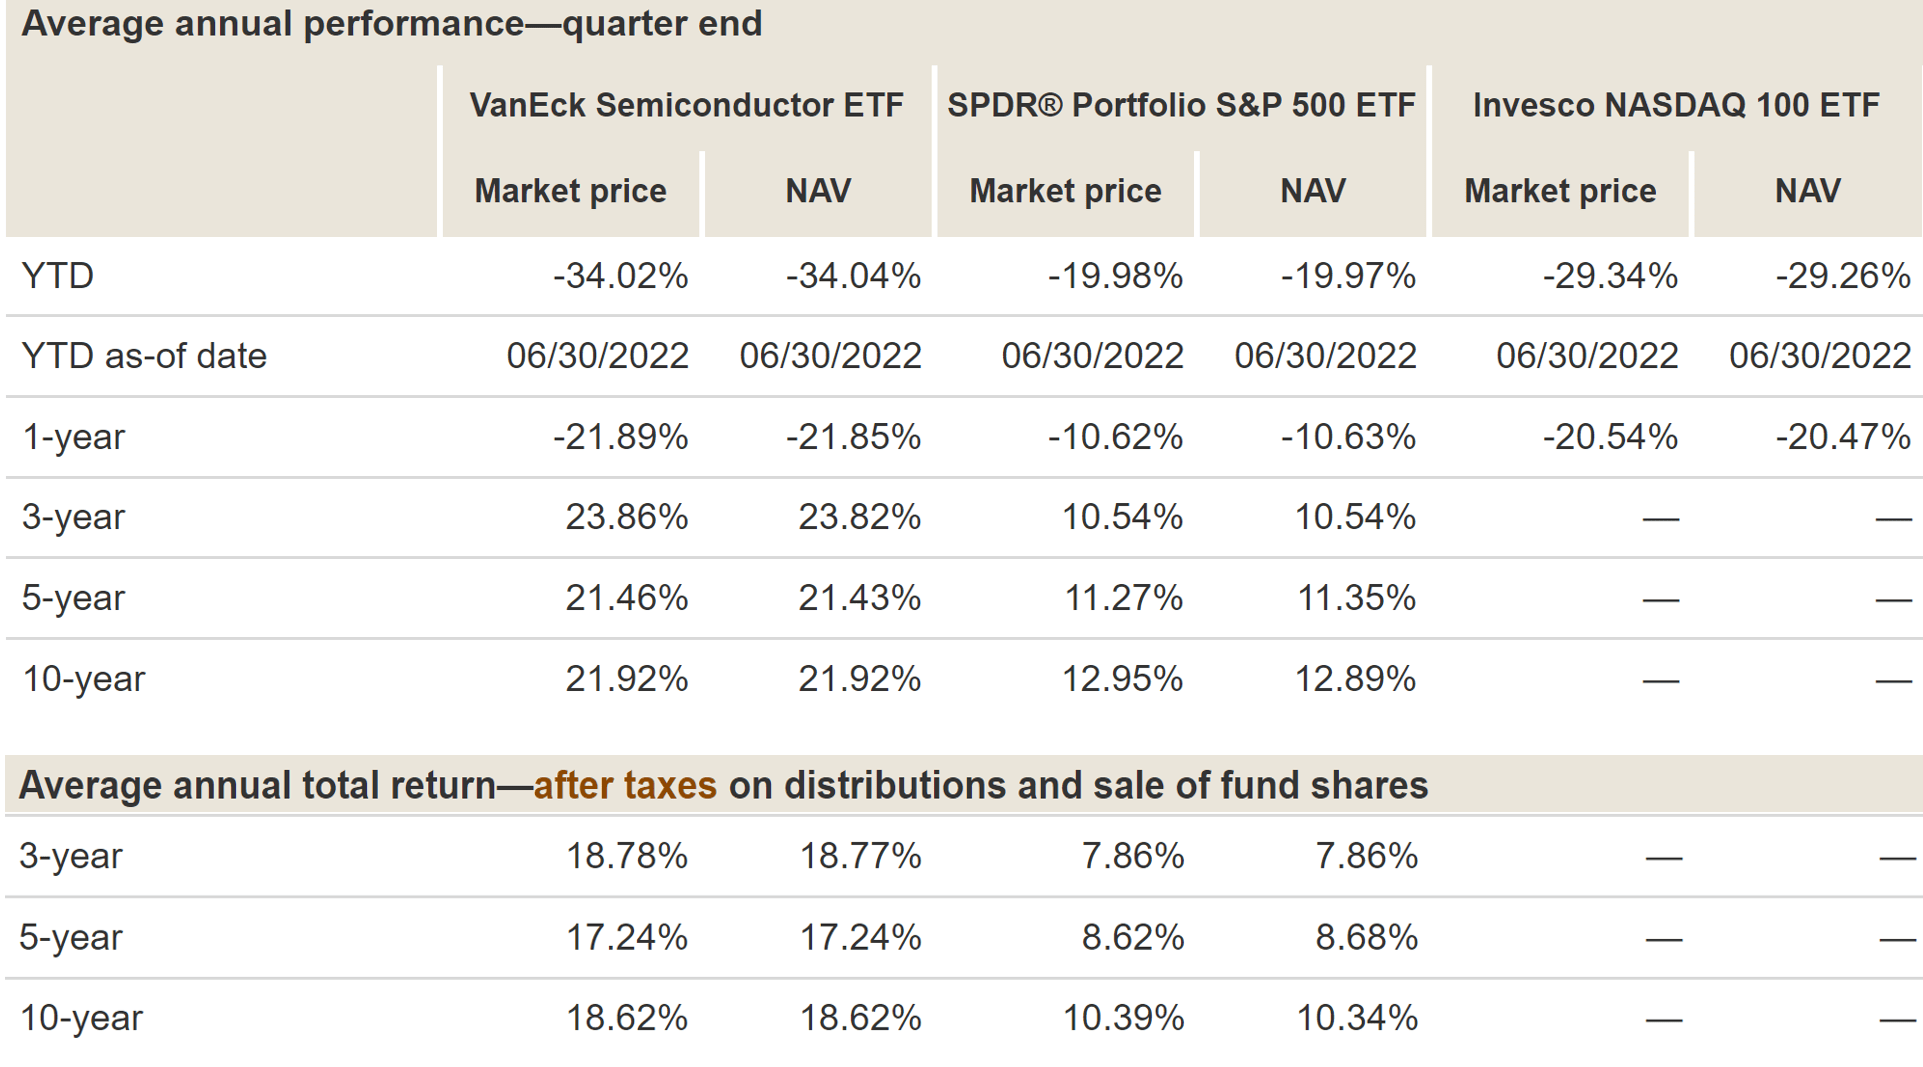
Be the first to comment