


E&P’s are Letting Revenue Slip Their Hands
RyersonClark/E+ via Getty Images
Smart Sand and US energy production from tight reservoirs
I will break with tradition and begin with a disclosure. I am a long term holder of Smart Sand (NASDAQ:SND). I initiated my position in SND in early May of 2020 below $1.00 and it has since climbed through several spikes and dips to its current value of about $1.95. I currently hold what I consider a full position in SND amounting to about 2% of my personally managed stock portfolio.
I closely follow all of my positions and periodically review them in a comprehensive fashion. The impetus for this review was SND’s most recent earnings report published on Seeking Alpha on August 9th. My background research got out of hand and ended up becoming its own review of US energy production from tight reservoirs and a buy recommendation for oilfield services ETFs. Briefly, 60% of US oil and 70% of US natural gas is produced from tight reservoirs. Tight reservoirs must be hydraulically fractured using thousands of tons of sand per well completion. Further, production decline in tight reservoirs is severe and new wells must be drilled periodically.
Metaphorically, maintaining production in tight reservoirs is more like mowing the lawn than planting a tree. New wells must be drilled and completed on a regular schedule; growing oilfield services revenue is nearly certain. Likewise, a constant stream of frac sand (proppant) will be required and SND produces the best natural proppant available, Northern White Sand.
Smart Sand and the shift to in-basin sand
Smart Sand mines, processes, ships, and delivers Northern White Sand (NWS) proppant to well sites across several basins in North America. NWS exhibits superior characteristics as a proppant. NWS sand grains are mostly round, smooth, and monocrystalline resulting in high crush strength and maximum flow of oil and gas through sand-packed fractures. However, NWS, SND’s primary product, has always been more expensive mostly on shipping cost to distant basins. Locally sourced, in-basin sand is a cheaper option for exploration and production companies (E&Ps).
As oil dropped from 2014 highs of about $100/bbl to around $65/bbl through late 2019, many E&Ps began using in-basin sand to save money on completion costs. The switch accelerated through the pandemic dip as E&P’s were forced to implement aggressive cost saving measures. I expect elevated oil and gas prices to be a catalyst for E&Ps to reevaluate their economic analysis including completions and proppant. Some of them will revert to NWS and drive SND revenue and price return higher.
Cheaper in-basin sands yield lower production and less revenue
Numerous well studies have shown less production when cheaper in-basin sand is substituted for NWS proppant in well completions.
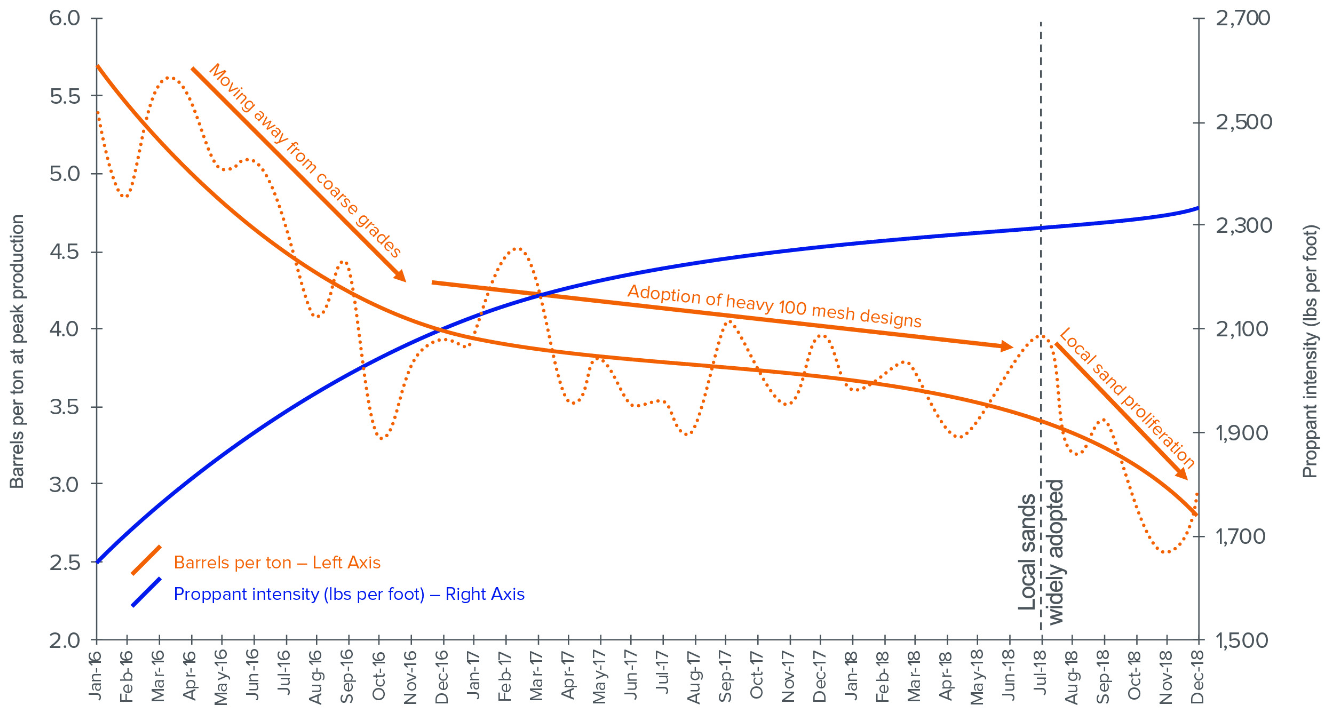
Proppant Intensity and Efficiency Trends
Hart Energy
Hart Energy published the graph above in August 2019 as part of a completions efficiency study that examined NWS proppant and in-basin sands. The blue line representing proppant intensity (the sand placed per foot of well bore) has trended up over time. The dashed and solid orange lines represent proppant efficiency measured in barrels of oil produced per ton of sand placed. The dashed vertical line marks the widespread adoption of local in-basin sands. Subsequent to adoption of in-basin sand, proppant efficiency dropped sharply.
Another study of well production was published by Rystad Energy in May of 2020 and highlighted in Smart Sand’s most recent quarterly report. The study examined 800 wells across seven operators in the Permian basin with 50% of operators seeing a negative revenue impact when wells completed with cheaper in-basin sand were compared to those completed with NWS proppant. The following chart is a summary of the data and analysis contained in the Rystad report.
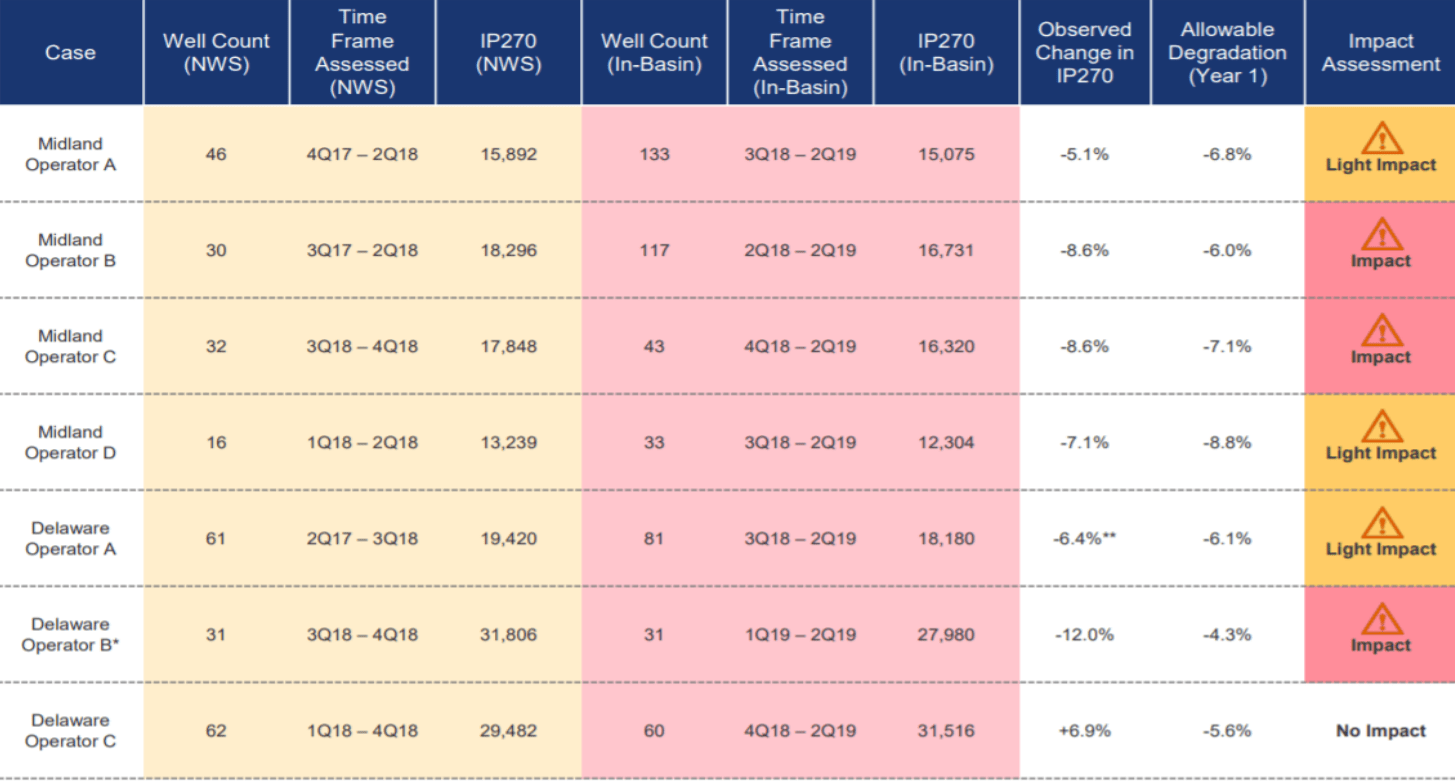
Total Production after 270 Days: NWS vs In-Basin Sand
Rystad Energy
NWS completions are highlighted in yellow while in-basin sand completions are highlighted in pink with qualitative impact of proppant in the last column. The Rystad study noted 3 cases with light negative production impact and 3 more severe cases of impact meaning that more oil was produced with NWS vs in-basin sand. The final case (Delaware C) is classified as no impact but, in fact, less oil was produced with NWS proppant.
The economic impact assessment was completed based on production at 270 days (IP270) and oil prices between $40 and $60/bbl. Of course the wells examined did not stop flowing at 270 days; they continued to produce and oil is currently over $90/bbl. Further, economic analysis of NWS proppant vs in-basin sand is called for here.
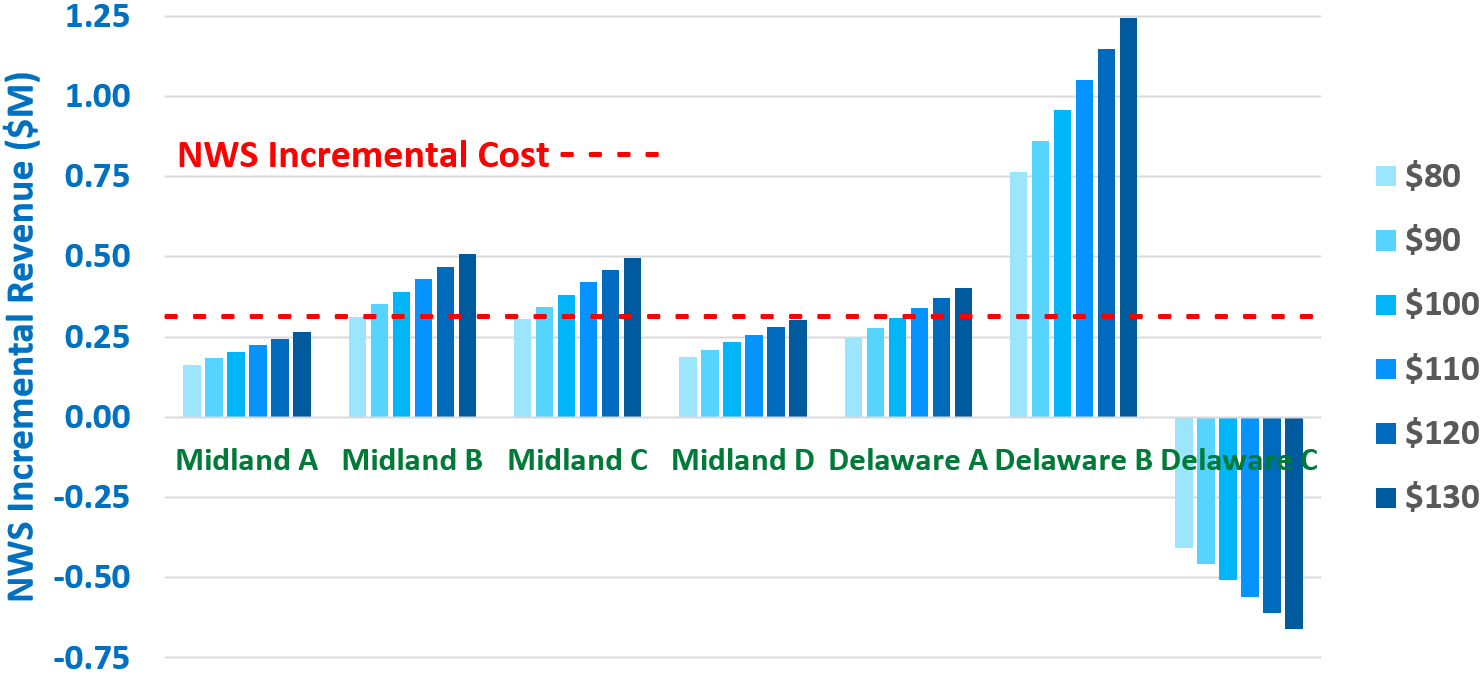
The following plot was generated by the author with the Rystad data as a starting point. The incremental revenue return of NWS was calculated based on the incremental lifetime production for wells completed with NWS proppant versus in-basin sand.
NWS Incremental Revenue Return: Estimated Lifetime Production
Author, Rystad Data
A conservative estimate of lifetime production was calculated as 2.5 times IP270 based on historical well performance studies by USGS and Rystad Energy. Clustered blue columns represent incremental revenue return on NWS at oil prices ranging from $80 to $130/bbl for each case and are labeled Midland A through the Delaware C. An average incremental cost ($0.32million) of NWS proppant vs in-basin sand was calculated from data included in the report and is represented by the red dashed line. Conservatively, the second column representing oil at $90/bbl is probably most relevant in this discussion. At lifetime volumes, the incremental revenue return of NWS with oil at $90/bbl is approaching or exceeds its incremental cost in most cases. In the final case, Delaware C, production with NWS is less than that of in-basin sand.
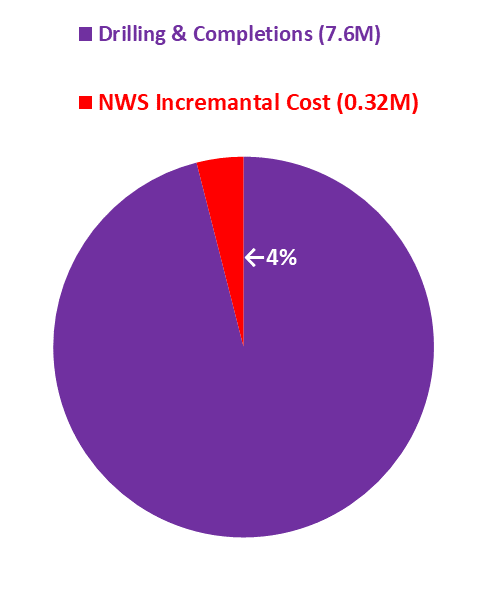
Incremental Cost of NWS Proppant vs total D&C Cost
Author, Rystad Data
It may be helpful to put the incremental cost of NWS proppant in perspective with total drilling and completions (D&C) costs. According to averages calculated from the Rystad data, the incremental cost of $0.32million for NWS proppant was 4% of total average drilling and completions cost of $7.6million. Some E&Ps are likely to consider this incremental investment a wise bet given its low cost.
The Rystad Energy report was based on oil prices substantially lower than today’s levels of over $90. This discussion has assumed oil at $90/bbl. If oil remains at current levels over $90/bbl or higher, the incremental revenue gains resulting from NWS will increase. I expect NWS incremental revenue gain to be a catalyst for some E&P’s who were compelled to switch to cheaper in-basin sand while energy prices were depressed to revert to SND’s NWS proppant.
Smart Sand operations are concentrated near prolific shale gas basins
SND provided the following map of its operations in its most recent quarterly report.
SND Locations and Operations

Smart Sand
SND has over 400 million tons of high quality NWS reserves in its Wisconsin and Illinois mines and rail terminals located in Wisconsin, Illinois, Pennsylvania, North Dakota, and Texas. SND’s concentration in the upper Midwest makes it an odd duck amongst OFS suppliers. However, its location is advantageous with respect to some of the most prolific natural gas plays in the US. EIA published the following graphics in a broad discussion of US natural gas production.
Natural Gas Production by State
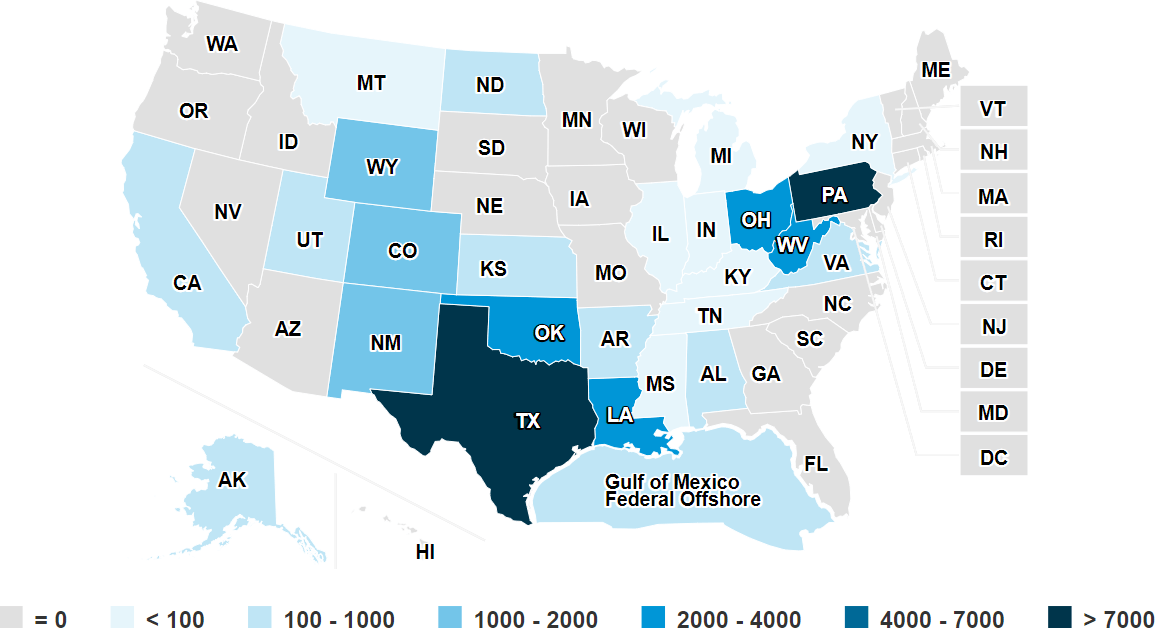
US EIA
Together, Pennsylvania and West Virginia produce 28% of US natural gas surpassing the 24% produced by Texas.
Natural Gas Production by Basin
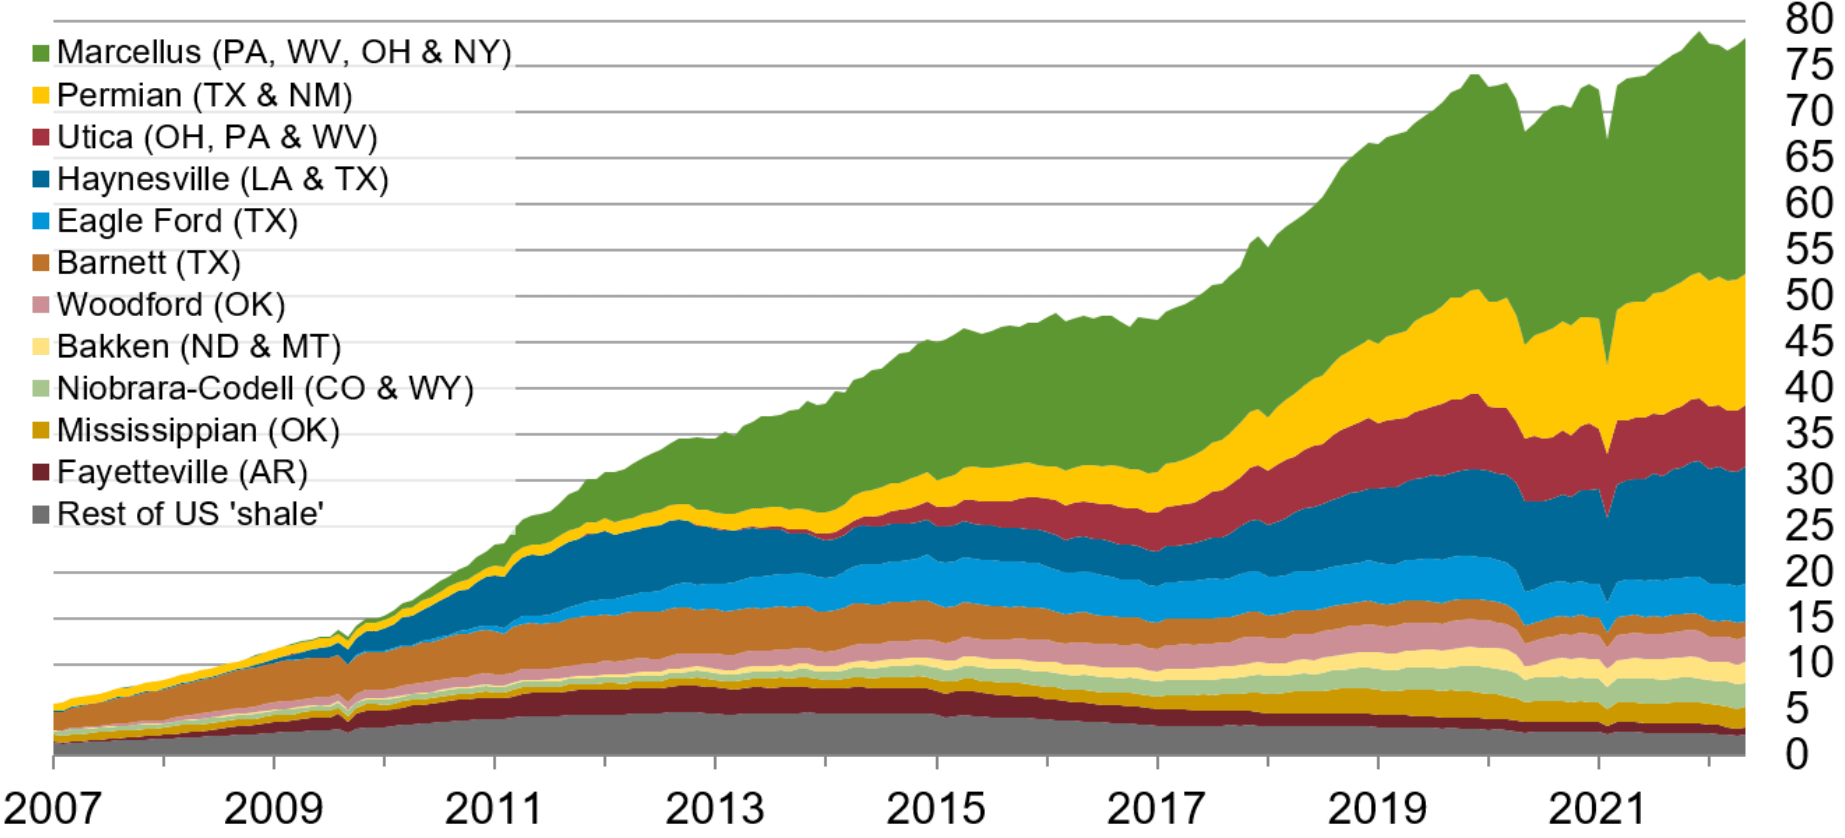
US EIA
SND’s location advantage is equally as pronounced in light of US natural gas (NG) production by Basin. The Marcellus, located in PA, WV, OH, and NY, is the single most productive NG basin in the US. The Permian (TX & NM) is second while the Utica (OH, PA, & WV) is third most productive. Together, the Marcellus and Utica basins produce more than twice as much NG as the Permian.
Natural gas prices have recovered dramatically from pandemic lows and rig counts in the Marcellus and Utica basins have responded.
Historic Basin Rig Counts and Natural Gas Price
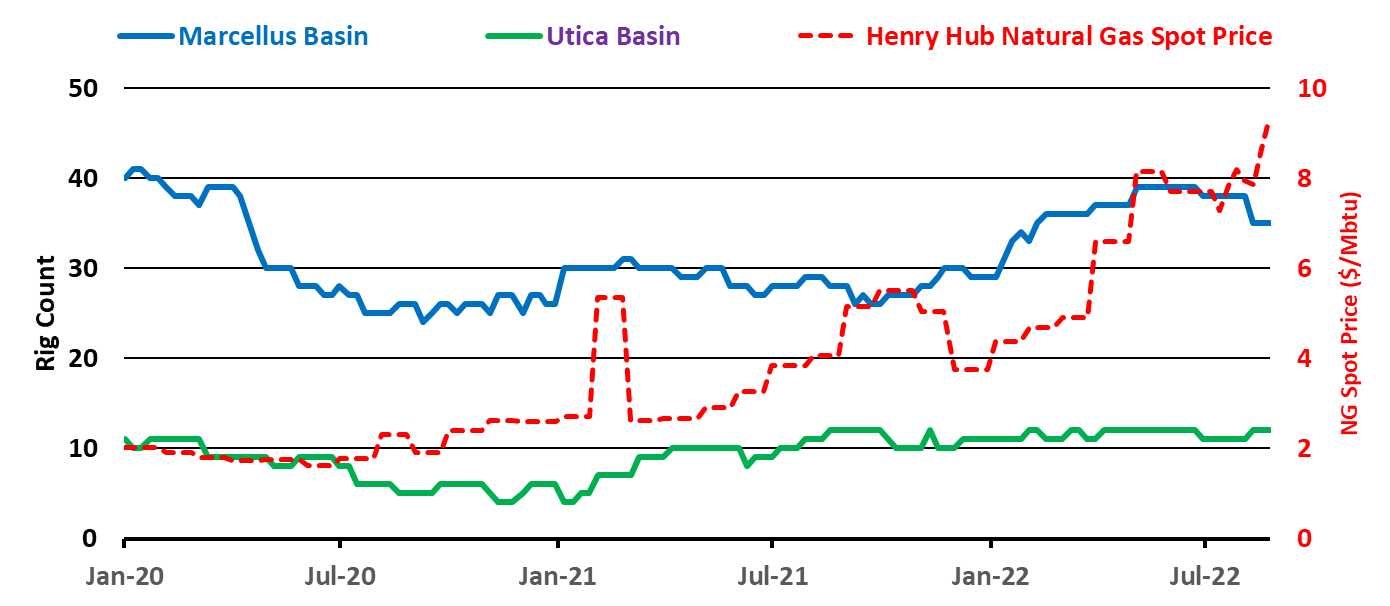
Author, Baker Hughes and Seeking Alpha Data
Rig counts in the Marcellus and Utica Basins (blue and green lines respectively) are plotted against the left axis while Henry Hub NG spot price (red dashed line) is plotted against the right axis. Rig counts in both basins, have rebounded from pandemic lows while following NG price upward. Currently, US NG prices have spiked up on low storage volumes, increased domestic demand, and growing exports to Europe. I expect rig counts in the basins most closely served by SND to respond positively.
SND price return and momentum have not yet responded to energy markets
SND: Historic Price Return
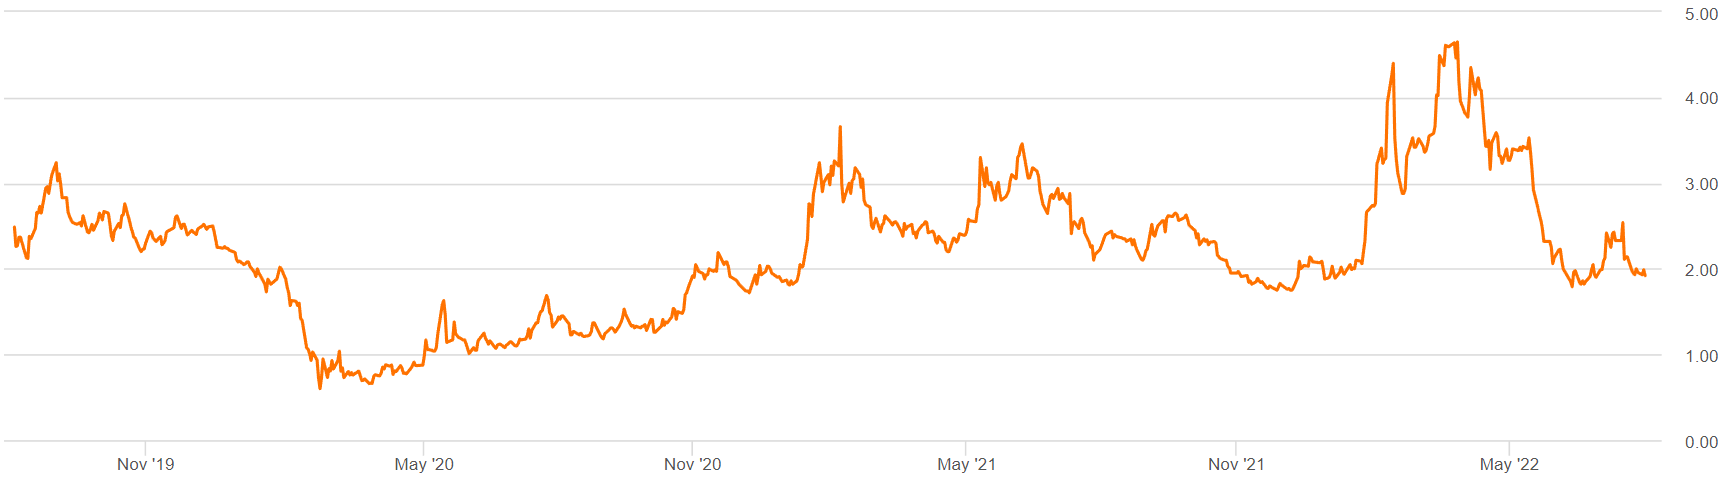
Seeking Alpha
SND reached a pandemic low of about $0.75 in March 2019 before rebounding to a peak over $3.5 in March 2021. Subsequently it declined until January 2021 before rebounding to a new high over $4.5 in March of this year. More recently, it has declined to around $1.95 in mid July and has traded sideways most recently. SND’s present valuation of about $1.95 is less than 40% of its 52 week high of $4.95. In fact SND has not been this cheap since February, 2021.
SND: Momentum
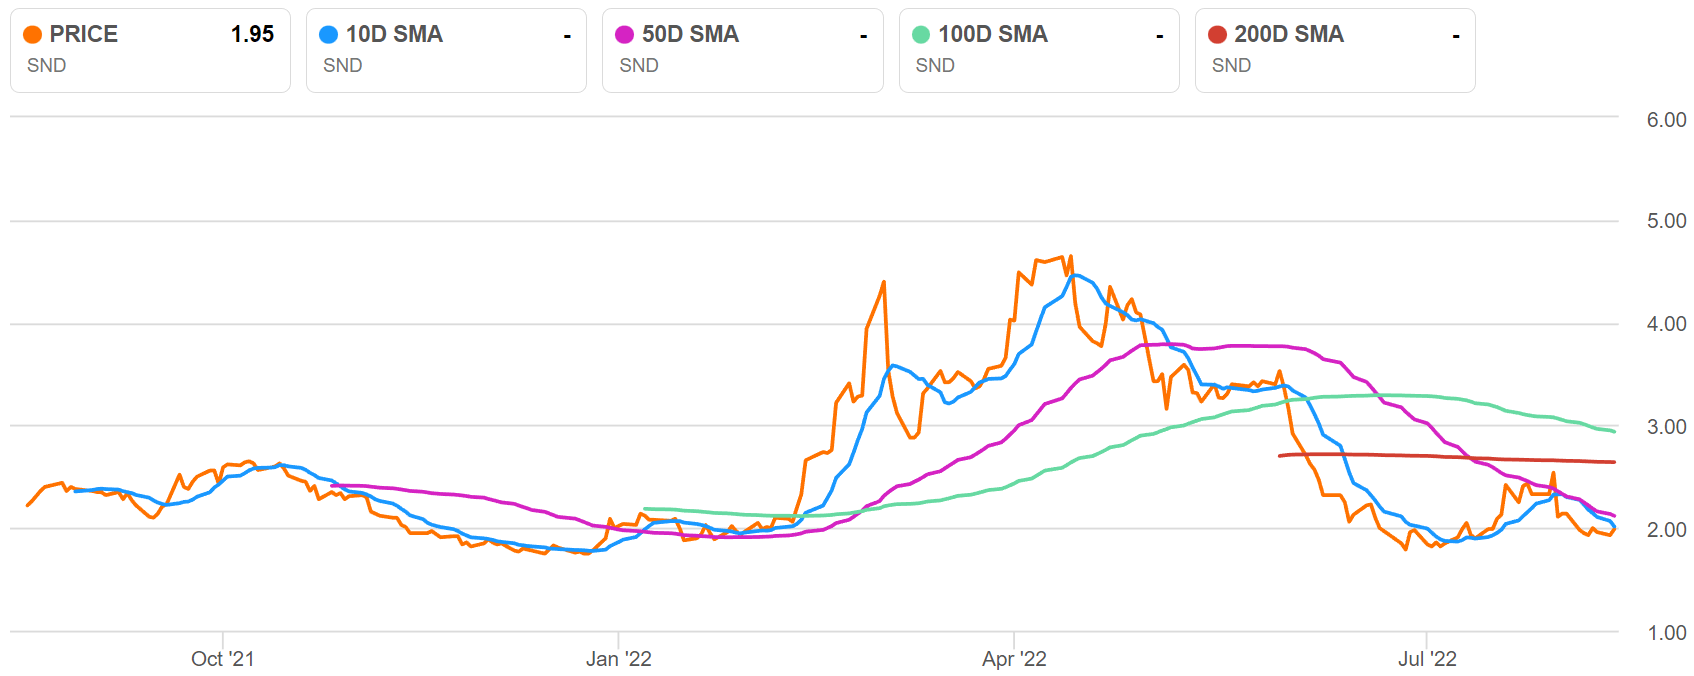
Seeking Alpha
Currently SND is well below its 200 and 100 day moving averages and slightly below its shorter term 50 day and 10 day moving averages. Recently, the market has not found much to be excited about in SND. I expect that to change soon as E&Ps take advantage of the incremental returns of SND’s superior proppant.
EPS and revenue are responding to the market, so far estimates are not
SND EPS, revenue and estimates
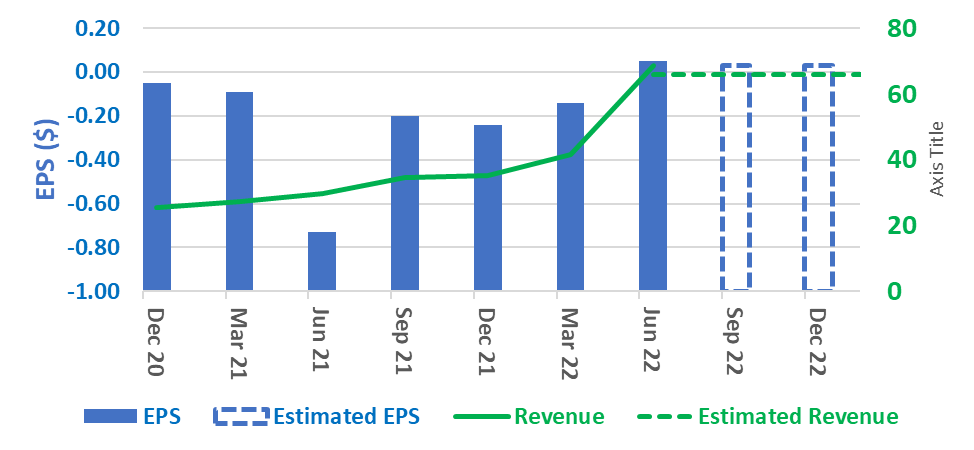
Author, Seeking Alpha Data
SND EPS and revenue have rebounded sharply through 4 consecutive quarters without much response from the market. It would also appear that SND analysts have not paid much attention to recent news as estimated EPS and revenue are flat going forward. Recent coverage by Bloomberg and news by Reuters note that frac sand prices have more than doubled from about $22 to about $55/ton since the end of 2021. Demand for frac sand is spiking as E&P’s respond to rebounding energy markets.
According to its CEO, U.S. Silica Holdings (SLCA) – the largest publicly traded frac sand supplier is sold out. I expect the market to wake up to SND’s unrecognised potential soon, but hopefully not before the most attentive investors (this author and his readers) buy SND or add to current positions.
SND and SLCA: recent price return diverge
SND’s closest competitor is SLCA, but they are not exactly comparable. SND is has a market cap of $81.5M while SLCA is has a market cap almost 14 times greater at 1.11B. SND is a nearly pure play on frac sand markets. SLCA revenue is split 50/50 between frac sand and industrial/specialty products according to SEC filings.
Recent price return: SND and SLCA
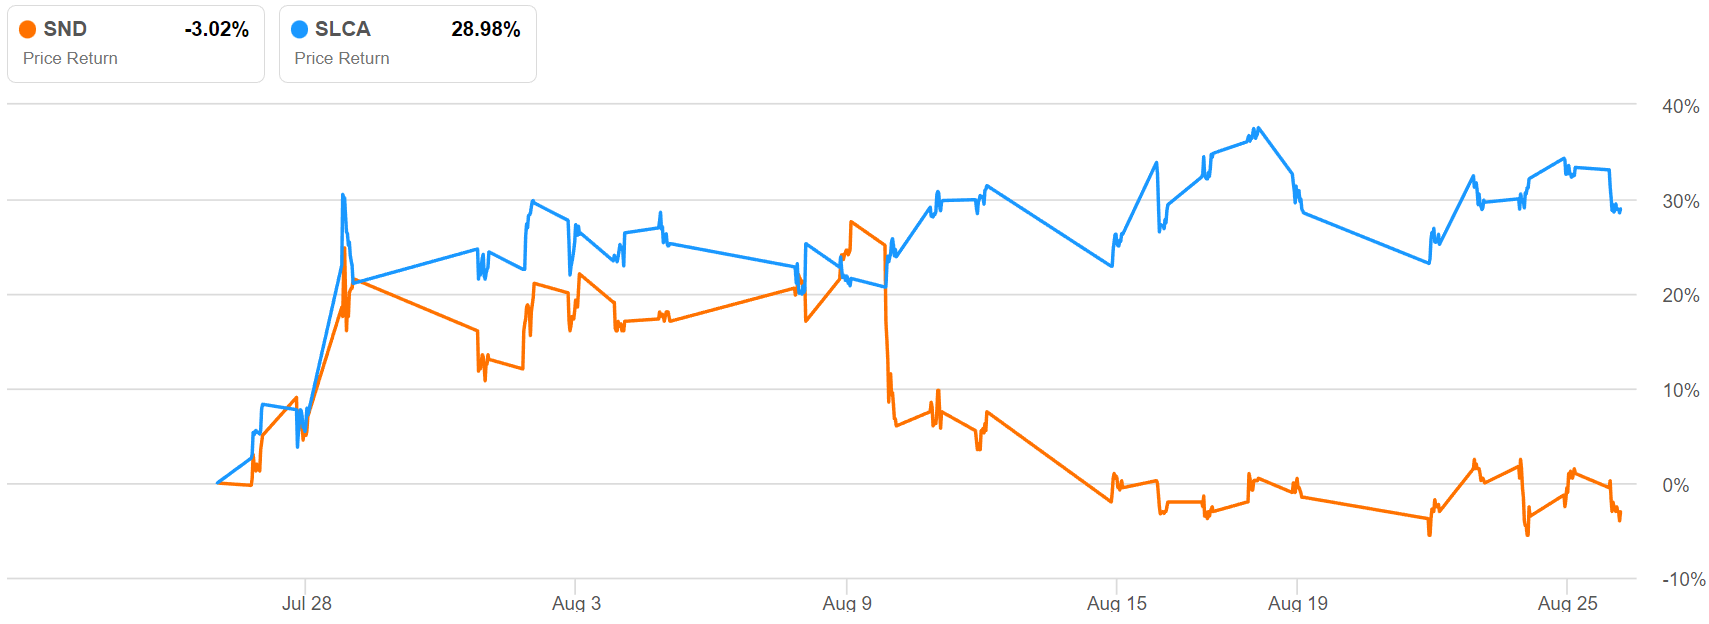
Seeking Alpha
Over the past month, SND and SLCA price return have diverged with SND losing about 3% while SLCA gained almost 30%.
Market reactions to similar earnings news were inexplicably different. SLCA reported a solid EPS and revenue beat on July 29th. On August 9th, SND released its latest quarterly report with results beating estimates soundly. GAAP EPS of $0.00 beat estimated EPS by $0.05. Revenue of $68.7M (+131.9% Y/Y) clobbered estimated revenue of $54.1M by $14.6M (more than 25%). Oddly, SND dropped sharply the following day; it would appear investors were not impressed. I think SND’s recent price return vs SLCA has only added more value.
SND potential comes with risk
The current up-cycle in energy markets began with the dramatic pandemic induced dip in April 2020, and it’s uncertain if the peak has been reached or how long oil and gas prices will remain elevated. Demand destruction and recession are both risks across the entire oil and gas sector. Oil and gas markets are volatile and subject to fear and speculation. Recession, or even continued fear of recession, could drive energy markets down.
SND is a small oil field supplier with a product, NWS, that is nearly its only revenue source and costs more than its alternative, in-basin sand. I believe asymmetric alpha with SND is likely based on incremental return on its superior proppant, NWS. However, E&P’s may continue to favor in-basin sand. Investors would be wise to add a proportional sand position to a well built portfolio.
Final thoughts, recent discussions with SND investor relations, and recommendation
Based on SND’s current price vs its 52 week high and momentum, SND is an exceptional value. Momentum indicates that the market does not see much potential in SND; I disagree. I see SND as a supplier with a superior product and a potent catalyst. With elevated energy prices, the incremental return of SND’s proppant is often equal to or greater than its incremental cost. E&Ps do not stay in business through epic down turns to subsequently report record revenues and profits by ignoring data. I think E&P economic analysts and completion engineers are looking at similar data to that presented here and drawing similar conclusions.
Recent discussions between this author and SND investor relations reinforce the positive quarterly results. According to those discussions, SND saw a significant demand increase from 1Q22 to 2Q22. Further, SND is capturing new customers and expanding its margin with contribution/ton expected to remain strong and even grow next quarter. Per SND’s most recent investor presentation, margin contribution has already almost tripled from $1.36/ton in 1Q21 to $4.99/ton in 1Q22.
I suspect the broader market sees a small oil field supplier with a volatile stock that has failed to hold onto gains in the last 2 years. I see an under appreciated small cap with a potent catalyst. The incremental return on SND’s Northern White Sand Proppant is often greater than its incremental cost over the lifetime production of a well. I strongly recommend investors buy SND at current market prices.
you can’t start a fire without a spark… – The Boss speaking on a similarly potent catalyst
Be the first to comment