

ryasick
Texas Instruments Inc. (Nasdaq: TXN) is a leading semiconductor company headquartered in Dallas, Texas. The $150B+ market cap company designs, manufactures, and sells analog and embedded processing chips. For Q4 2022, TXN expects revenue to be between $4.4-$4.8B. This implies 2022 revenue of between $19.7-$20.1B, a year-over-year increase of 8.4%. The company has been reporting solid earnings. In the latest quarter, October 2022, the company earned $2.47 per share, towards the higher end of its guidance. TXN has a proven track record of returning cash to shareholders. Despite a challenging demand environment, the management reiterated their commitment to returning cash to shareholders in its latest earnings call, paying stockholders $1.1B of cash dividends and repurchasing $1B in common stock. TXN also announced a 8% increase in quarterly dividend (from $1.15 to $1.24), the 19th consecutive year of dividend raise. It also raised its share repurchase authorizations by an additional $15 billion.
Methodology
Risk Research identifies quality income securities based on their financial statement trends, with particular emphasis on free cash flow. We then identify buy points based on the premise that all securities fluctuate in price, and those patterns often repeat. Risk increases as prices rise, and falls as prices decline, particularly in high-quality stocks not prone to major idiosyncratic downside moves. Based on this process, TXN’s current price entails very high short term risk. We sold our position November 15 at $180.48. We write these reports in advance of attractive pricing in order to be prepared when they manifest, particularly should the market undergo a significant one-day price drop.
We’re currently following 31 stocks, ETFs and royalty trusts. We analyze, in depth, the financial statement trends and characteristics of these (not the ETFs of course – that analysis relies exclusively on payout growth rate and consistency) to determine quality:
- Free cash flow consistency and growth, return on assets, liquidity and debt trends.
- Dividend growth, safety (coverage by free cash flow), and yield.
In particular, we avoid companies that pay their dividends out of increased debt. That’s surprisingly common, particularly in REITs.
Free Cash Flow, Return on Assets, Debt
We favor graphs over words, and free cash flow, or owner earnings, over GAAP earnings or EBITDA. EBITDA is a travesty. If you doubt that, search Google for what Charlie Munger and Warren Buffett have to say about EBITDA.
Here’s the chart of two of three crucial measures of business health (the other being balance sheet trends which appears a couple of graphs down in this article), free cash flow and return on assets (margins as a percent of sales, sales as a percent of assets).
TXN Return On Assets (www.dividendrisk.com)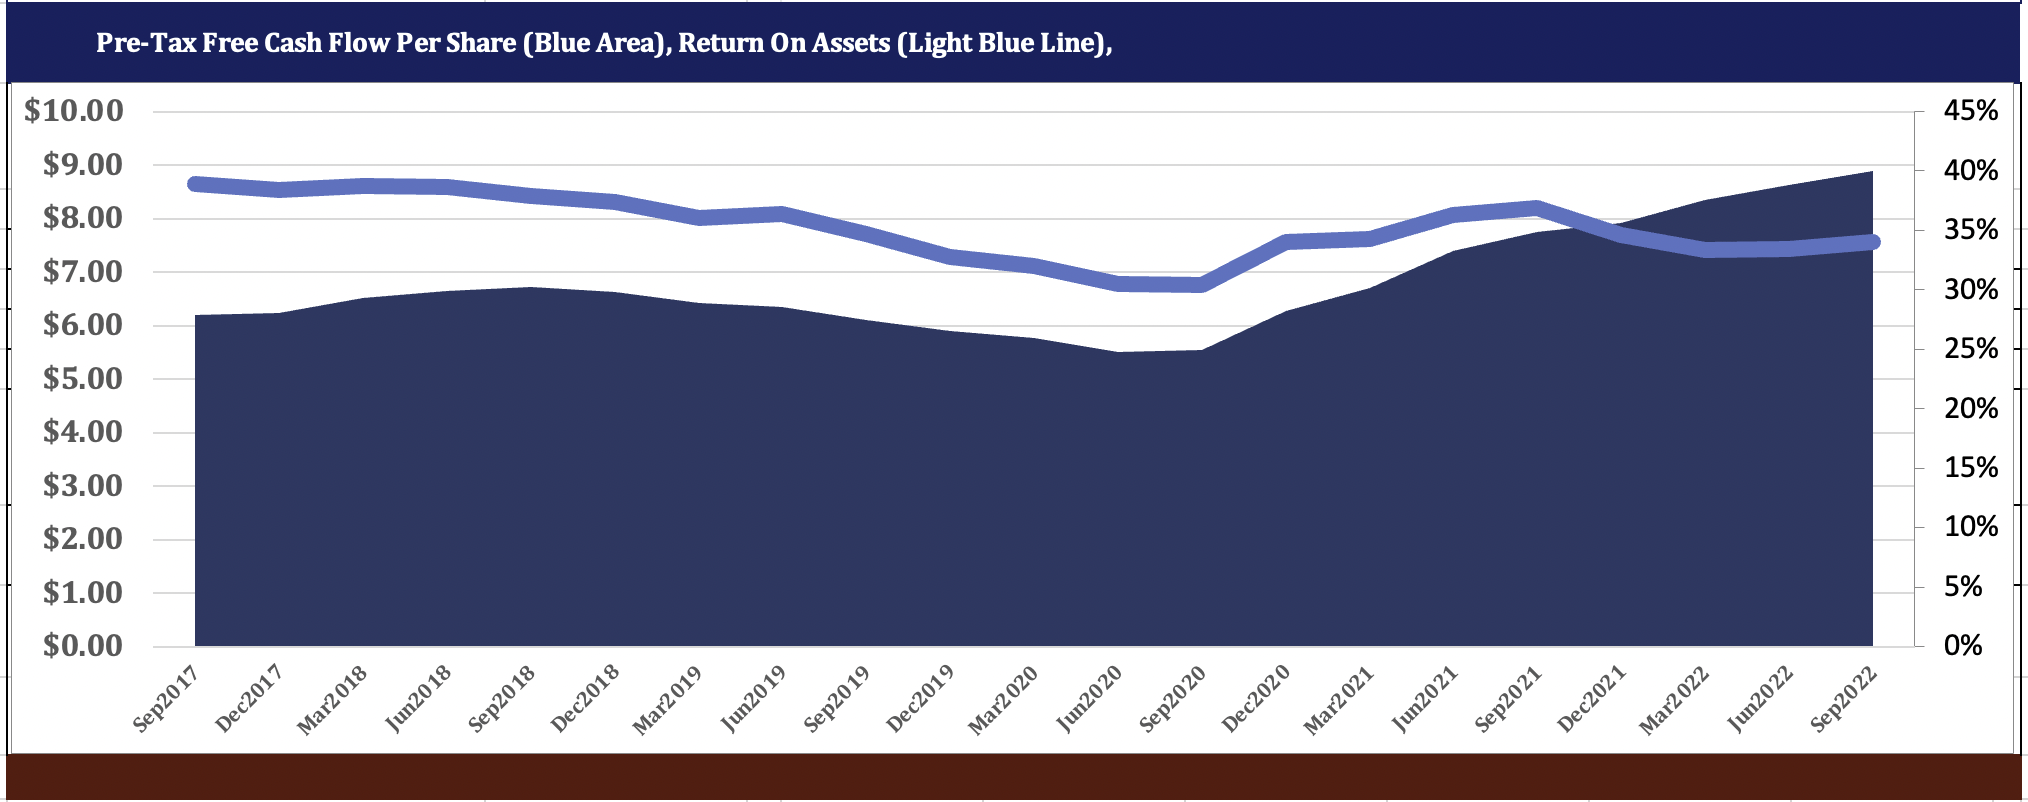
While TXN’s return on assets has declined slightly over the past twelve months, it remains significantly higher than the average of 1.5% of all public companies. The ability to generate free cash flow at that level is rare and indicative of competitive advantage. Margins (gross margin, operating margin and FCF margin) are stable, offset by somewhat erratic asset turnover. This indicates that when TXN experiences competitive price pressure, it reduces production rather than cuts prices.
TXN Return On Assets Analysis (www.dividendrisk.com)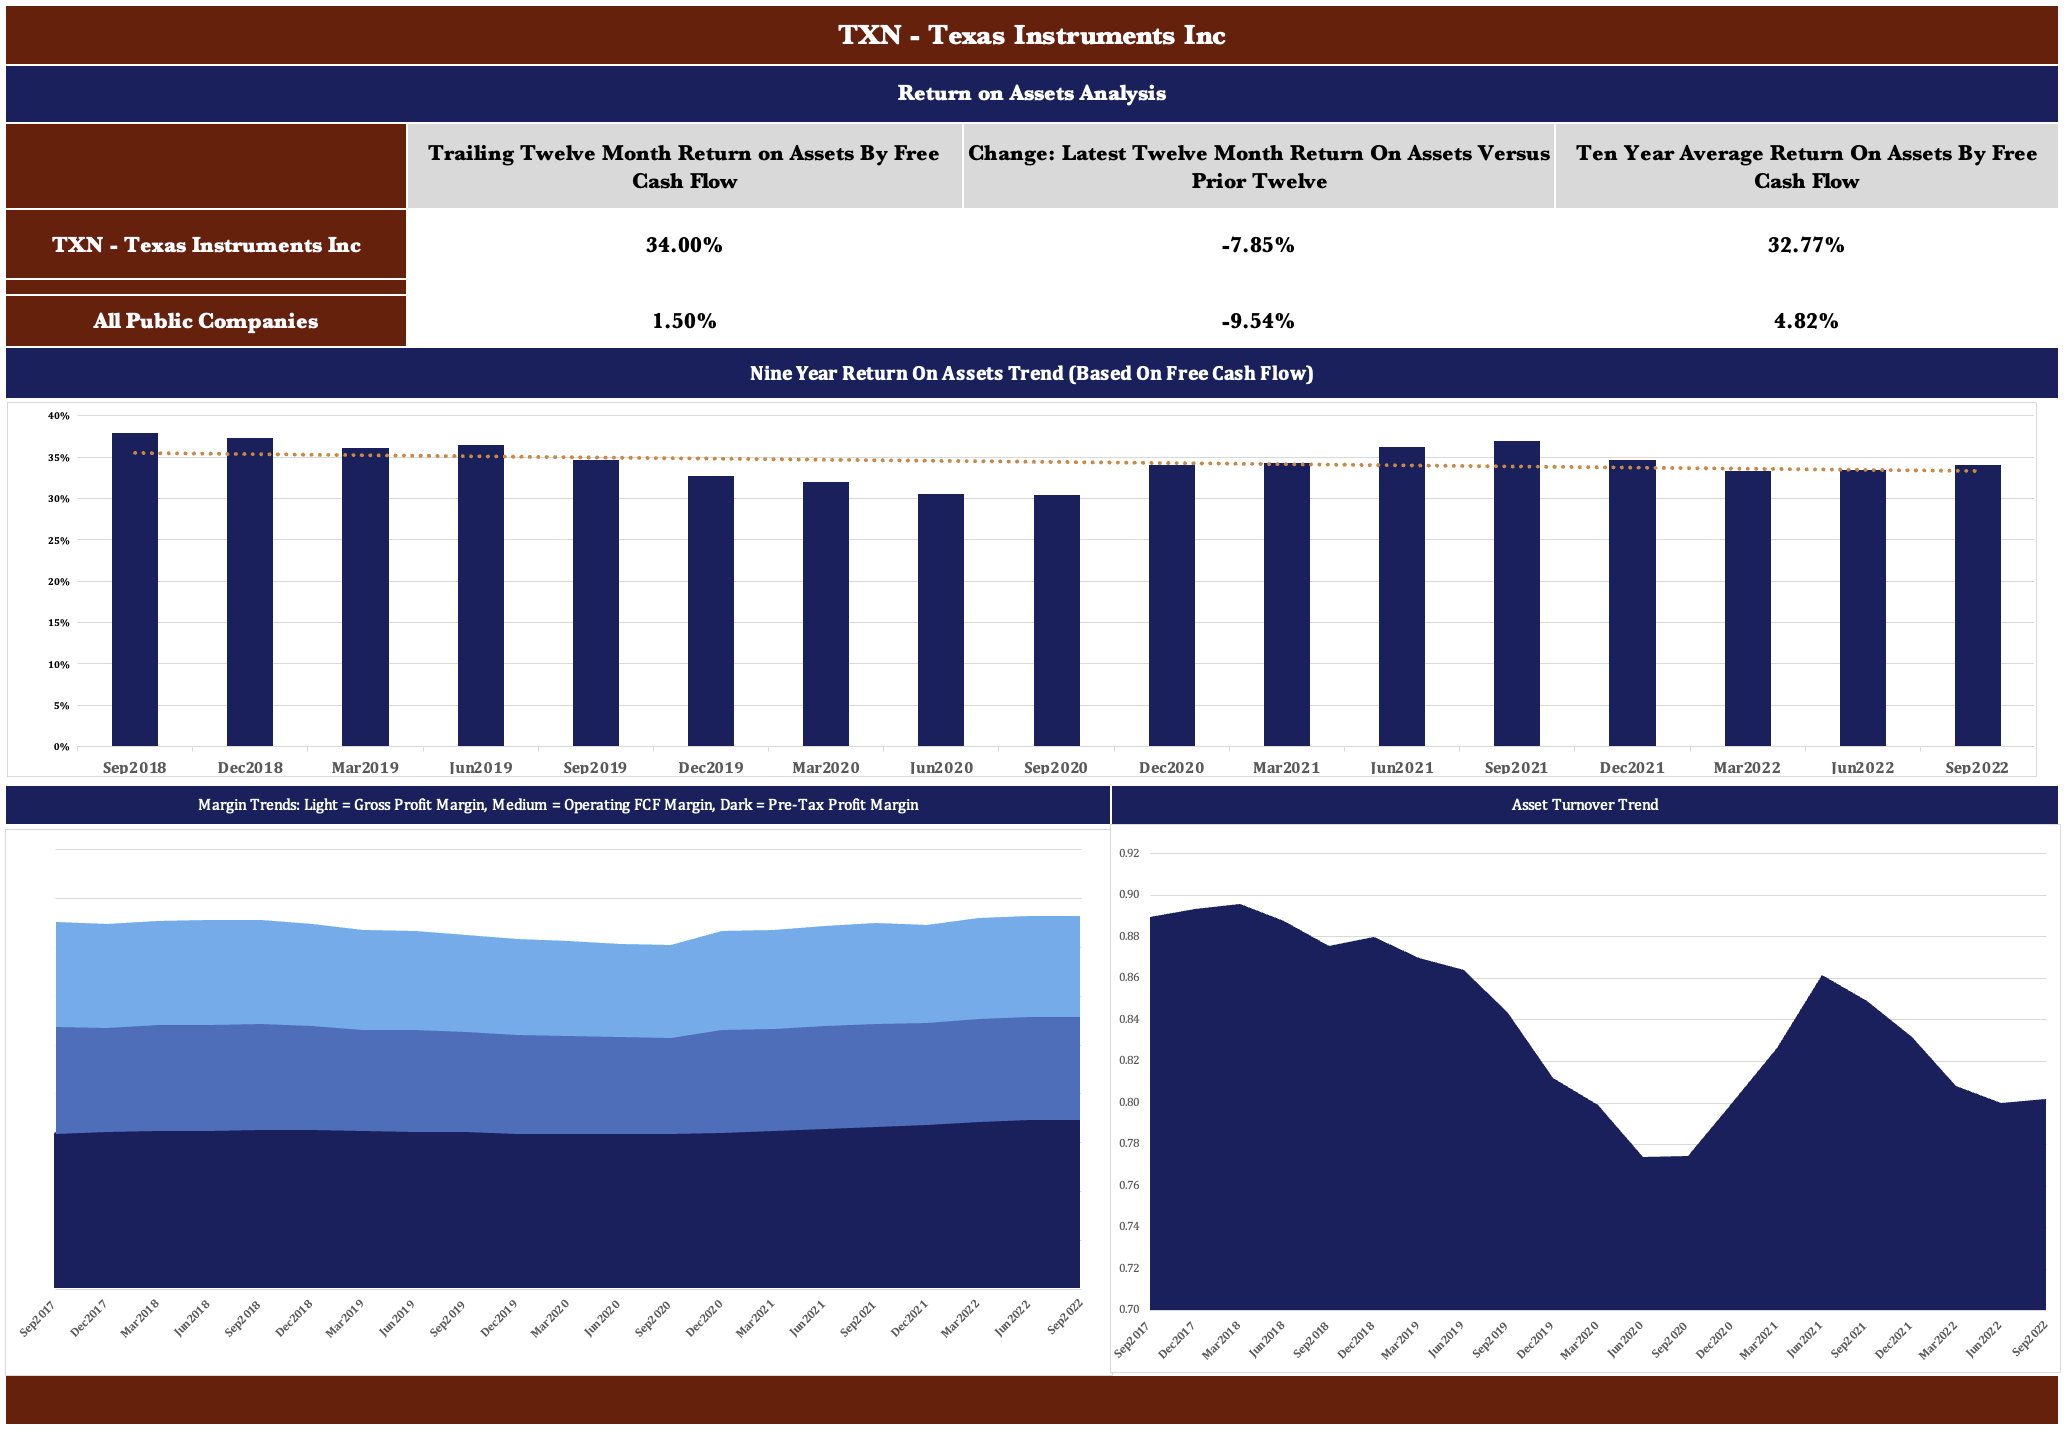
Overall, TXN’s balance sheet strength is exceptional as indicated by its low debt to fixed capital ratio, high equity to debt ratio and high cash to long-term debt ratio. The company is conservatively financed with debt at just 0.45% of fixed capital. Cash as a percentage of long-term debt is 78.7%, indicating more than adequate liquidity.
TXN Financial Strength (www.dividendrisk.com)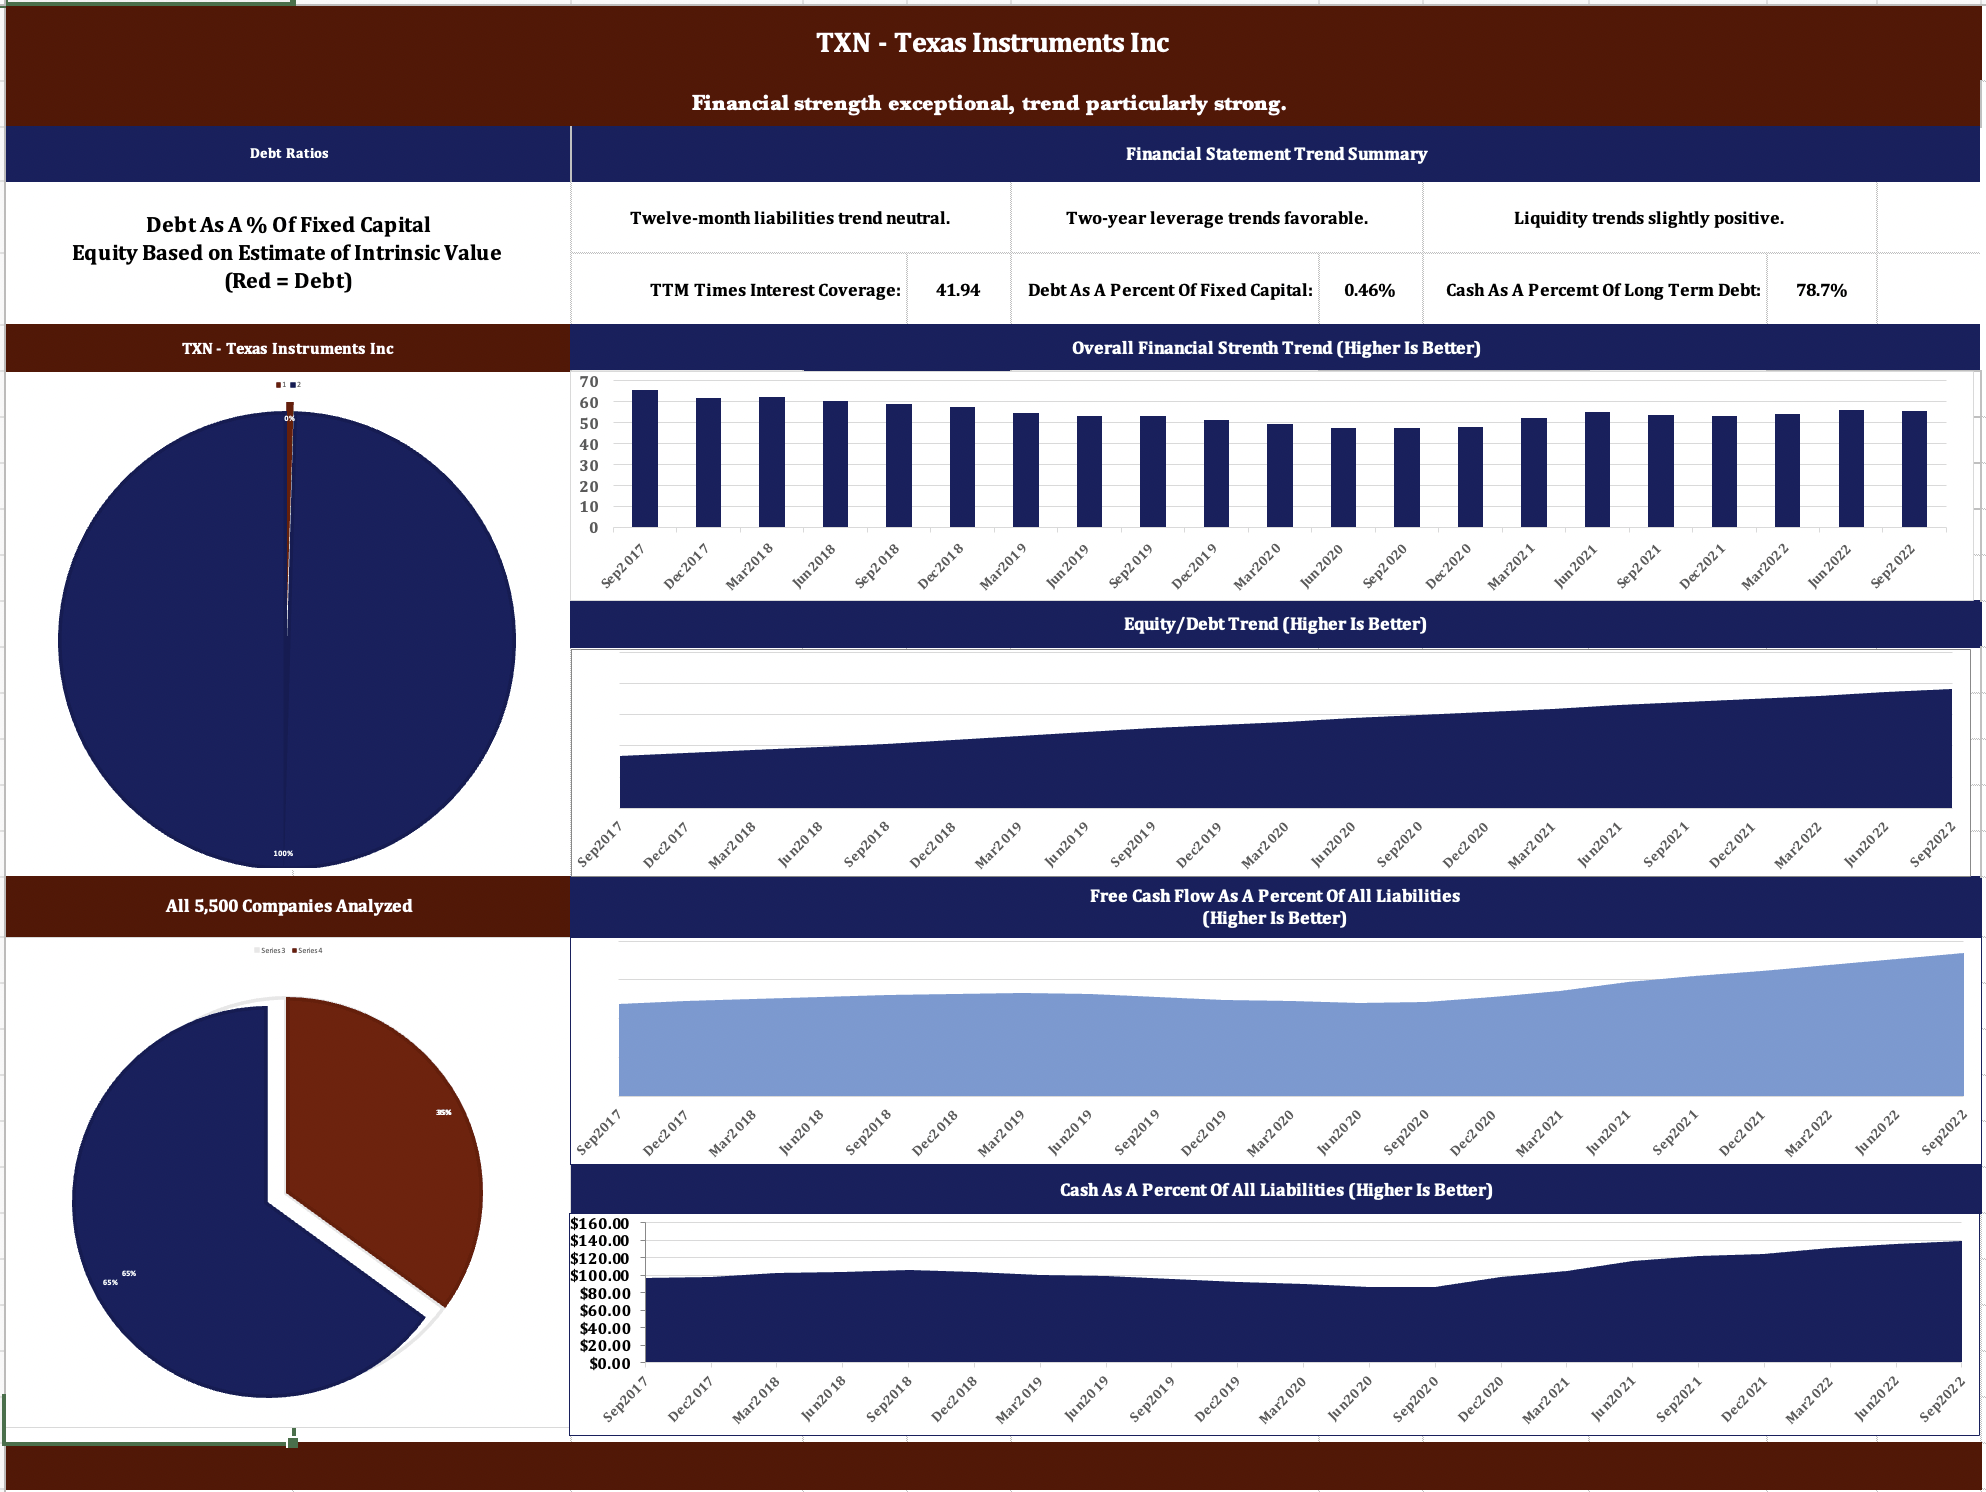
Texas Instruments balance sheet, both in current situation and trend, is exceptional. Now for profitability trends:
TXN Profitability (www.dividendrisk.com)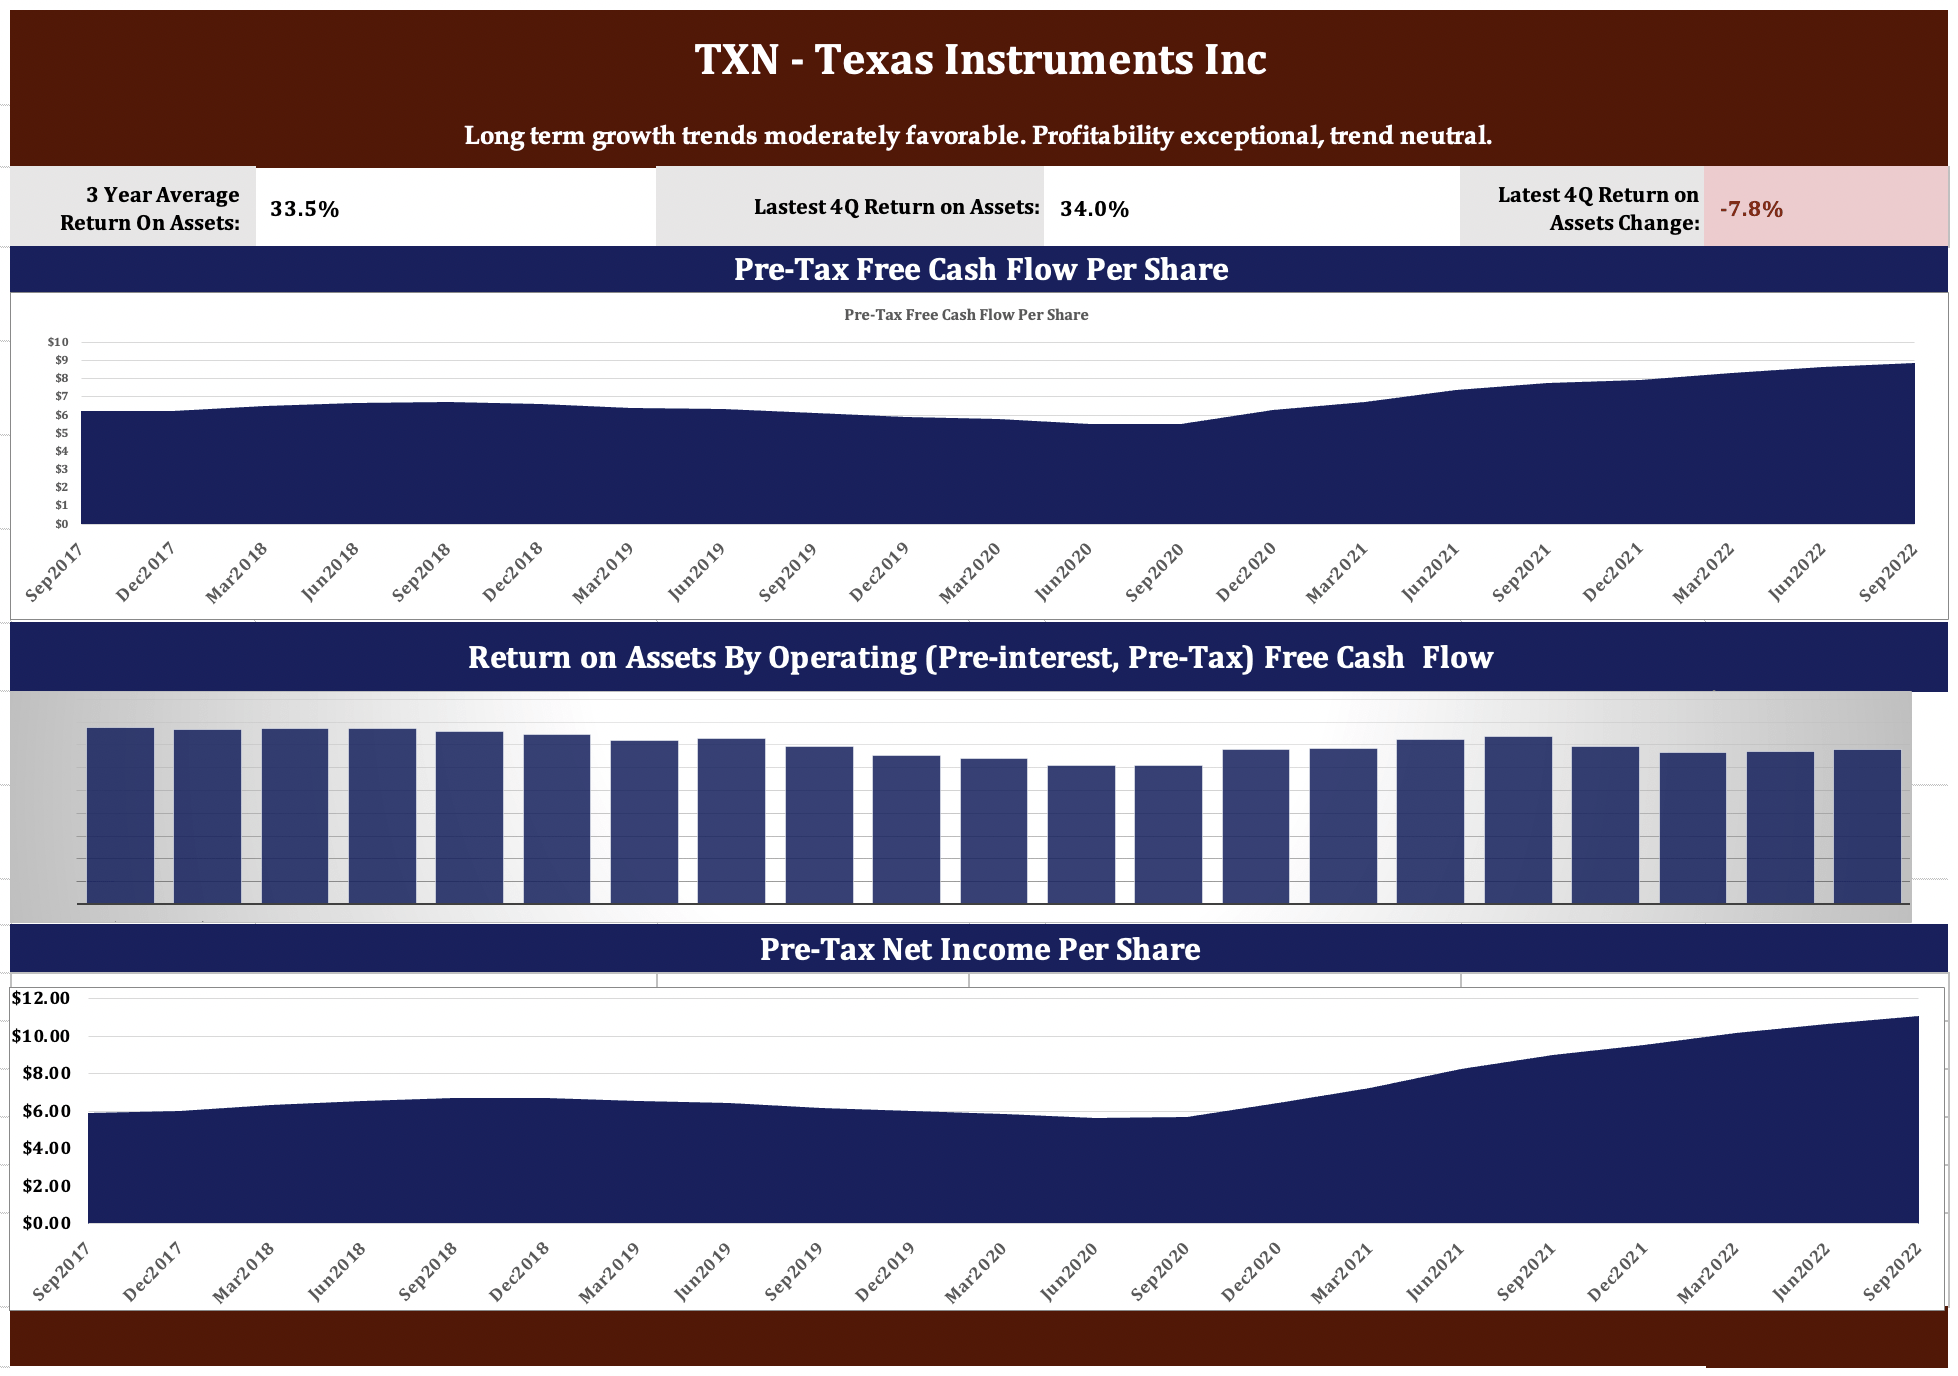
Finally, taking a microscope to most recent trends, profitability continues to improve, just not at as high a rate as it was a few quarters ago. Financial strength is stable. Overall, not much to see here.
Texas Instruments Recent Momentum (www.riskresearch.com)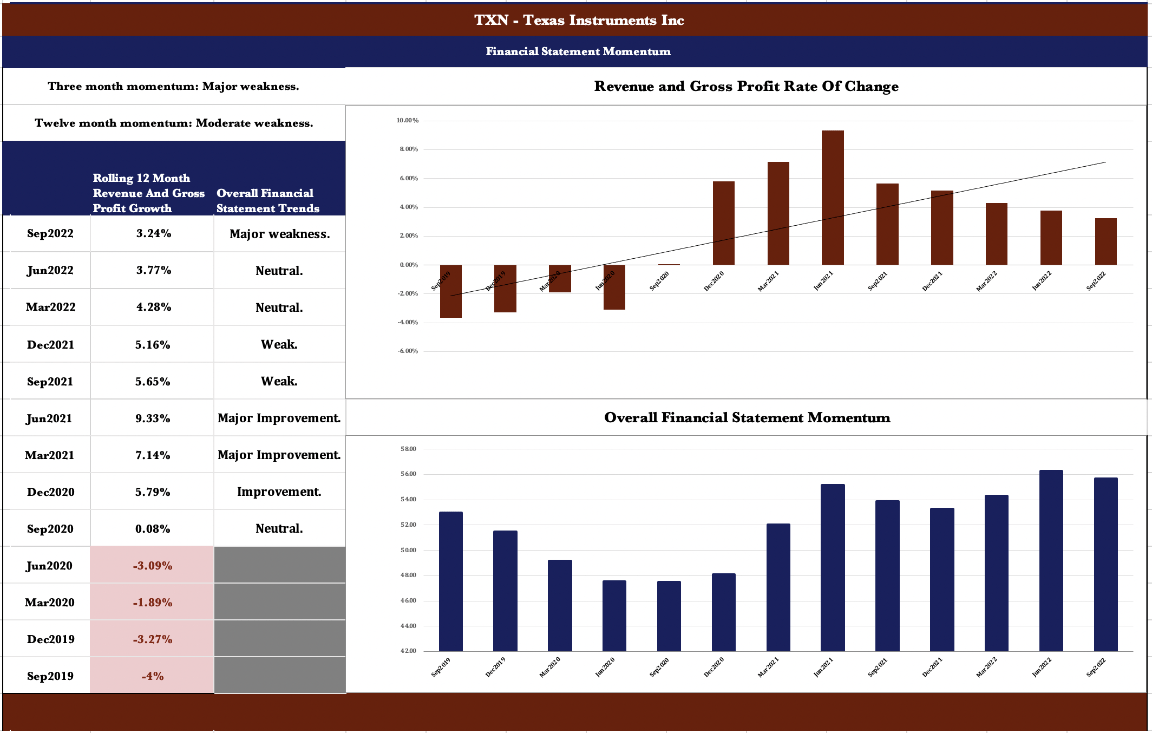
Intrinsic Value
Intrinsic value and related subjects are frequently discussed but rarely understood, at least in terms of significance. When analysts use the term “intrinsic value”, it is rarely clear what they are talking about. Liquidation value, value to a competitor in an acquisition, value in March 2020, value a year ago at the market high – all of these are radically different and an average of them approaches meaninglessness. Buying at steep discounts to intrinsic value concentrates an investor’s portfolio on the vast majority of mediocre or poorly run companies. Top performers tend to be concentrated among companies with high valuations in relation to common yardsticks such as earnings, book value and sales.
Regardless, an investor should probably at least try, if for no other reason than as a yardstick against which to compare debt levels. We calculate 10-year average stock price to FCF, revenues, dividends, and GAAP earnings, and then identify the measure that has been the most reliable predictor of future stock price. In the case of TXN, that has been revenues, which have been accurate to within 2.3%, indicating a value of $182.88/share. Thus, in our opinion, TXN currently trades at fair value. Below, another page from our financial statement trend analysis:
Texas Instruments Intrinsic Value (www.dividendrisk.com)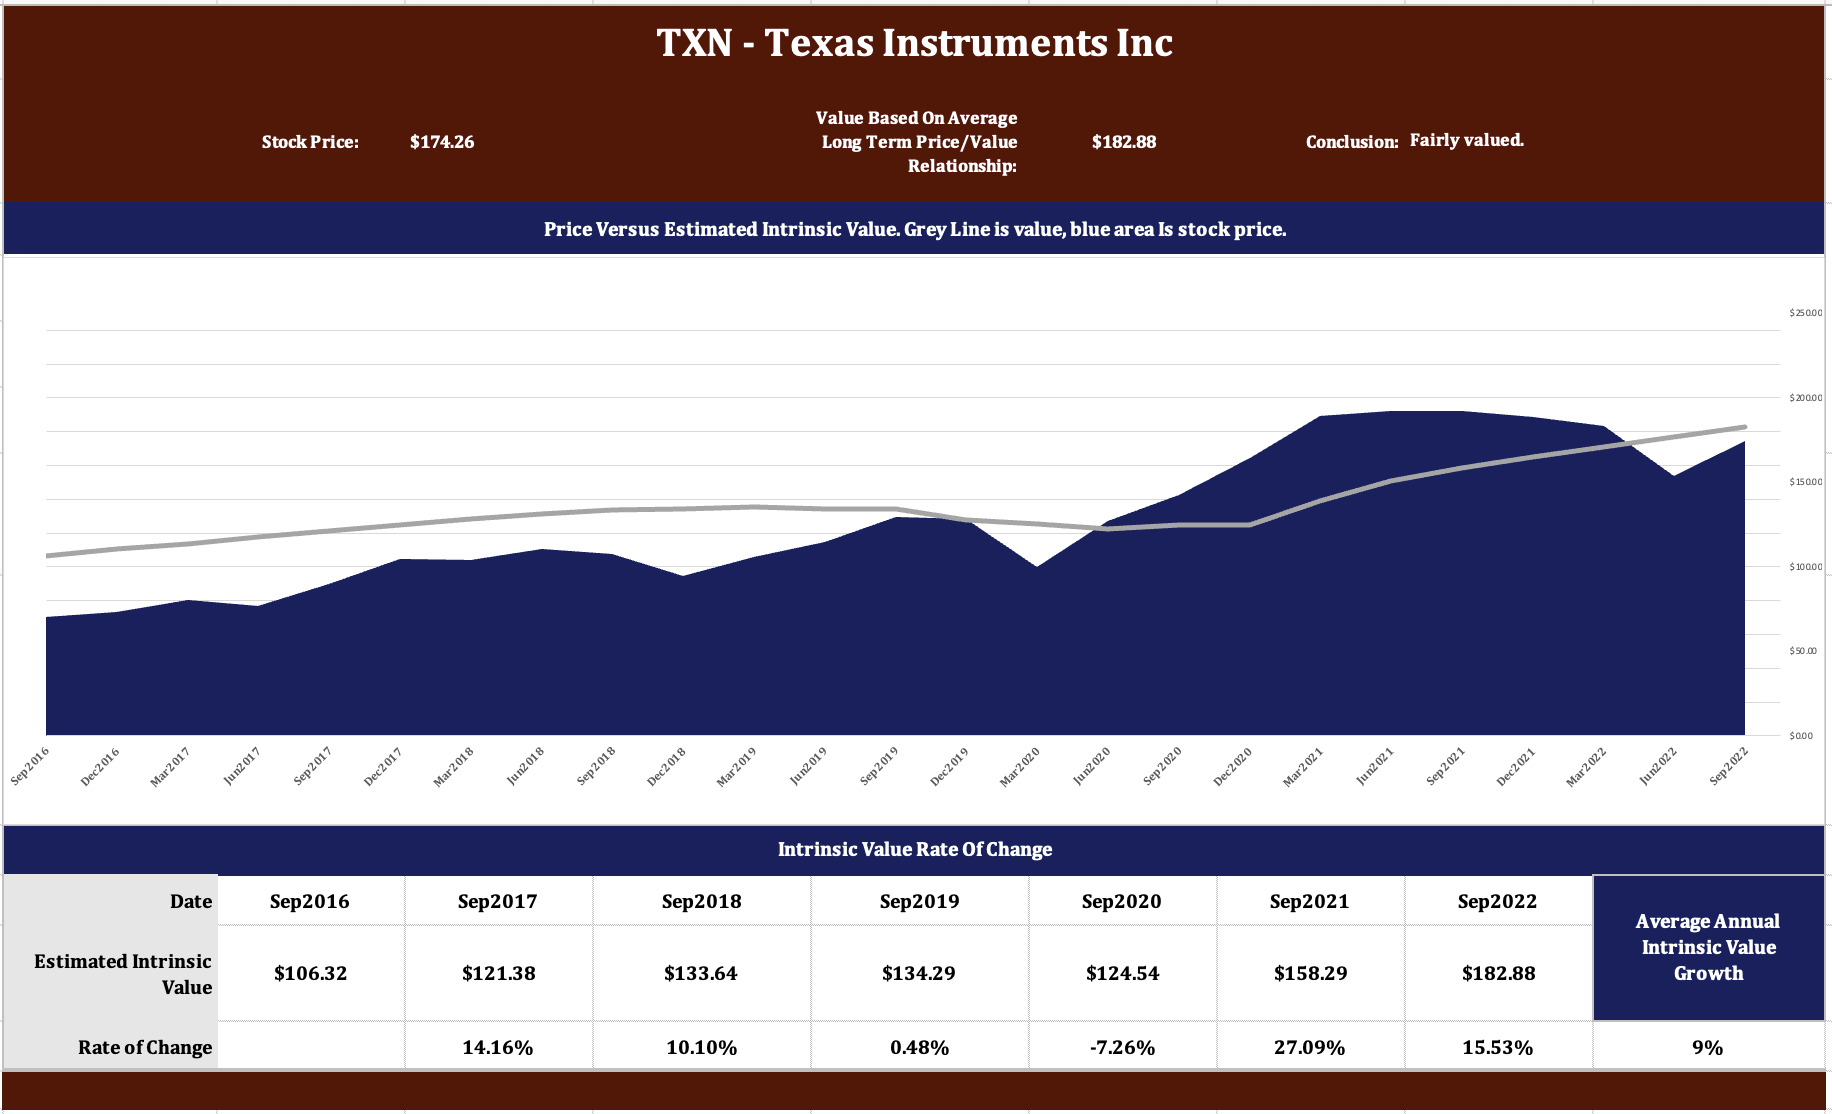
The Dividend
TXN’s dividend growth compound annual growth rate ((or CAGR)) of 23.24% in the past 10 years, 17.21% in the past five years and 12.75% in the last twelve months is slowing but still strong. The current dividend is $4.69/share.
TXN Dividend CAGR (Company report)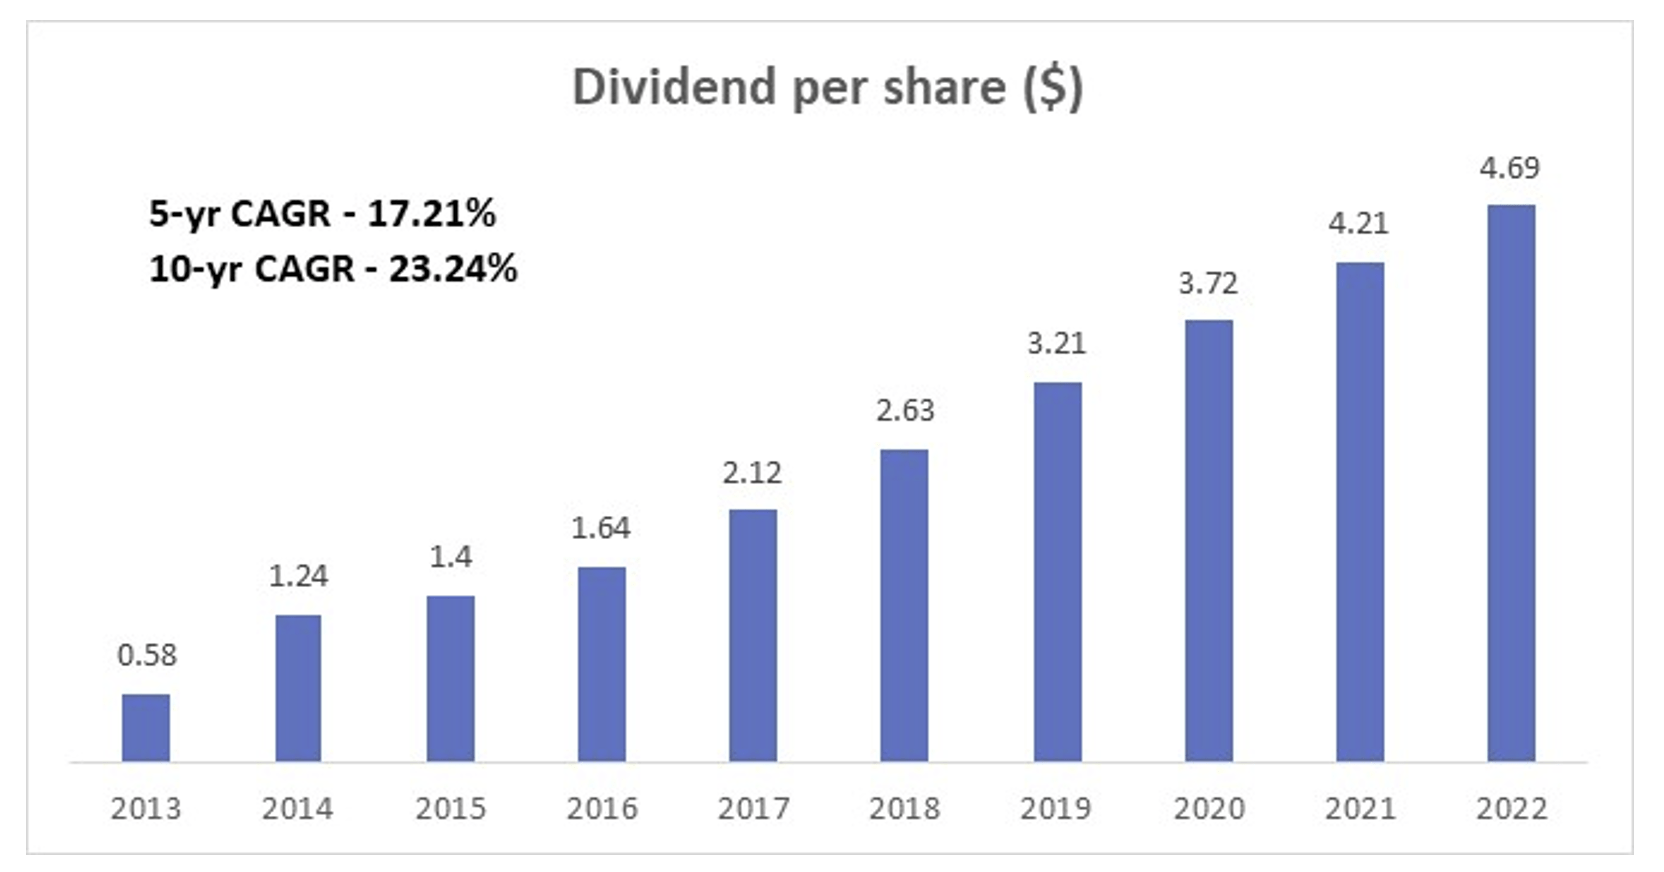
Continued dividend increases appear likely. In the chart below, notice that TXN’s one year after tax FCF per share grew 14.70%, higher than dividend growth rate at 12.75%. The dividend was covered by FCF by 205% over the last two years.
Texas Instruments Dividend Coverage (www.dividendrisk.com)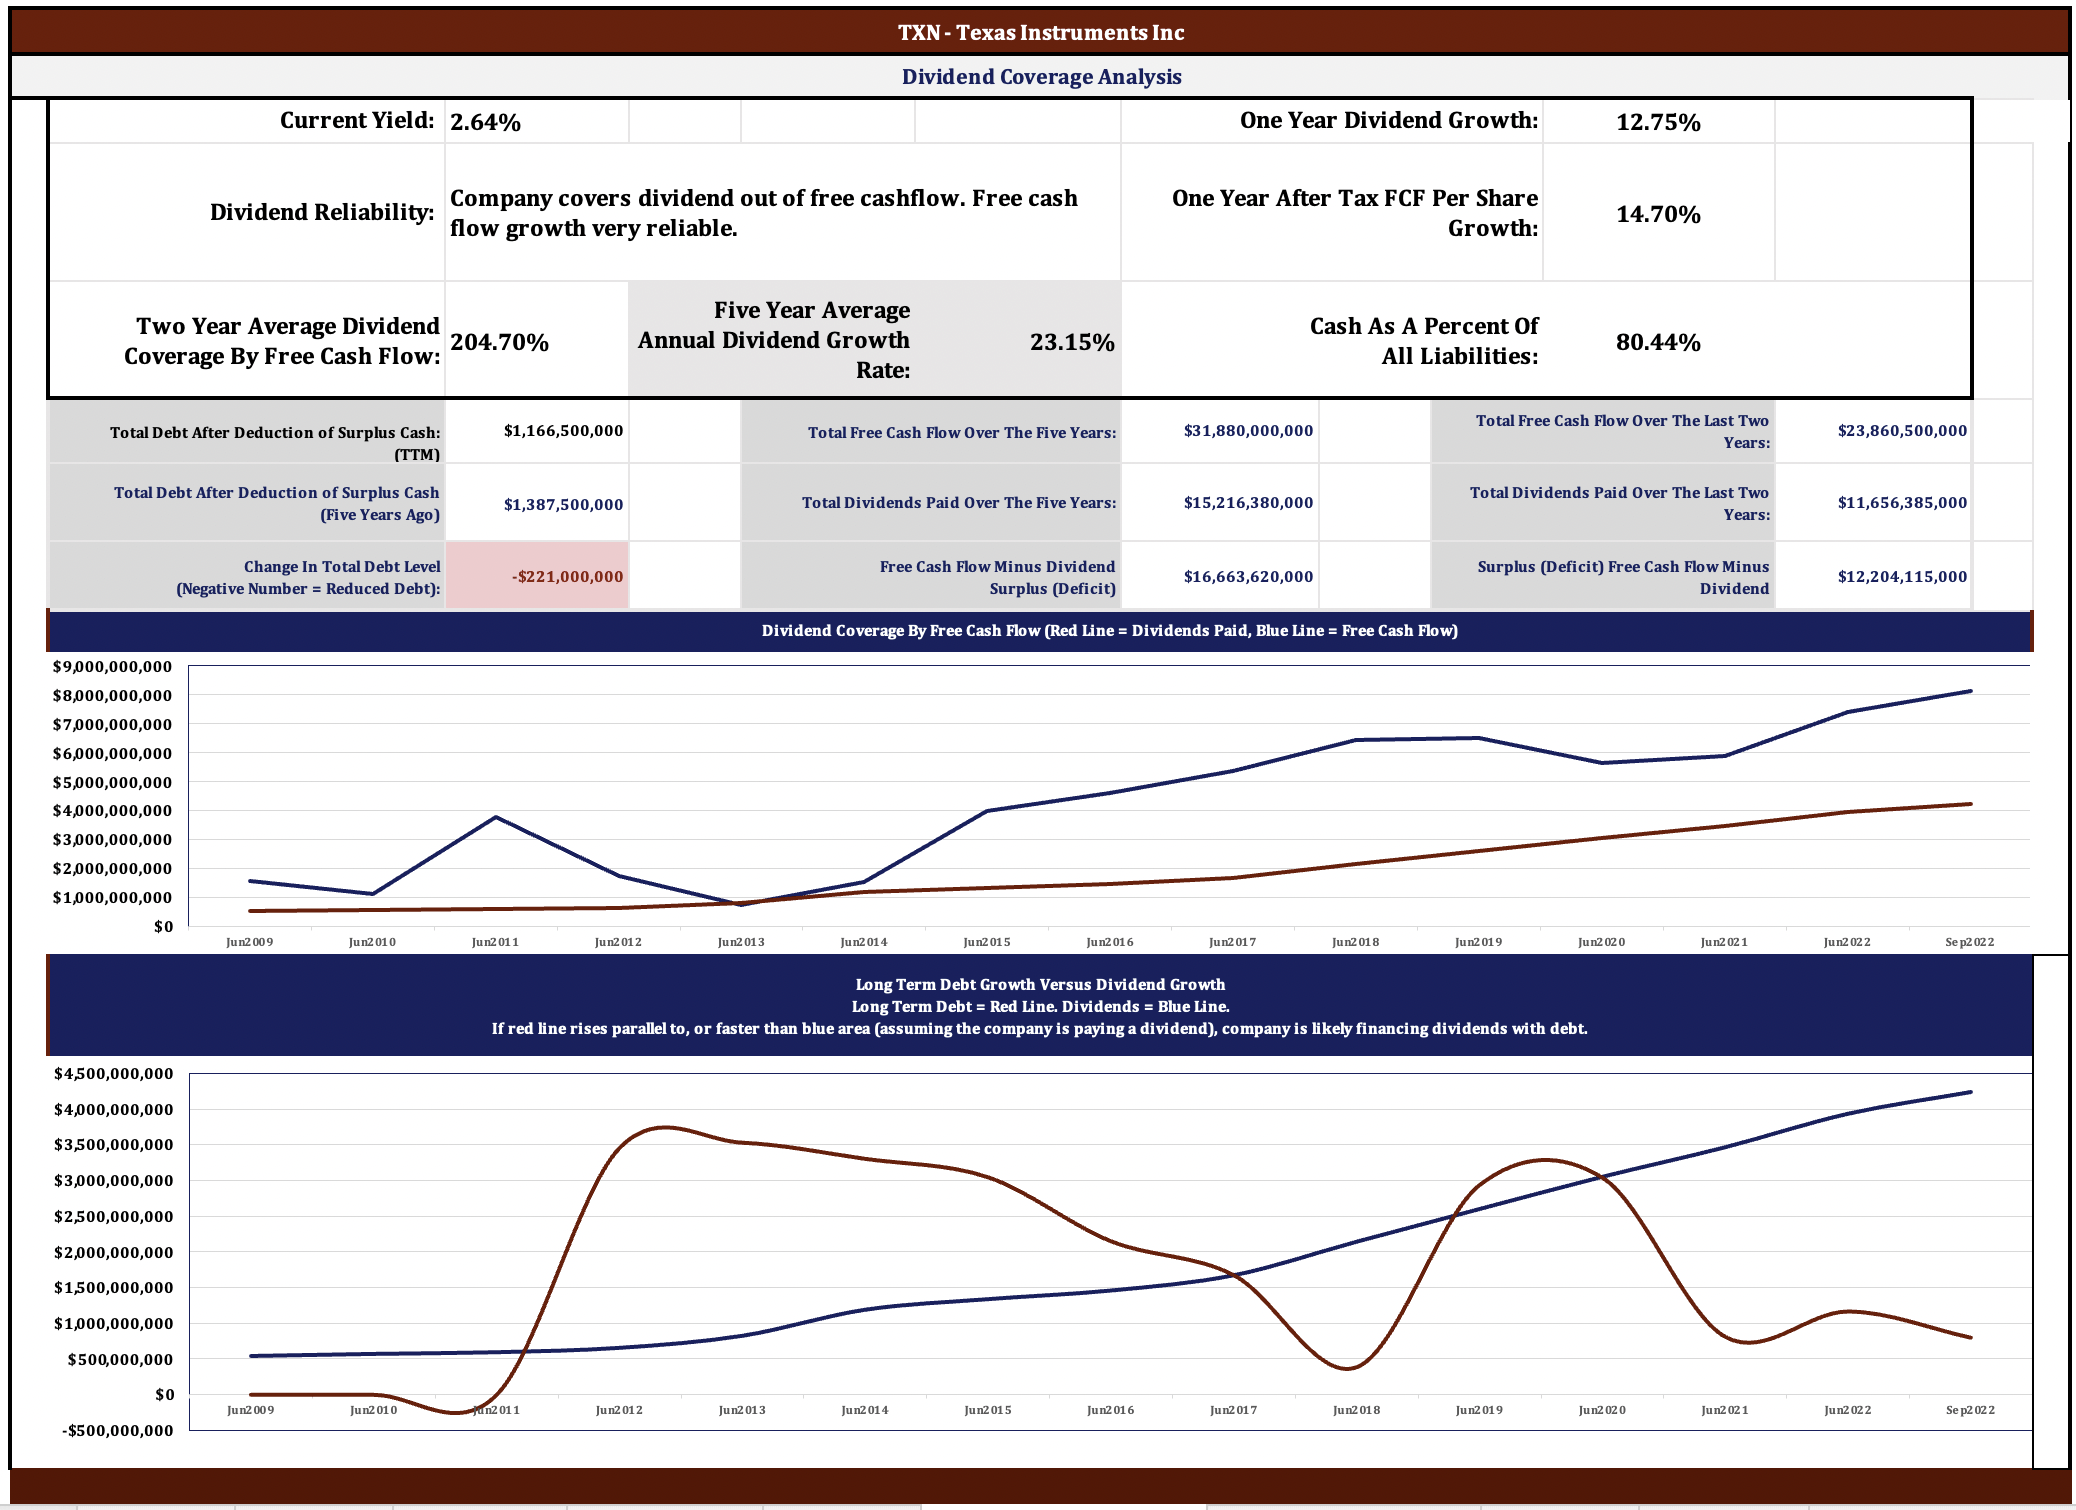
Texas Instruments has outlined plans to invest substantial sums in production capacity over the next 10 to 15 years. The company to spend an average of $3.5B per year for 2022-2025 and 10% of revenue from 2026. The company expects FCF margins to be between 25% to 35% of revenue. In turn, this should support long-term dividend growth.
Buy, sell or hold?
The yield, currently at 2.81%, compares to a six-month high of 3.24% and a low of 2.51%. Working in part off of this history, and in part off of six-month price relationships to simple moving average, our mean reversion algorithm indicates TXN is a buy at $148.30 and under, and has inordinate short-term risk over $170.06 and higher.
In summary, the Algo buys on weakness and sells on strength. The precise entry and exit points are determined pattern-recognition software that, after calculating the annualized returns generated by 20 different patterns, applies the pricing relationship to simple moving average and yield that has generated the highest return over the last six month. During regular trading hours, the Algo updates every hour to capture emerging market dynamics. In the case of TXN, the software identified two purchase and three sell points over the last six months. On average, in the 31 securities we follow closely, the Algo has identified at least one purchase and one sell in the last six months.
TXN Buy Sell Algo (www.dividendrisk.com)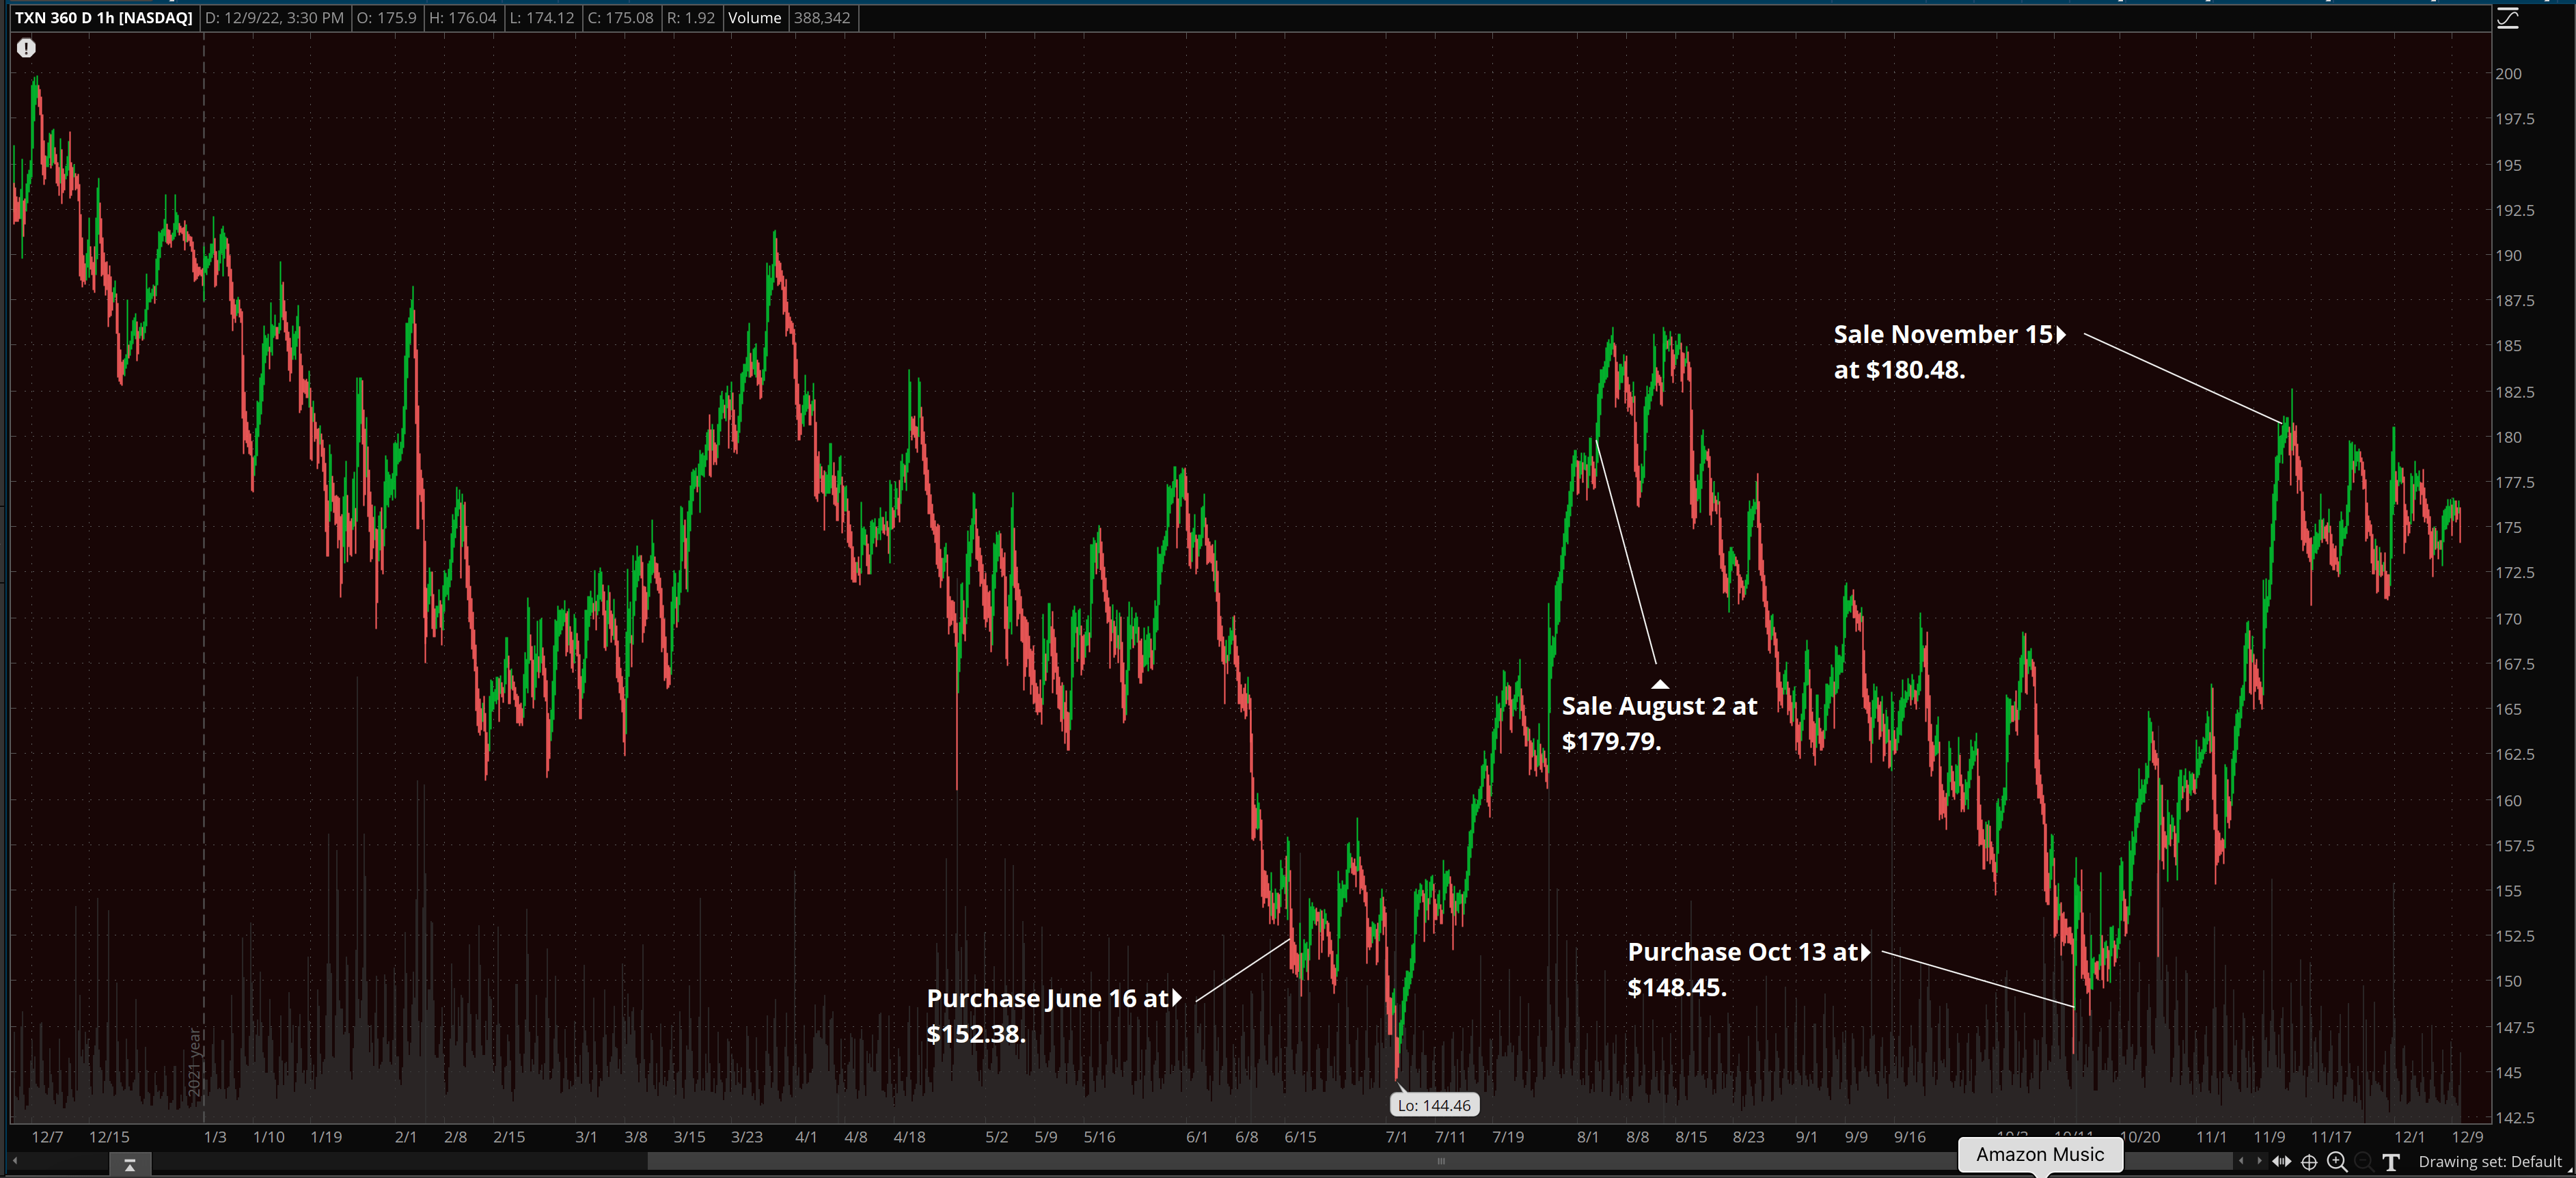
The pattern the algo is currently working off generated a return of 151% annualized over the last six months before the 3% dividend yield. It last indicated that TXN was a buy on October 13 at $146.99. Future returns from the Algo’s buy/sell levels will be at least slightly, if not significantly, different. What is depicted above is the current pattern the Algo is currently working off of.
History doesn’t repeat exactly, and to the extent the next six months are different from the last six, the return will differ. To further illustrate, if the market should show a major sell-off on a particular day, the Algo will look for a pattern that included a major sell-off, and correct itself. In a rising market like the one of the last couple of months, the Algo will sometimes wait too long to sell, and miss an opportunity. If a sell level is not achieved because the stock falls before hitting the algo-indicated target, income investors collect the yield and wait. In fact, many, probably most, subscribers ignore the sell signals and just watch for indicated buys, although historically taking advantage of the sells has roughly doubled overall performance pre-tax. In high-quality income securities, buys tend to come in groups. See here for more on how the algo works.
Summary
TXN is a quality company with excellent trends across the financial metrics we monitor. TXN’s current price is at a level which places it in the very high short-term risk category. We await a more compelling price. We’d be surprised if such an opportunity doesn’t present itself in the next couple of quarters.
Be the first to comment