

Will it be Santa or the Grinch this year?
Why is it so vogue to be a bear? Pundits and market strategists alike ratchet estimates down to one-up each other to the downside, nearly gleefully. However, the bear’s time is running out. Witness another cooler-than-expected CPI showing support that inflation has peaked in November.
The current darling of the media market strategist is calling for the next shoe to drop, and it will be earnings declining from $213 to $192 on the S&P 500. He expects a combination of lower EPS and a lower PE ratio which is a 28% decline from current levels. ($192 x a P/E of 15 = 2,880 a 28% decline from 4000 on the S&P 500).
But FactSet shows: That analyst earnings estimates for the following year, barring a disaster (black swan type) over the last 25 years, are within 2% of the actual results. Thus, a more realistic price target for the S&P 500 can be calculated as follows:
- 2023 EPS estimate for S&P 500 = $232
- Reduce by 2% = $227
The S&P 500 is trading at 17.1 times 2023 earnings estimates which is in line with its 10-year mean. So, if we assumed the S&P trades at 17.1 times 227, our target is 3,881, a decline of 3% for 2023.
It seems unlikely that S&P 500 earnings will decline unless GDP slows, and that may not be realistic at this point. Q4 GDP estimates point to increasing GDP according to the Atlanta Fed Now model, showing +3.2% estimated real GDP growth. On the contrary, S&P global analytics forecasts a negative 0.1% decline in GDP in 2023.
With supply chain energy and agricultural inputs declining rapidly, it appears margins will hold up better than expected. While the supply chain barometer, the Baltic Dry Index, an indicator for global shipping costs, is down nearly 30% since its mid-year peak. Furthermore, the Goldman Sachs commodity index is down 20%, and the agricultural index is down 15% from mid-year highs. Yet the XLE energy index ETF of large-cap energy stocks is only down 6% during this time.
Net profit margins for the S&P 500 are coming in at 12.0% in 2022, above the 10-year average of 10.3%, and analysts expect net profit margins to increase to 12.3% in 2023 due to declining costs.
Wage pressure is declining. The consumer price index for urban wage earners and clerical workers decreased 0.2% for the month of November prior to seasonal adjustments.
S&P earnings are strongly correlated to GDP with approximately a six-to-one ratio of operating leverage, meaning for every 1% change in GDP growth, S&P earnings will change by 6%.
Are analysts, after a long grinding bear market too negative at this point? If the AAII Bull-to-Bear indicator has relevance, bulls are outnumbered by 1.5. But service inflation is rising, so the bears posit as a sticking point.
Embedded employment and service costs are likely to decline in 2023 due to a semi-large migration back into the workforce to offset COVID’s unemployment stipend, which is expected to run out by mid-2023.
The facts are that supply chain shocks have eased shipping costs evidenced by the Baltic Dry index collapsing.
FactSet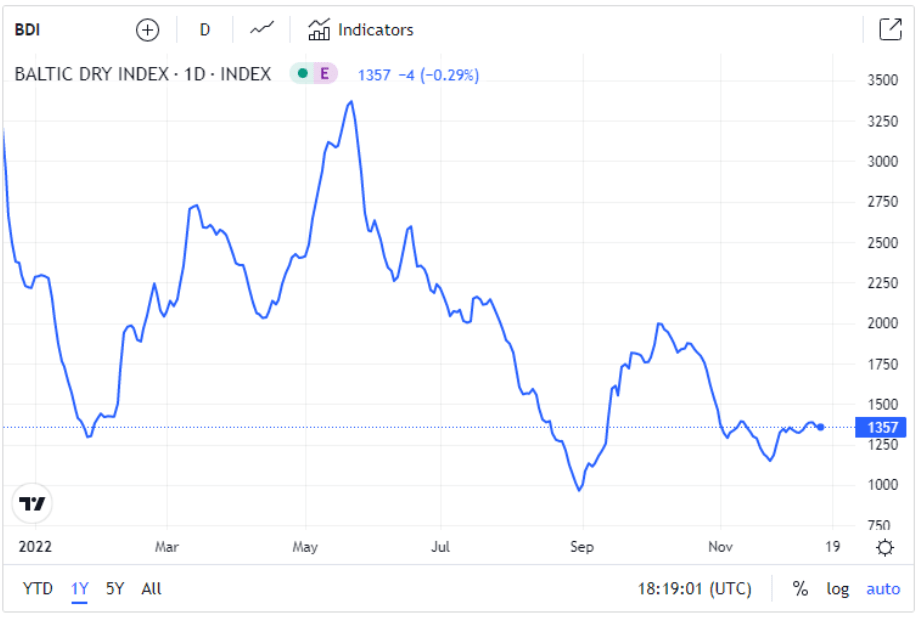
The monthly annualized rate of inflation is now 2.4%, evidenced by the core CPI for November, and there are roughly 2.5 million able-bodied Americans that are likely to rejoin the workforce with easing labor costs.
US Bureau of Labor Statistics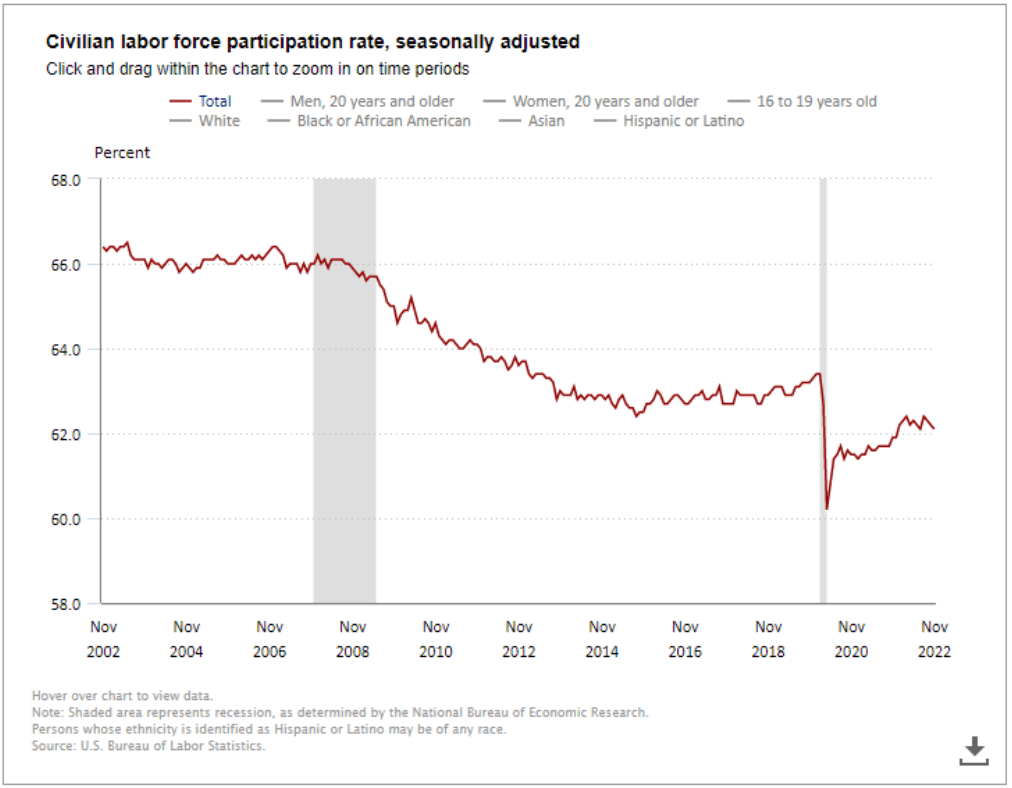
The message from the yield curve is telling the Fed enough already. More hikes will likely result in a recession, and we believe Powell is listening.
M2 is turning negative and quantitative tightening is accelerating, which is a significant drain of liquidity from the capital markets and could represent a pivot point.
Real interest rates are now positive for the first time in a decade, as 5-year treasury yields are at 1.35%, above the historical mean of 0.35%. It seems unrealistic to factor in a recession when the consumer remains strong and highly employed; the consumer is nearly 70% of the game.
More evidence that Inflation is falling
Current CPI may have been negative in November when you factor in a normalized, contemporary shelter cost component that is actually declining month-to-month, but due to the way it is calculated on a trailing six-month basis, it lags reality significantly. And it jumped in November to +0.6%, which is over 30% of the total CPI.
Service costs are declining
The medical care index fell 0.5% in November and October. Both, the indices for hospital and related services and prescription drugs decreased 0.3% and 0.2% sequentially, respectively. The index for physician services was unchanged in November.
What if we have the historical mean of positive 2% GDP growth? What would that mean to earnings? Historically, that result would represent an increase of 12% in 2023. Assuming a 17 multiple on the S&P 500, its historical mean on earnings of $244 provides a price target of 4,148 or a total return of approximately 7%, including dividends. The street aggregate price target on the S&P 500 for next year is 4,493, and total return of approximately 13%, which should represent a multiple on earnings of 18.5. And why not with 3% inflation?
The chic/fashionable bears are yesterday’s news and will be long forgotten by the end of 2023.
Be the first to comment