

da-kuk
The Other Shoe
Our MMI Indicators support further downside and more bearishness in the market. The chart below of the inverted Treasury yield curve says it best.
Federal Reserve Singular Research
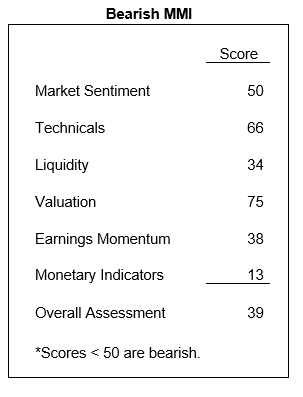
Market Sentiment: Neutral
The VIX and VXN (volatility indicators) are elevated only slightly. However, the put to call ratio on the S&P 100 is at 1.22 which is slightly less than our bullish level needed of 1.25. The put to call on CBOE equity is 0.67 which is bullish above the 0.60 threshold. NYSE TRIN registers at 1.63, which is positive. The AAII index of investor sentiment is 0.56 which is bullish.
Technical Indicators: Negative
Weekly new highs to new lows registered at 0.03 while advancing to declining volume is 0.257%. Advancing to declining issues was 0.329% for the week ending September 16. One strength is that the 10-day moving average up-to-down volume on the NYSE and NASDAQ was positive. However, all major indices are still negative relative to their 200-day moving averages, at significantly oversold levels.
Indices below respective 200-day moving averages: Dow Jones (8)%; NASDAQ (9)%; NYSE composite (8)%; S&P 500 equal weighted (7)%; Small cap 600 equal weighted (10)%; iShares micro-cap (8.5)%.
Percent issues that are above their 20-, 50-, and 200-day moving averages are: 23%, 31%, and 27%.
Liquidity Indicators: Neutral
Assets in money market funds and equivalents exceed $4.6 trillion which provides a high level of buying power on the sidelines. Furthermore, it is estimated that total equity exposure is down to 19% when the historical average is 30%. Equity funds experienced a $26 billion outflow over the last four weeks. New cash takeovers were up $8.7 billion and new stock buybacks increased $23.3 billion.
Two large caps, Texas Instruments (TXN) and CVS Health Corporation (CVS), accounted for nearly 70% of the bullish action. TXN announced $15 billion of buybacks and CVS had an $8 billion acquisition last month of SOFY.
However, these inflows were offset by $23 billion in equity fund outflows and another $5.9 billion in equity issuance while insider selling exceeded $1 billion. The Fed also is performing quantitative tightening by reducing their balance sheet this month by $45 billion. All these outflows have led to a net total outflow of $51 billion.
Valuation: Negative
We believe that much of the overvaluation that took place over the last 12 to 18 months in the small/mid-cap sectors has been taken away with the Russell 2000, equal-weighted small cap index, and micro-cap index trading at 11.8, 10.6, and 8.9 times earnings, respectively. In contrast, the S&P trades at 18.9 times which is above its historical average of 16.6 times.
The market cap to replacement value is negative at 1.4 times and the market cap to GDP is also elevated at 150%. However, the earnings yield is positive versus the corporate bond yield at +1.34.
EPS Momentum: Negative
EPS momentum is negative at 25% levels. Q3 EPS estimates have been revised significantly lower to 3.5% growth from 9.8% three months ago. Early EPS guidance is negative with 65 companies guiding lower and 40 higher which is below the 5-year average. Subtracting the impressive earnings in energy in Q3 would equate to total earnings to be down (2.9)% for the aggregate. Finally, Q4 EPS estimates are also now moving lower, registering at +4.7%.
Monetary Indicators: Negative (at 25% levels)
The excess liquidity indicator’s term spread is negatively evidenced by the inverted yield curve with 2-year yields approaching 4% versus 10-year yields at 3.5%. More pain ahead is expected as forward rates versus 1-year T-bills are negative as forwards are at 5.1% versus 3.9%, suggesting more rate hikes. The high yield to 10-year Treasury index is negative 200 basis points, showing that high yield spreads have not widened to their historical norms and that there are currently overvalued high-yield bonds.
We urge clients to observe two age-old Wall Street adages. Don’t fight the Fed. Don’t fight the tape.
Be the first to comment