


Enes Evren/E+ via Getty Images
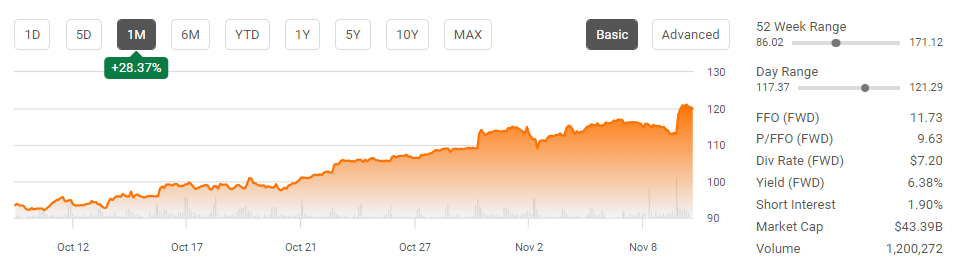
Simon Property Group (NYSE:SPG) delivered its 2nd consecutive quarter where not only did they beat top and bottom line expectations, but they also raised guidance and the dividend. In Q2, SPG beat by $0.07 on FFO, $30 million on revenue, increased guidance for their FFO and raised the quarterly dividend from $1.70 to $1.75. Q3 was a complete replication of good news as SPG beat FFO by $0.01, revenue by $50 million, raised guidance again, and increased the quarterly dividend from $1.75 to $1.80. SPG has rallied roughly 28% in the past month but is still down -$50.93 from its 52-week highs or -29.76%. Going into the holidays, I believe SPG has more room to run as it’s undervalued compared to its peer group, and the fears of brick-and-mortar losing their relevance have been an overblown bear thesis.
Seeking Alpha
Simon Property Group has another great quarter that led to a guidance and dividend increase
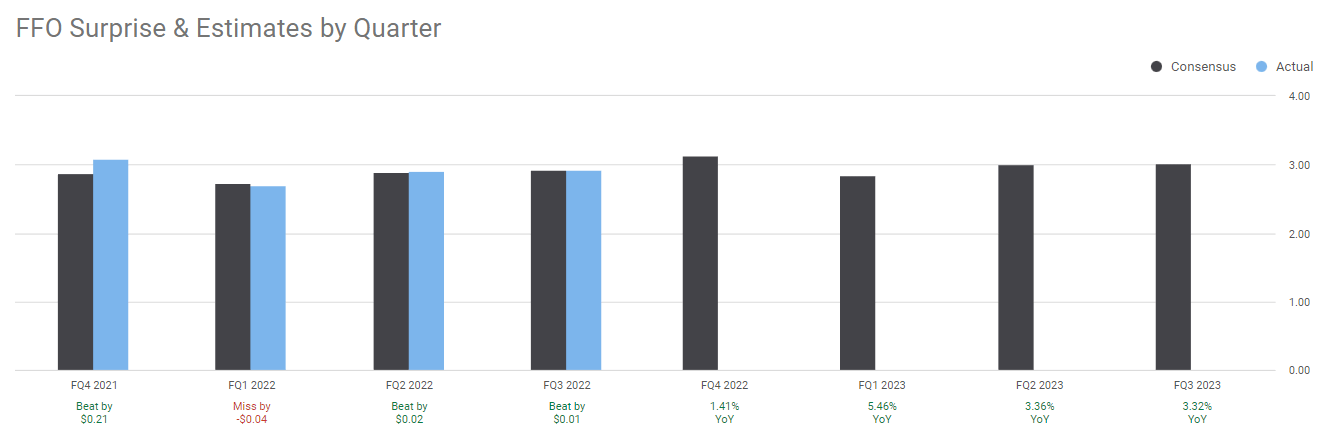
In Q3, SPG generated $2.93 in FFO, which was a $0.01 beat, and $1.32 billion in revenue, which was a $50 million beat. Domestic net operating income increased by 2.3% while its occupancy rate grew to 94.5%. SPG’s minimum rent per sq foot increased by 7.23% to $54.30 YoY. SPG raised its guidance again, indicating that FFO to be within a range of $11.83 to $11.88 per diluted share from a prior outlook of $11.70-$11.77. Beat and raises should be rewarded, and the market is finally starting to reward shares of SPG as they are significantly higher than their fall lows.
In addition to the market rewarding shareholders, SPG announced a 9.1% increase to its dividend as the quarterly dividend was increased to $1.80 per share. SPG had previously announced that they would be instituting a repurchase plan as they felt shares were trading at attractive values, and since May, SG has repurchased 1.8 million shares at an average price of $98.57.
Seeking Alpha
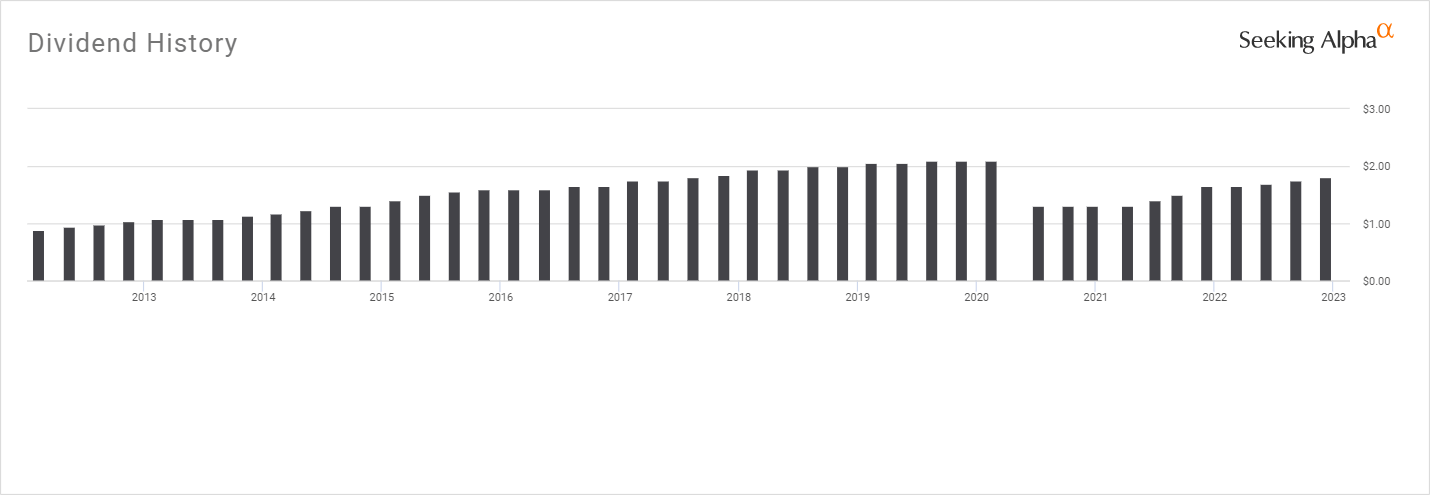
SPG has been a public company for almost 3 decades and has paid out $39 billion in dividends to its shareholders. Since Q2 of 2021, SPG has provided shareholders with 6 quarterly dividend increases and continues to work toward restoring the prior dividend to pre-pandemic levels. SPG has a strong dividend coverage ratio as its increased dividend of $1.80 is 61.43% of the latest $2.93 FFO generated. As occupancy rates increase, I would suspect that SPG will continue generating elevated levels of FFO, which should drive its dividend higher.
2023 looks like it will be a strong year for SPG as Q1, Q2, and Q3 all have YoY projected FFO increases. The consensus estimate for FFO in 2022 is $11.73, and this is projected to increase by 9.66% to $12.14 in 2023. SPG has delivered 3 dividend raises in 2022, and larger amounts of FFO in the future should correlate to future dividend increases.
Seeking Alpha
The bear thesis around brick-and-mortar is outright wrong
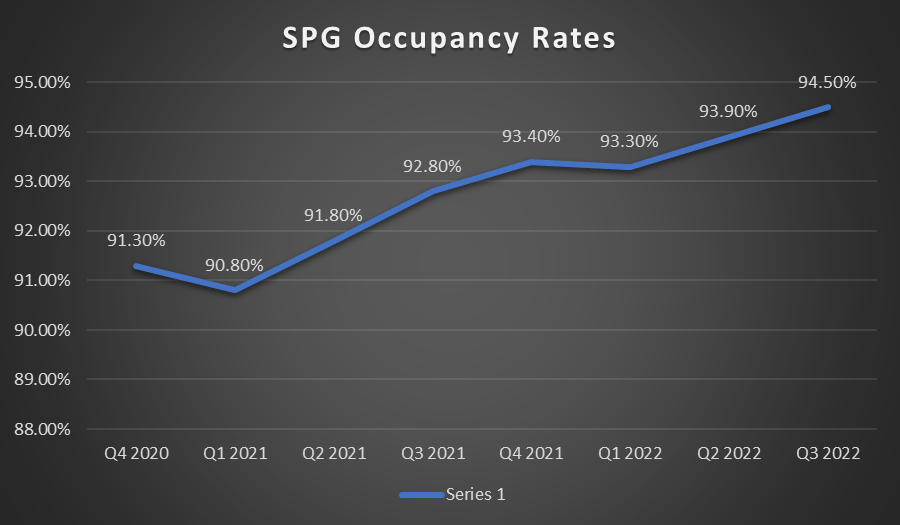
During the height of the pandemic, the shift to digital advanced considerably, but it didn’t eradicate physical retail then, and it’s not going to eradicate it now. In Q2 2022, SPG had an occupancy rate of 93.9%, and this increased QoQ to 94.50% in Q3. Since Q4 2020, SPG has maintained an occupancy rate that has exceeded 90% for its tenants, which an average occupancy rate of 92.73%. Amazon’s revenues increased by 37.62% YoY in 2021 from $280.5 billion to $386.06 billion, and by another 21.70% in 2021 as they were a direct beneficiary of the pandemic, but the e-commerce invasion isn’t impacting physical retail the way bears had anticipated. Class A malls are much more than shopping centers, as they are hubs for individuals to gather and create experiences. These properties are anchored by movie theaters, restaurants, and other types of activities that provide an epicenter of human interaction. While e-commerce is certainly efficient, SPG’s occupancy rates indicate that physical retail isn’t on the decline, and the numbers cited in the Global Ecommerce Forecast for 2022 from Insider Intelligence show that physical retail is still growing.
Steven Fiorillo, Seeking Alpha
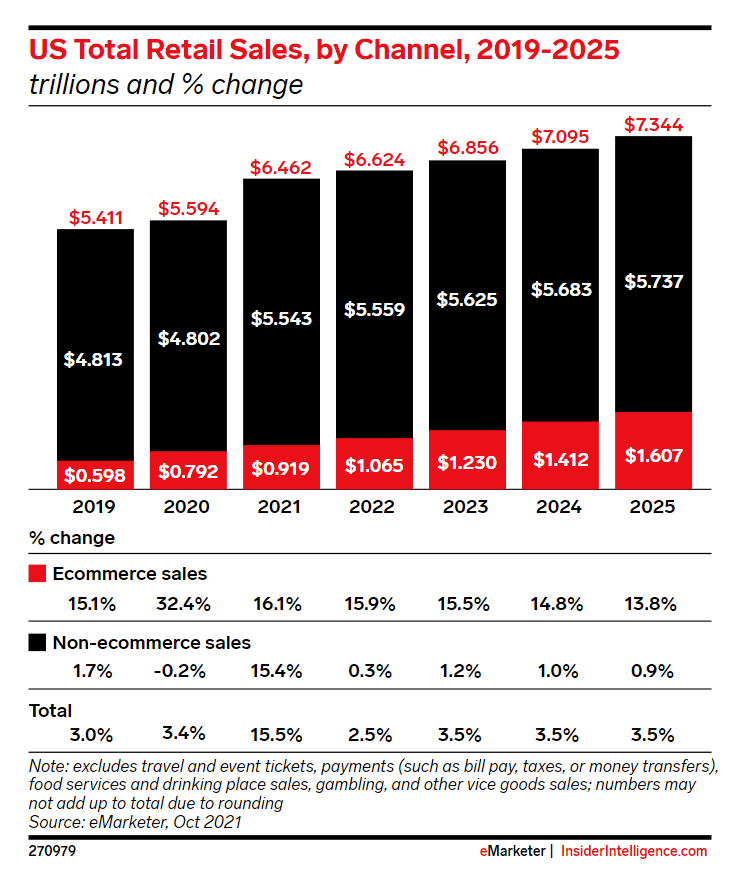
In 2022, the U.S retail sector is projected to generate $6.62 trillion in sales. E-commerce is projected to total $1.07 trillion in sales, which is 16.08% of the retail sector. In 2025 e-commerce sales will grow to $1.61 trillion, and while this is an increase of 50.89%, it is still only projected to be 21.88% of the retail sector. While e-commerce penetrates the retail sector and accounts for more of the sales channel mix, sales in physical brick-and-mortar locations are expected to increase by $178 billion (3.2%) between 2023 – 2025. SPG’s locations will be needed as they are critical to the retail sector, and their occupancy rates support what Insider Intelligence is projecting.
Insider Intelligence
SPG is still undervalued compared to its peer group
SPG is still trading at the bottom range of its peer group, but when I compare it to its peers, they still look inexpensive.
Seeking Alpha
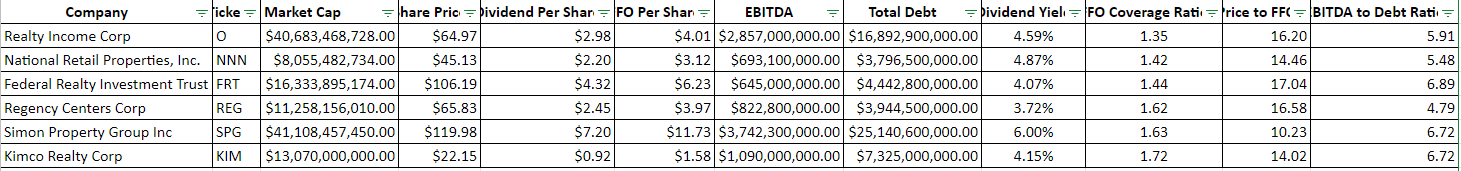
There are three main metrics that I look at when comparing a REIT to its peer group, the share price to Funds From Operations (FFO), the EBITDA to Total Debt ratio, and the FFO coverage ratio on the dividend. Funds from operations or (FFO) represent the actual cash generated from the REIT’s operation. It is a widely used ratio for valuation purposes as it has become the primary earning metric in REITs. FFO = Net Income + Depreciation and Amortization + Loss on Sales of Asset – Gain on Sales of Assets + Interest Income. When it comes to REITs, you want to see the FFO coverage ratio rather than going by the EPS.
Steven Fiorillo, Seeking Alpha
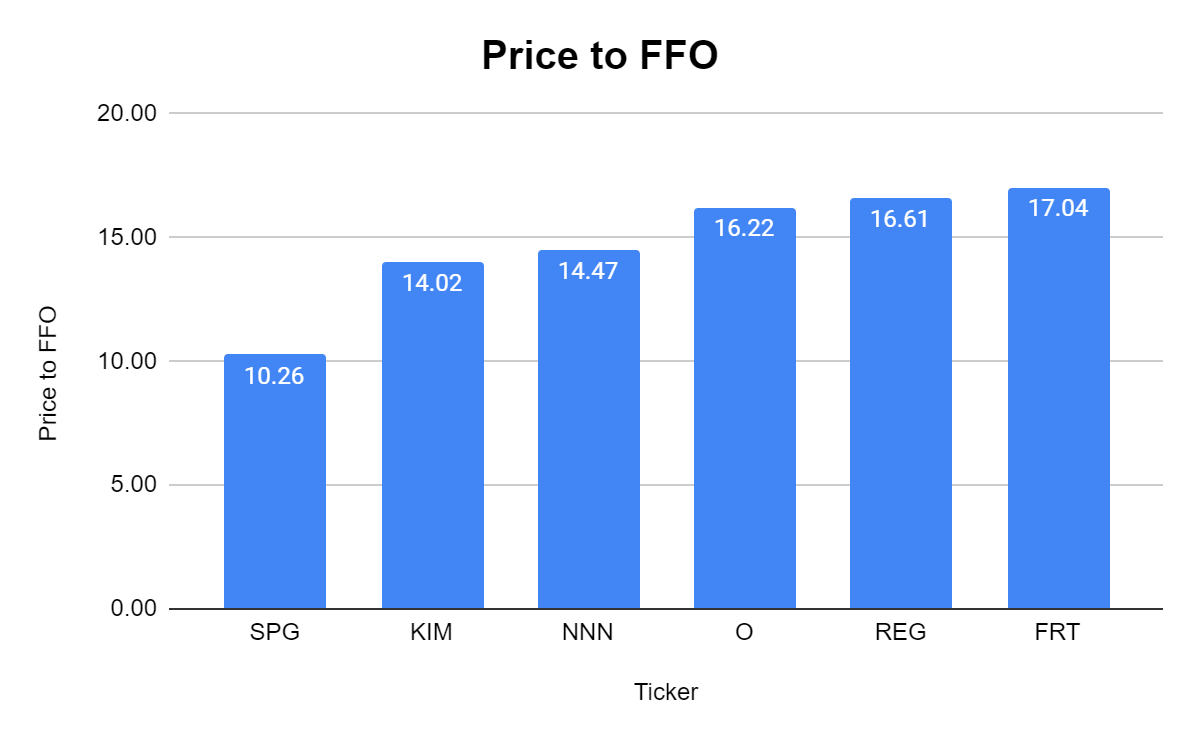
The peer group has an average price-to-FFO ratio of 14.77x, and SPG trades at 10.26x. SPG generates the largest amount of FFO per share and currently produces more than double its peers, excluding FRT. Shares of SPG look very undervalued utilizing this metric, and as a REIT investor, I am always consensus of how much I am spending for the FFO generated. If SPG had a $173 share price, its price to FFO metric would be 14.75x, which is just under the 14.77x average. Even though SPG has rallied, I think there is much more room for it to run going into the holiday season.
Steven Fiorillo, Seeking Alpha
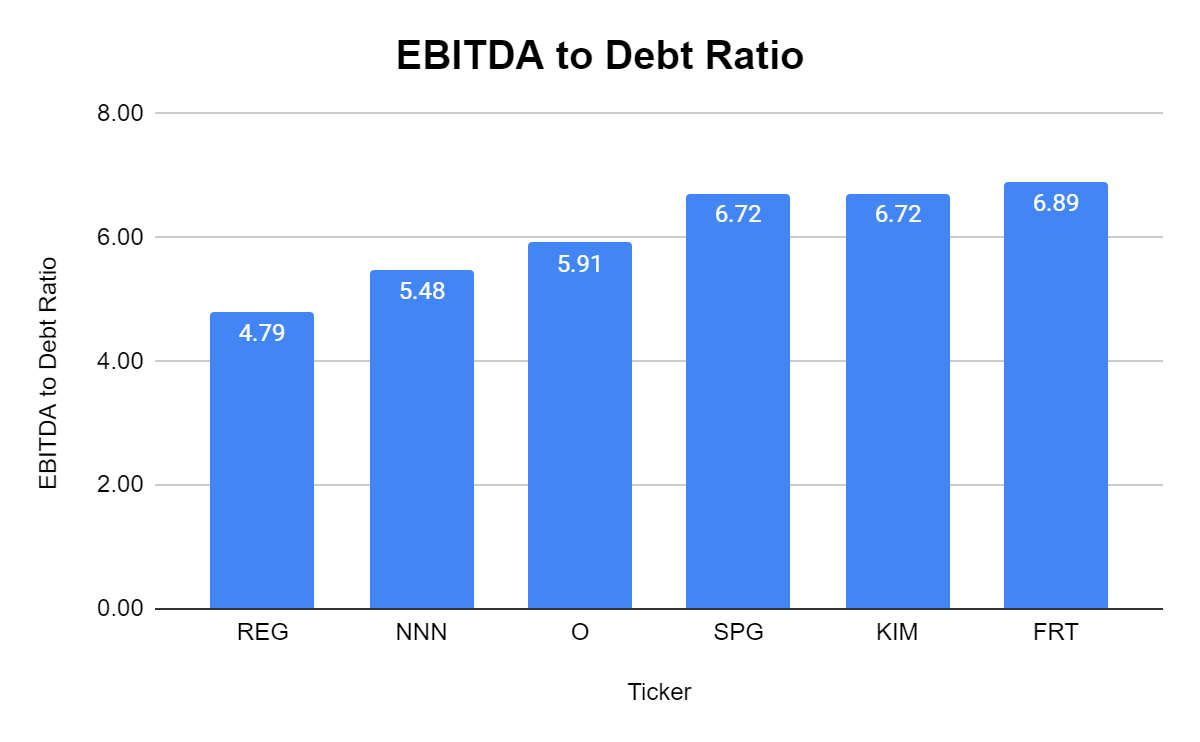
The EBITDA to total debt ratio when evaluating REITs provides the best way to assess the debt level of REITs. Almost every company taps the debt markets to fund its growth, but not all debt levels are equal. One company could have $10 billion in debt but generates $2 billion in EBITDA, while another has $2 billion in debt but only generates $100 million of EBITDA. Looking at the EBITDA to Total Debt ratio allows an investor to see how many years of EBITDA it would take to eliminate the company’s total debt and determine if the debt load is manageable or a liability that makes the company uninvestable.
SPG and the peer group have a fairly tight range on the EBITDA to Total Debt metric ranging from 4.79x to 6.89x. The average EBITDA to Total Debt ratio is 6.09x, and SPG falls just above the average at 6.72x. While I would like SPG to have a lower ratio, they generated $3.74 billion of EBITDA and I am not worried about their long-term debt as a 6.72x ratio is more than acceptable for me.
Steven Fiorillo, Seeking Alpha
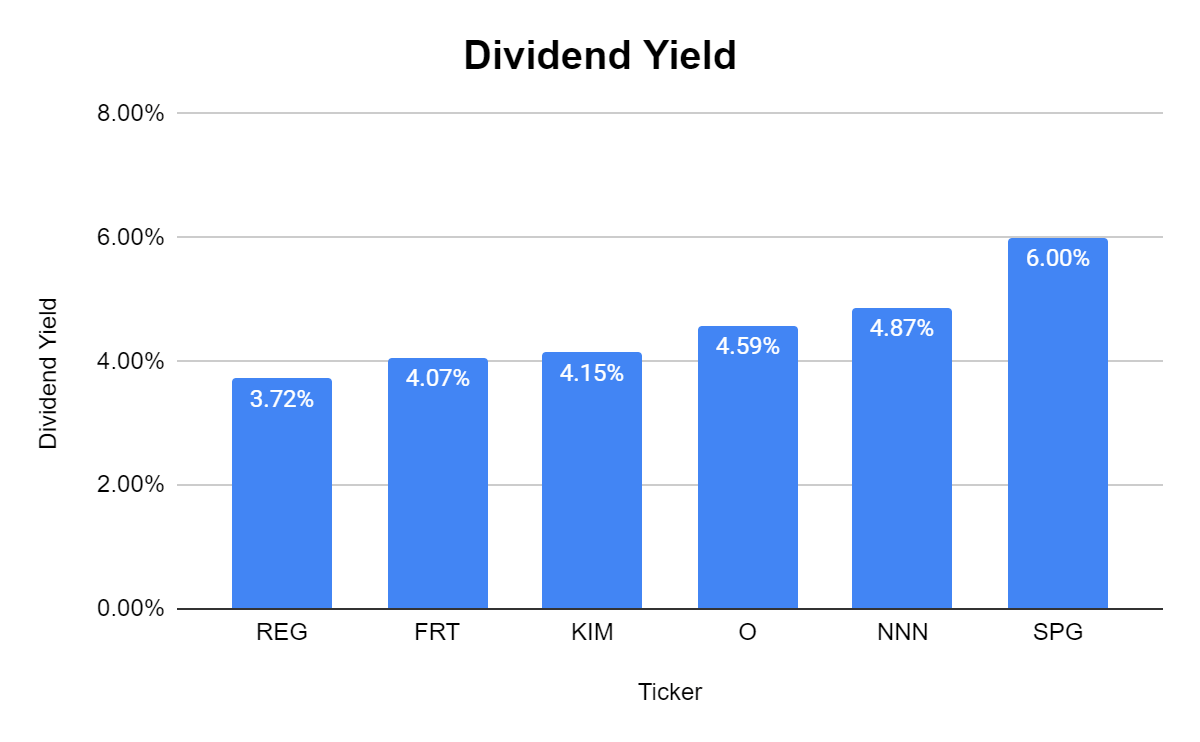
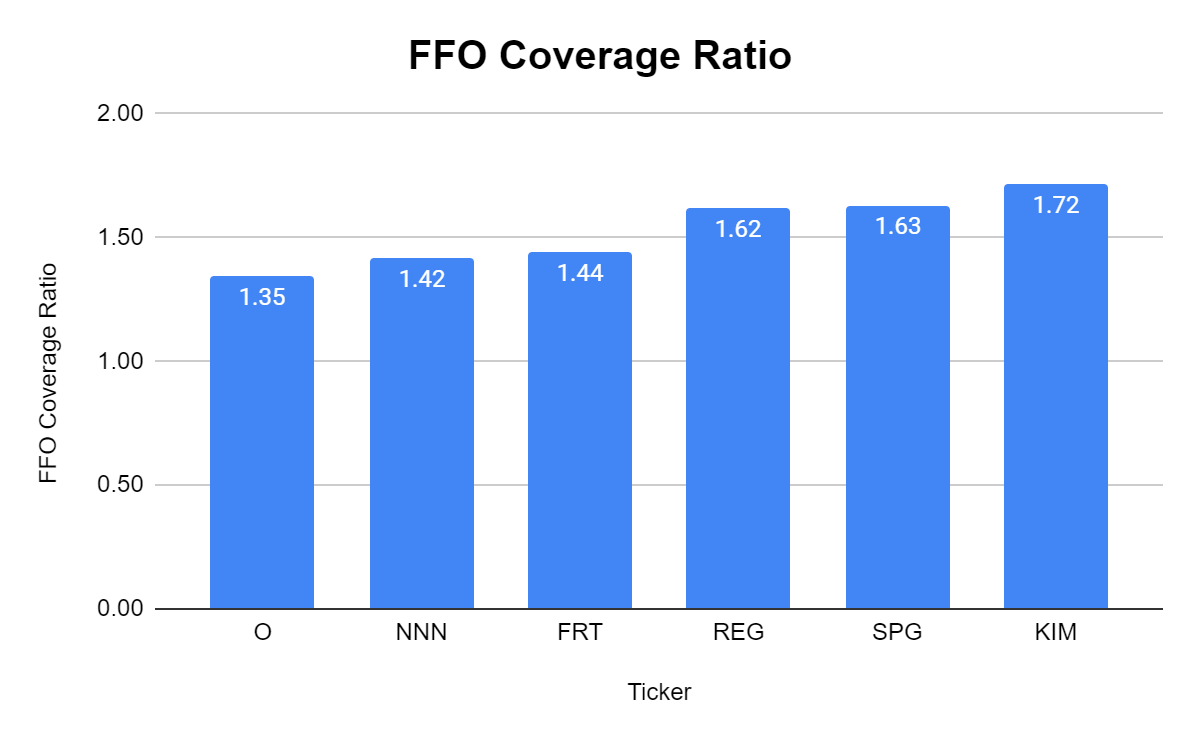
I invest in REITs for income, and there are only several I would consider under a 5% yield. In today’s environment, you can generate almost 5% on a 1-year CD or T-bill, so I am really looking for 5.5% or higher. SPG has a 6% dividend yield, which is substantially larger than the peer group average of 4.57% and is also the highest in its peer group. SPG also has a large FFO coverage ratio of 1.63x of its dividend, which indicates that the 6% yield is secure.
Steven Fiorillo, Seeking Alpha
Steven Fiorillo, Seeking Alpha
Conclusion
SPG is one of my favorite REITs as I believe class-A malls in quality locations will withstand the impacts of an increase in ecommerce activity. SPG offers a 6% yield, and I believe shares are still undervalued, even after its nearly 30% run. SPG would need to trade for $173 per share to replicate the peer group average on a price-to-FFO methodology. I think SPG will deliver another top and bottom line beat and continue its rally into the holiday season.
Be the first to comment