

270770
Silver is an odd metal that’s both an industrial commodity and a financial asset. Silver can sit in a trading range for years, but when it decides to move higher or lower and break out of a consolidation period, watch out! The price action can get wild.
In 1980, silver reached its all-time peak at $50.36 per ounce when the Hunt Brothers attempted to corner the silver market. A dozen years later, the price found a bottom at just over the $3.50 level. In 2011, the price rose to a lower high of $49.52. After falling to $11.735 in March 2020 when the global pandemic gripped markets across all asset classes, the price took off on the upside and probed over $30 per ounce in February 2020. Since then, nearby COMEX silver futures have made lower highs and lower lows, reaching $17.32 in September 2022. Silver was attempting to change the bearish pattern at around the $21.70 level on Nov. 10.
Like peas and carrots, silver and gold get along well. Silver is a far more volatile and speculative metal than gold because the price is a fraction of gold’s, and it attracts lots of trend-following interest when the price moves. Therefore, price action in the silver market can often signal a trend change in gold. Over the past weeks, silver has been sending some bullish signals to the precious metals sector.
Silver is volatile, and silver mining stocks offer leverage to the metal’s price. The ETFMG Prime Junior Silver Miners ETF (NYSEARCA:SILJ) offers market participants explosive and implosive price action when silver’s price breaks on the up or downside.
Silver’s been outperforming gold since early September 2022
On Sept. 1, 2022, nearby COMEX December silver futures traded to a low of $17.40 per ounce.
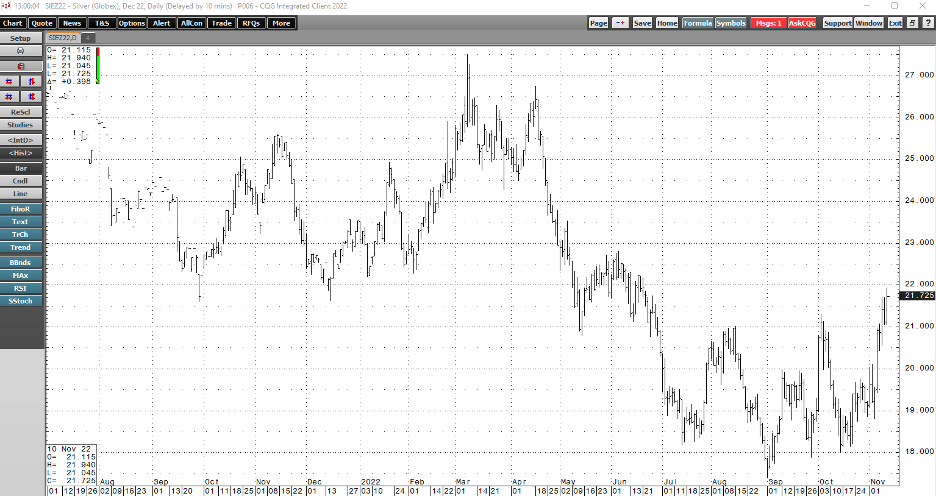
Chart of December COMEX Silver Futures (CQG)
The chart shows the low in silver, which was not only a new low for 2022 but the lowest price since June 2020. December futures fell to $17.40, but the continuous contract reached a low of $17.32 per ounce. Meanwhile, December COMEX gold futures reached a low of $1699.10 on Sept. 1. While silver hit rock bottom that day, gold continued lower, falling to $1613 in late September. At $21.70 on Nov. 10, December silver futures have rallied 24.7% from the low. At $1,753.70, gold was 3.2% above the Sept. 1 low and 8.7% higher than the late September low. The bottom line is silver has done a lot better than gold over the past months.
Precious metals selling after the latest Fed rate hike did not last long
On Nov. 2, the hawkish US Federal Reserve increased the short-term Fed Funds Rate by 75 basis points for the fourth consecutive time. In March 2022, the short-term rate was at zero, and the latest rate hike pushed it to a range between 3.75% and 4.00%.
When silver reached its low in September, the dollar index was on its way to a two-decade high at 114.745. Rising interest rates are bullish for the dollar as the primary factor for exchange rates is interest rate differentials. Rising rates and a strong US dollar are typically a toxic and bearish combination for silver and gold prices.
The knee-jerk reaction to the Nov. 2 rate hike was selling in the silver and gold futures markets. December silver futures declined to a higher low of $18.805 on Nov. 3, and gold fell to a marginally higher low of $1618.30 on that day. Meanwhile, the precious metals took off on the upside from those higher lows and continued to make higher highs.
On Nov. 10, the October consumer price index data shows that prices rose by a less-than-expected 0.4%, and the inflation indicator stood at 7.7%, a decline from the prior months. The lower CPI pushed December gold to a new short-term high of $1,757.20 and December silver to a new short-term peak of $21.940 per ounce. Meanwhile, the dollar index dropped to the 108 level, and the US 30-Year Treasury bond futures were higher on Nov. 10, putting upward pressure on precious metals prices.
The silver-gold ratio sends clues
The silver-gold ratio tends to be a barometer for leading precious metals. The ratio rises when the metals are under selling pressure and rises when buying pushes the prices higher. Since the 1970s, the average has been around 65:1, but the ratio dates back far beyond the past half century. In 3200 BCE, the first Egyptian Pharaoh, Menes, declared that two and one-half parts silver equal one part gold. For thousands of years, the relationship between silver and gold has been a metric followed by investors and traders. In Menes’ time and for thousands of years that followed, silver and gold were the primary means of exchange. Long before dollars, euros, pounds, yen, and other fiat currencies existed, silver and gold were hard money.
I follow the ratio as one guide that provides clues about the market’s sentiment for the path of least resistance of the two leading precious metals’ prices.
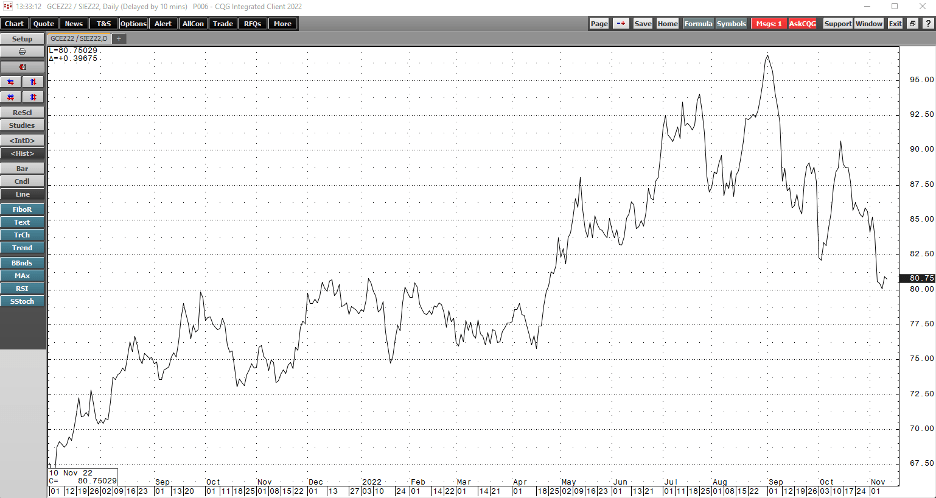
Silver-Gold Ratio Chart (CQG)
The daily chart of December COMEX gold futures divided by December COMEX silver futures highlights the ratio’s decline from 96.79:1 on September 1 to the 80.85:1 level on November 10. The ratio has made lower highs and lower lows over the past two months, indicating that silver and gold prices were likely to fund significant bottoms and rally. In another bullish sign for the precious metals, the total number of long and short positions in the gold and silver futures markets have been rising with the prices.
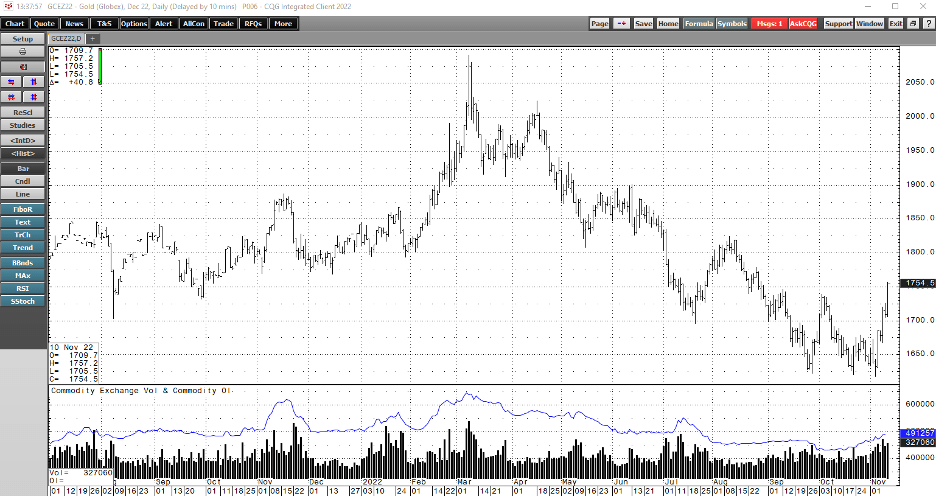
COMEX Gold Futures Chart with Open Interest (CQG)
The chart shows that gold’s open interest metric rose from 432,024 on September 30 to 491,257 contracts on November 9, a 13.7% increase.
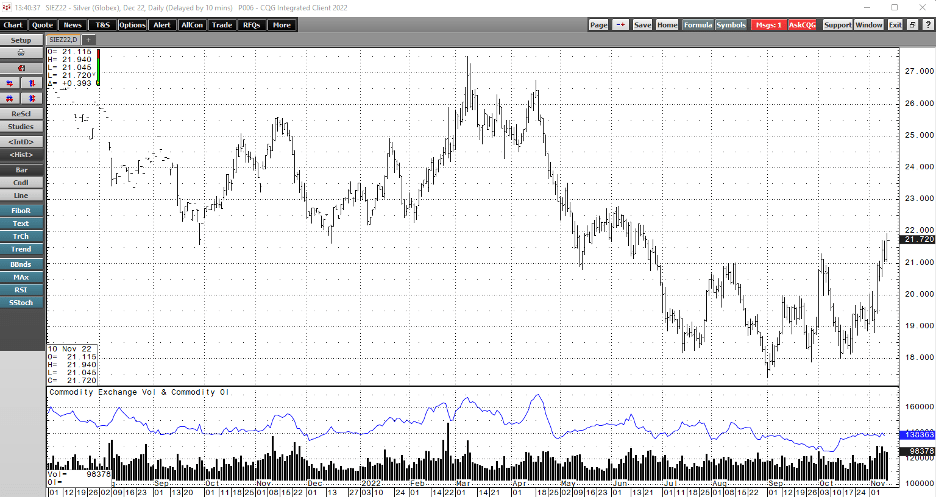
COMEX Silver Futures with Open Interest (CQG)
Meanwhile, silver open interest rose from 125,623 on Oct. 11 to 138,363 contracts on Nov. 9 or 10.1%. Increasing open interest while the price rises validate an emerging bullish trend in a futures market. The bottom line is that the declining silver-gold ratio and rising open interest in gold and silver futures markets point to higher prices for precious metals. During rallies, silver tends to outperform gold on a percentage basis as it attracts more speculative interest.
Silver mining stocks offer leverage
The most direct route for a silver investment is via the bars and coins offered by dealers. COMEX silver futures provide a delivery mechanism that converges with physical silver prices on delivery dates. Meanwhile, silver mining companies extract the metal from the earth’s crust. As I wrote in my recent Seeking Alpha article on junior gold mining companies, “when gold and mining shares take off on the upside, the junior gold mining ETF can kick into high gear and outperform the metal and senior mining companies.” The same holds for senior and junior mining companies in the silver arena.
Futures offer leverage, requiring small percentage margin deposits, but longs and shorts must post daily differences when they exceed variation margin levels. Senior and junior mining shares also provide leverage but trade on the stock exchange. Diversification lowers risk, and the two silver mining ETF products offer gearing without time decade and diversification as they hold a portfolio of silver mining companies.
SILJ is more volatile than SIL
The Global X Silver Miners ETF product (SIL) holds a portfolio of the leading senior silver mining companies. At $27.86 per share, SIL had around $842 million in assets under management and traded an average of over 393,000 shares daily. SIL charges a 0.65% management fee.
The top holdings of the ETFMG Prime Junior Silver Miners ETF include:
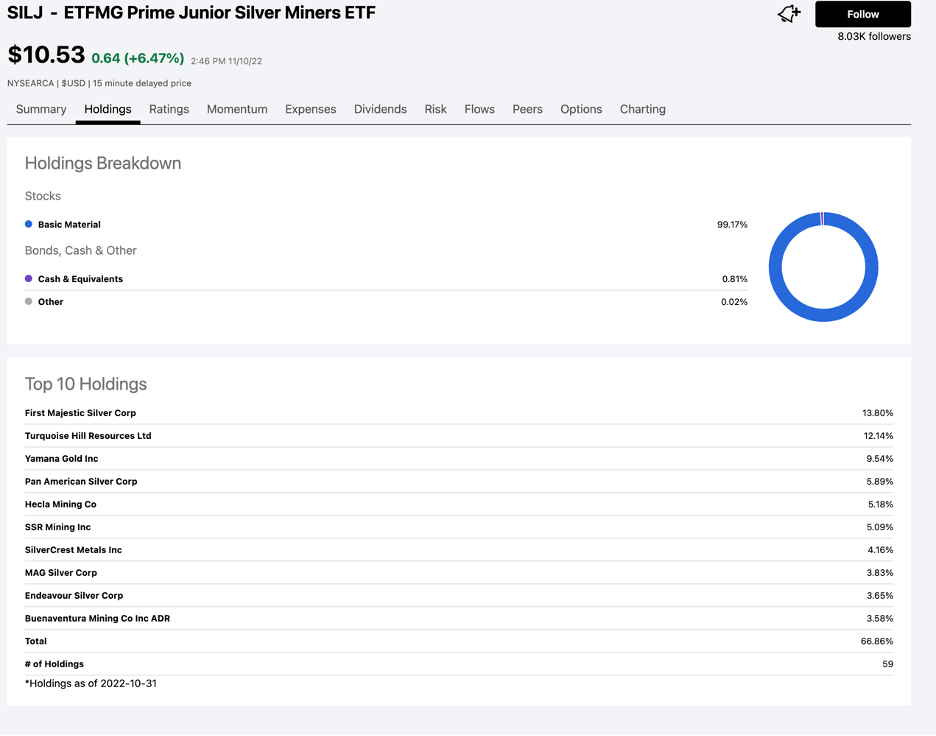
Top Holdings of the SILJ ETF Product (Seeking Alpha)
At $10.53 per share, SILJ had over $620 million in assets under management and traded an average of over 1.5 million shares daily. SILJ charges a 0.69% management fee.
The most dramatic move in the silver market over the past years came when the price tanked to $11.735 in March 2020 and took off on the upside, reaching $29.53 five months later in August 2020. The 151.6% move was explosive. Meanwhile, the SIL senior silver miners ETF did even better, rallying from $16.00 to $52.87 per share or 230.4% in 2020.
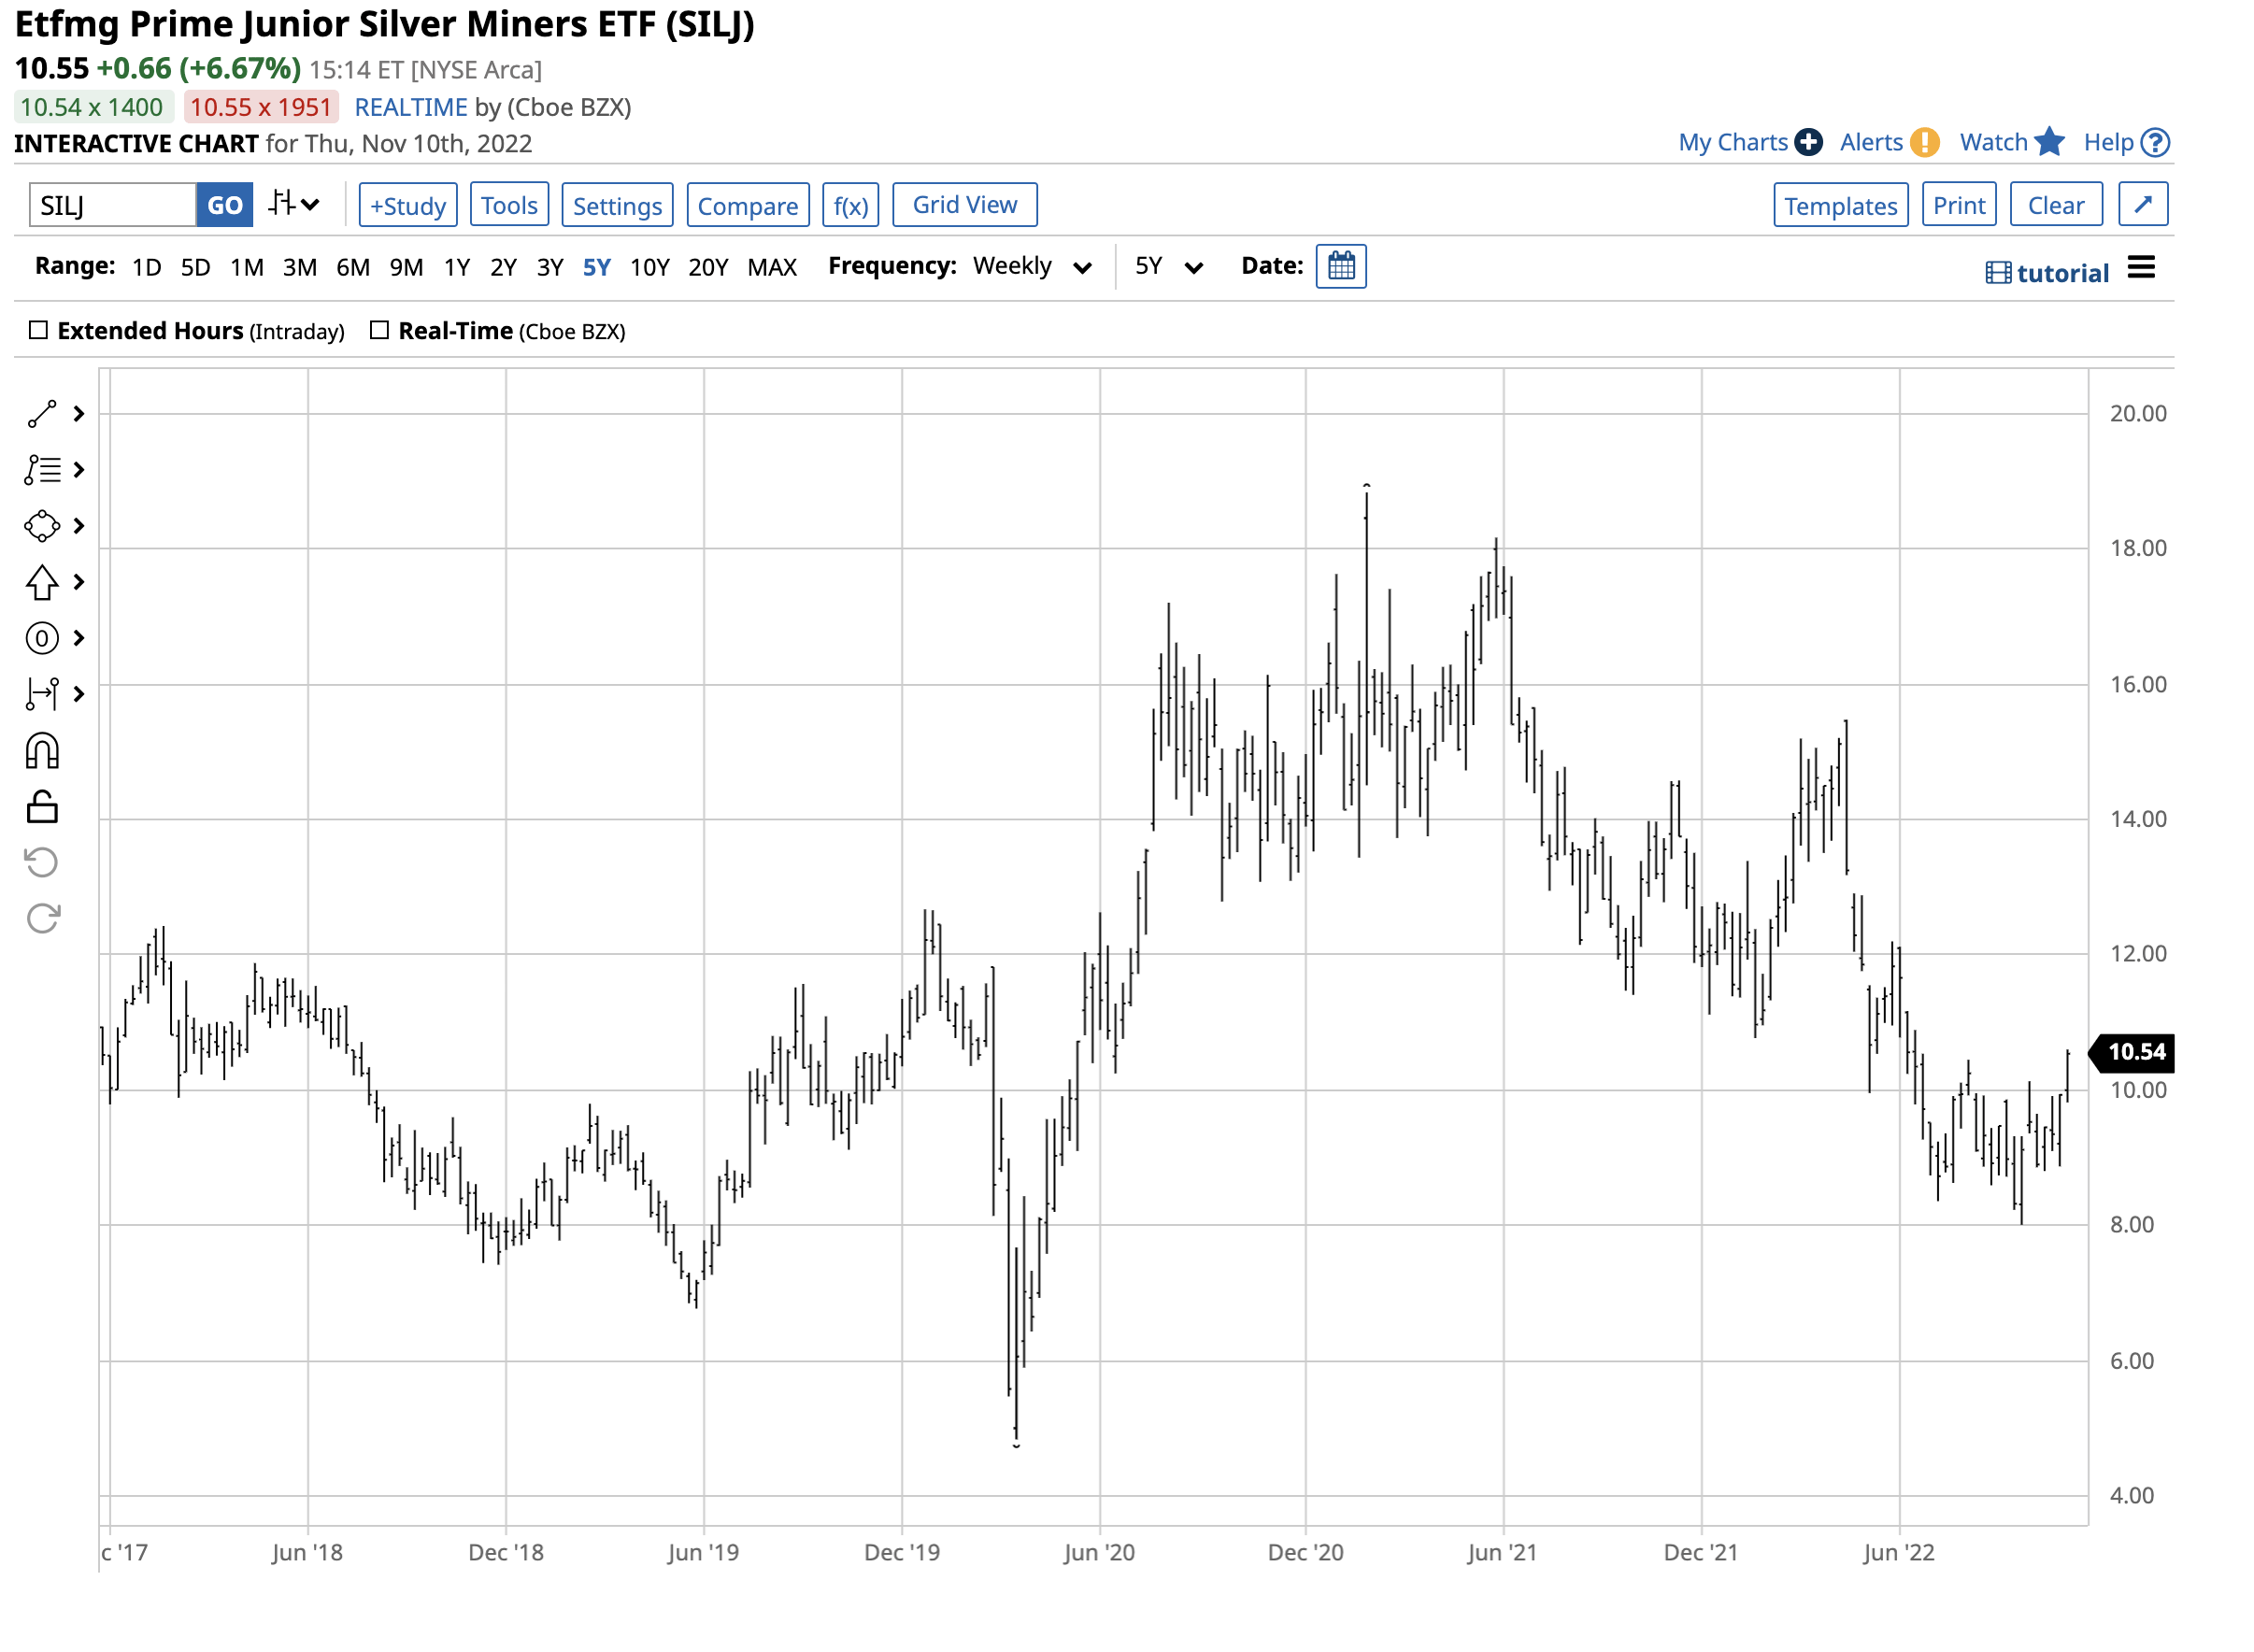
Chart of the SILF ETF Product (Barchart)
The chart shows that more leveraged SILJ ETF exploded from $4.84 to $17.21 per share or 255.6% during the period.
Junior mining companies tend to outperform senior miners on the upside for two reasons. The junior miners extract lower-grade ores, yielding more substantial profits in bull markets. Moreover, the junior miners attract more speculative interest, boosting the share prices when trend-following longs move into the silver market.
Silver is a compelling metal for the following reasons:
- The trend appears to have turned higher.
- Industrial demand for silver is rising.
- Global inflation remains at the highest level in decades.
- Fiat currency values have declined along with the full faith and credit of governments. The US dollar may be the strongest fiat, but it’s the healthiest horse in the fiat currency glue factory.
- The recent liquidity issues facing the cryptocurrency asset class could trigger a flood of buying in silver and gold. Cryptos have been around since 2010, and Menes declared the initial level of the silver-gold ratio over 5,000 years before cryptos burst on the scene.
Silver could be heading for a new all-time high above the 1980 $50.75 per ounce peak. An explosive move in silver favors outperformance by the silver mining stocks. While SIL will likely outperform silver on a percentage basis during a substantial rally, SILJ stands to do even better.
Be the first to comment