


harmpeti
2022 – A Rough Year For Equity Markets
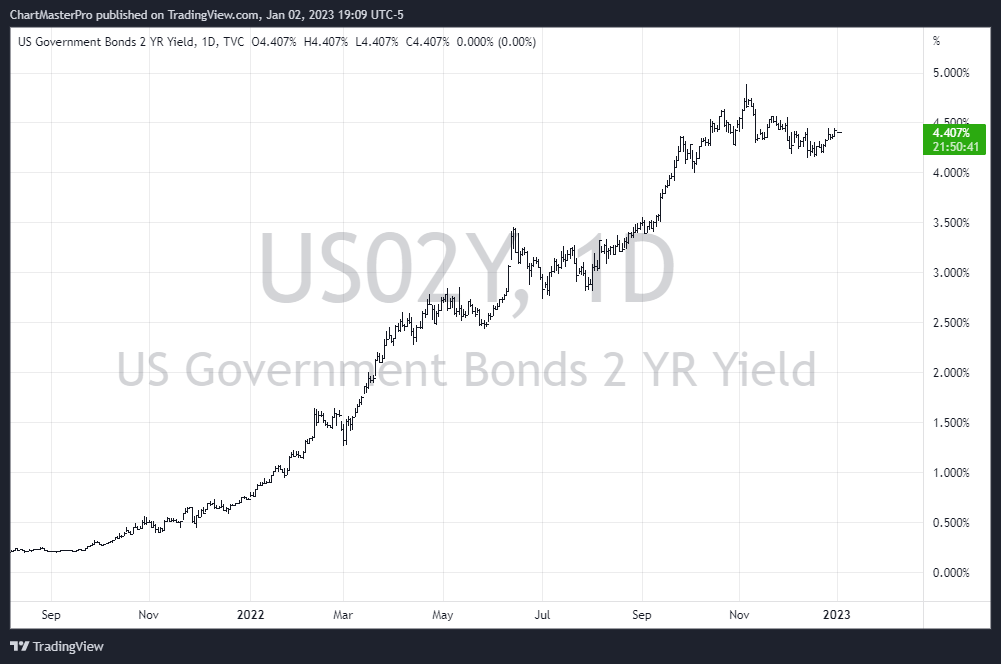
It was a train wreck for equity markets in 2022 as the Fed began its fight against inflation by raising rates seven consecutive times throughout the year. You need look no further than the chart below to understand why equity markets struggled in 2022.
tradingview
The above is the chart for the yield on US Govt 2 Yr Bonds – they began the year with a yield of 0.77% and ended the year with a yield of 4.40% – that’s a whopping increase of 475% over twelve months – no wonder equity markets rolled off the tracks!
Below are the 2022 returns for the major indices, sectors, and few big cap stocks for the year.
| SP500 | -19.91% |
| Nasdaq 100 | -33.27% |
| Dow Jones | -8.74% |
| Russell 2000 | -22.06% |
| US Transports | -22.97% |
| Energy Sector | +57.38% |
| AAPL | -26.94% |
| AMZN | -49.87% |
| MSFT | -28.49% |
| GOOGL | -39.17% |
| META | -64.43% |
| TSLA | -67.80% |
| Bitcoin | -64.73% |
A sea of negative returns, except for energy, which was the top performing sector for the year thanks to rising crude oil prices and inflation.
2023 – What Lies Ahead for Equity Markets?
The big question going into every year is: Where do we go from here?
For 2023, it will all depend on the following factors:
- When will the Fed stop raising rates?
- Has inflation indeed peaked and will it gradually drop through 2023?
- When and how will the war in Ukraine end?
- How will China’s economy exit the current COVID wave that’s sweeping the country?
- Will the US economy fall into a recession in 2023?
How much further the markets drop in 2023 will depend on the outcomes to these five questions.
Below is a chart of the S&P 500 on which we’ve overlayed the Fibonacci Retracement levels drawn from the lows of March 2020 to the highs of January 2022.
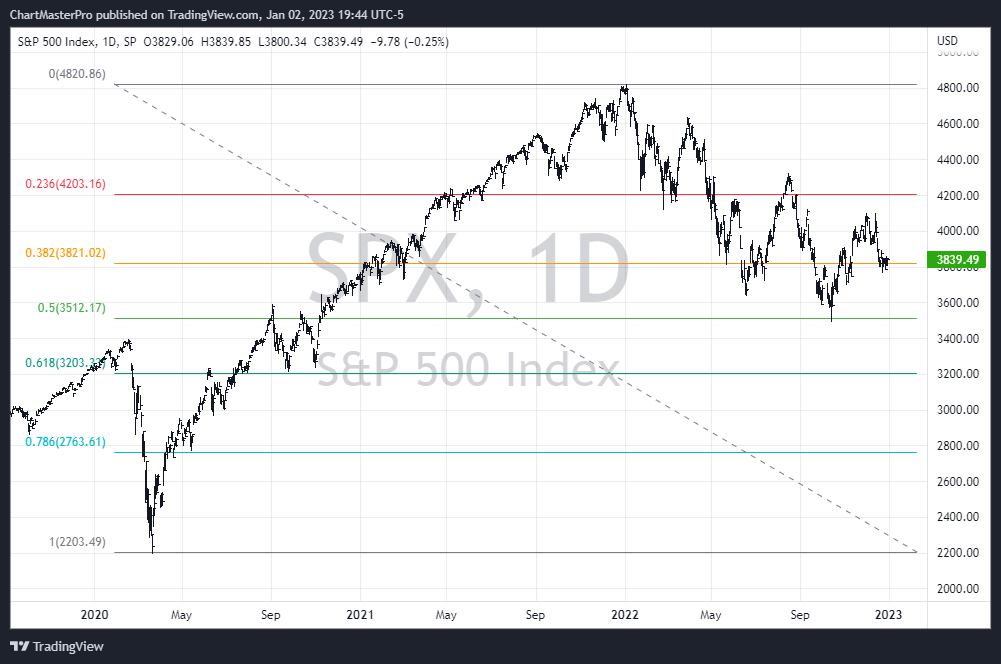
Fibonacci Retracement Levels (TradingView)
You can see in the chart above that the index stopped right at the 50% retracement level on Oct. 13 when it set the low for year – it then rallied from this level and ended the year right at the 38% retracement level – the Fibonacci levels are respected by the markets – whether this is because of algorithms or human nature, we’re not sure, but these levels are respected.
So the potential downside targets for the S&P 500 in 2023 would be as follows:
- 3,512
- 3,203
- 2,763
These are the next three Fibonacci retracement levels to the downside – how far we drop will depend on how the five questions we posed above are resolved throughout the year.
A worst case scenario where we get no positive resolutions to our five questions will bring the index down to the 2,763 level – a case scenario where we get favorable outcomes for one or two of the questions would bring us down to the 3,203 level, and a case scenario where we get favorable outcomes for three or more of the questions could see the index only drop as low as the October lows of 3,500 before rallying higher.
If we were to get favorable outcomes for all five questions in 2023 (highly unlikely) we could see the index rally back to the 4,800 level by the end of the year.
The Options Trader – 2022 Returns
How did we fare for the year? Not too bad at all, considering that we trade call and put options with high leverage, which is like trading the markets with a very sharp double-edged sword.
In 2022 we executed a total of 98 options trades – 80 were winning trades, and 18 were losing trades, for a winning trade percentage of 81.63% for the year. This is a very high winning percentage, but our total return could have/should have been higher if we had done a better job at managing our losing trades and minimizing the losses.
Average Gain Per Winning Trade
Our average gain per winning trade was 28.08% on 80 trades, with our biggest gain of the year being a 73.10% gain on AMD (AMD) calls in May.
Average Loss Per Losing Trade
Our average loss per losing trade was 32.07% on 18 trades, with our biggest loss of the year being a 100% loss on Caterpillar (CAT) puts in December.
Mix of Long and Short Trades
We like to trade both sides of the markets – we buy calls for bullish trades and we buy puts for bearish trades.
Out of our 98 trades in 2022, 76 were LONG trades and 22 were SHORT trades – our bias was clearly on the LONG side for the year – we will aim for a more balanced approach in 2023.
2022 Total Return
Our total return for the year was 17.03% – as I mentioned this return would have been higher if we had avoided just a few big losses on some losing trades.
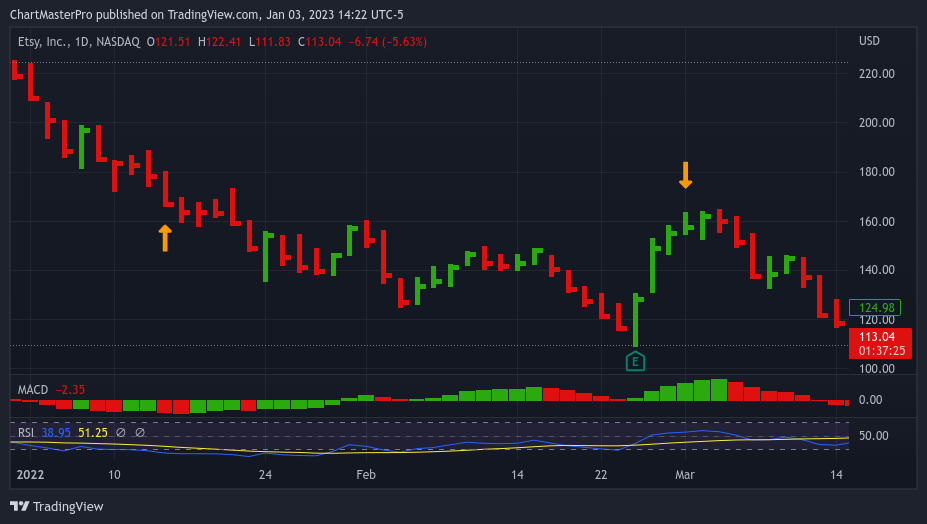
Up until February we did an excellent job of keeping our losses small – in the first two months of the year we had only three losing trades with losses of 4.76%, 7.75%, and 3.51%. But then in March we took a 50.44% loss on a long trade on Etsy (ETSY) (see chart below for the trade summary) – losses like this damage the total return for the year. Discipline is extremely important when trading options, and if you let go of discipline even for a few days, the market will punish you.
Sample Losing Trade – Long Etsy Inc.
Below is a trade where we went long ETSY when the RSI for the stock dipped below 25.00 (we are providing trade summaries for two identical trade set-ups, one that didn’t work (ETSY) and one that did CrowdStrike Holdings (CRWD), to point out how important trade management is when trading options).
TradingView
We bought ETSY on January 13, 2022 when the RSI for the stock dropped to 24.37 – which is extreme oversold territory – whenever the RSI dips below 25 there is a high probability that the stock will bounce over the next few trading days – but in this case, it did not bounce. This is the hardest part of trading – what do you do when a trade moves against you? And it becomes even more important when you are trading options with high leverage – it does not take much of a move against you to find yourself in a deep hole within a short period of time.
With this trade the stock did not bounce out of oversold territory – instead it traded sideways for the next three trading days (yellow flag – the stock did not find buyers even though it was in extreme oversold territory) – then on January 20 we got a very bearish intraday reversal to the downside (red flag – this price action screamed “GET OUT” as it showed that the bears were in full control of the price action). But I did not get out.
Instead, I stubbornly held on, hoping that the stock would soon bounce out of oversold – but as someone once said, “Hope is not a trading strategy.”
I should have sold my calls on January 20 and moved on – the trade did not work – I should have accepted what the price action was telling me and sold the calls.
The stock then proceeded to drip lower for almost a full month! It hit a low of $109.38 on February 24 – I bought the calls on January 13 when the stock was at $166.80.
Luckily, the stock climbed from $109 to $160 after it reported earnings on Feb. 24 and I was able to exit the trade with at least half my capital intact – but this is not the way to trade options.
How can we avoid similar mistakes going forward? We must employ a stop-loss on every trade in order to minimize losses and avoid getting trapped in losing trades for too long.
For 2023 we will use a three-day stop-loss after entering a trade – if a trade is not profitable after three trading days we will exit the trade – from our experience, winning trades work right away, and losing trades move against you right away. With options trades we do not have the luxury of waiting because all options expire, and the longer you hold onto a losing options trade the more time value you lose on the option as the days tick by. Time is not your friend when buying calls and put options – each passing day a little bit of time value melts away.
Sample Winning Trade – Long CrowdStrike Holdings Inc.
One trade set-up that we used quite often in 2022 was the RSI Oversold trade – when the RSI for a stock drops below 30 we consider the stock to be in oversold territory – if the RSI drops below the 25 level, we consider the stock to be in extreme oversold territory – when this occurs we buy calls on the expectation that the stock will bounce out of oversold territory over the next few trading days – this is designed to be a short-term trade.
Below is an RSI Oversold trade that worked out – we went LONG CRWD when the RSI for the stock dipped below 25.00.
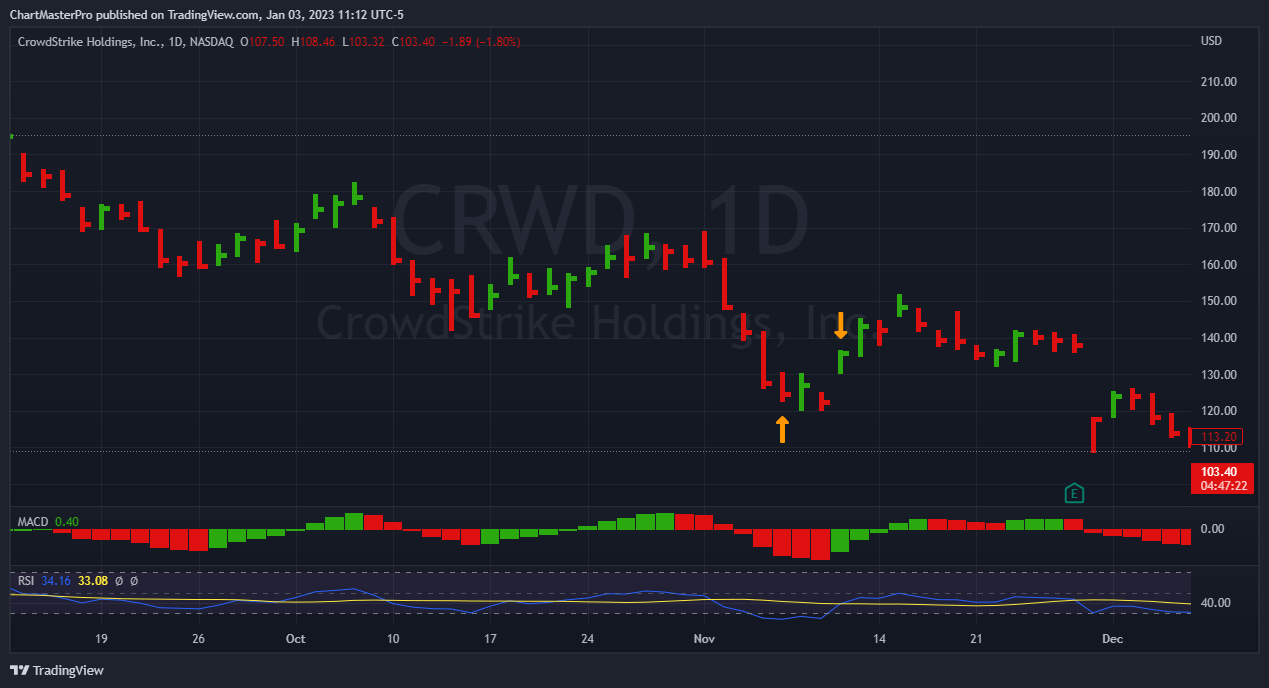
CRWD (TradingView)
We bought the CRWD 16DEC22 125 calls on Nov 7 at $11.32 when the RSI for the stock dropped to 24.20 – this is extreme oversold territory – the next trading day the stock climbed 1.86% but then on Nov 9 it dropped back down 3.65% – a false bounce – but the RSI was still in oversold territory, so we held on to the trade – on Nov 10 we got the bounce out of oversold – the stock popped 10% and we sold our calls for $17.40 for a gain of 53.71% on the trade.
Conclusion
In regards to our options trades, the one thing we will look to improve on in 2023 is limiting the losses on our losing trades by implementing a hard three-day stop loss on all trades – this will be the key in improving our total portfolio return for the year – especially if we can maintain a winning trade percentage that is over 70% for our trades.
With regard to the markets, we think it will most probably be another rough ride for the first half of the year with the S&P 500 dropping down to the 3,200 level – but if we can get a positive resolution to at least three of our five questions going into the second half of the year we could see the markets rally back up to the 4,200 level by the end of the year. We don’t think we will get enough positive resolutions in 2023 to push the index back up to the 4,800 level.
Trade well and prosper!
Be the first to comment