

akinbostanci
By David Brady
StockCharts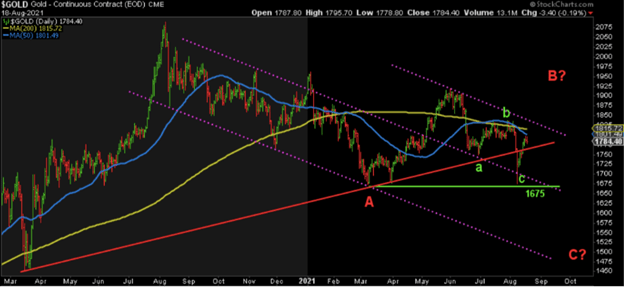
I first shared this chart in an article for Sprott Money back in July 2021. It shows a classic A-B-C correction, where the size of wave C = A. The only unknown is the peak in B. Once we reach the bottom of C, the next rally begins.
This is what the chart looks like today, now that we know the peak in B:
StockCharts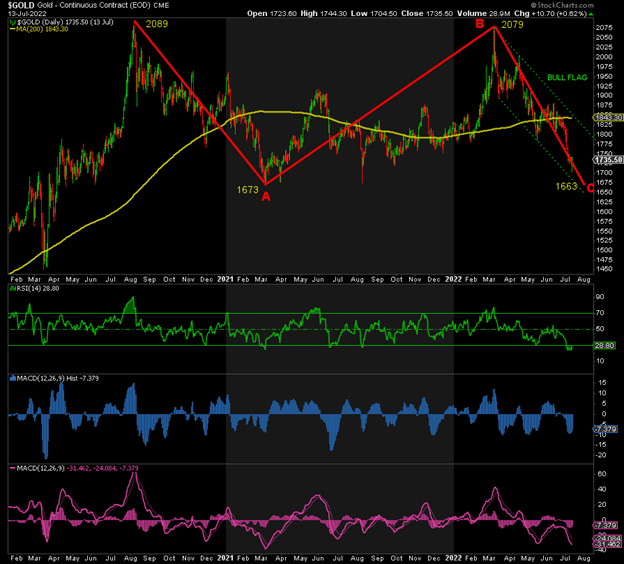
Wave A = 2089 – 1673, a drop of $416
Wave B = 1673 – 2079
Wave C = 2079 – 1663, also a drop of $416
The size of the drop in wave C is the same as that in wave A. Now, it does not have to be perfect – Gold could fall to 1660, 1650, or even 1675 holds – but you get the picture.
Such ABC corrections typically complete when wave C = A, but it is not atypical to see wave C = 1.618*wave A. In such a scenario, wave C could fall as low as $673 (1.618*416) to 1405 before bottoming out. Given how bearish and oversold Gold already is, this is highly unlikely.
StockCharts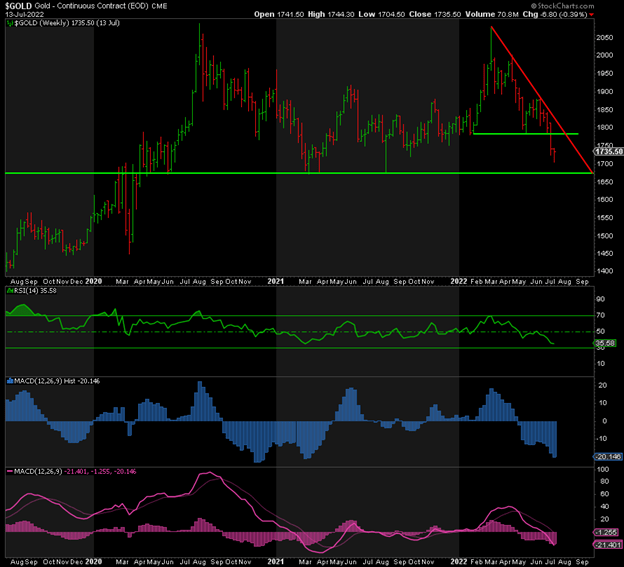
The weekly chart above shows that the RSI is lower than it was in March 2020. Think about that. The last time it was lower than this was at 1167 in August 2018. The MACDs are at their lowest levels since the bottom at 1673 in March 2021.
In summary, from a risk-reward profile, the technical data is signaling a massive skew to the upside in Gold relative to the downside risk.
The COT positioning data also shows the Banks slashing their shorts to levels not seen since June 2019 when Gold was in the 1300s. While they can continue to cut their shorts, pushing the price lower, their current positioning is bullish. The more they cut their shorts, the more bullish it becomes.
Sentiment is still relatively neutral in Gold but falling fast, IMHO. By contrast, sentiment has been crushed in Silver and the miners.
Simply stated, the data does not signal the bottom is in yet. We need a break of resistance and a series of higher highs and lows for that. But it does signal that the remaining downside is miniscule when compared to the potential upside.
When I look at my FIPEST xM process, this is what I see:
Author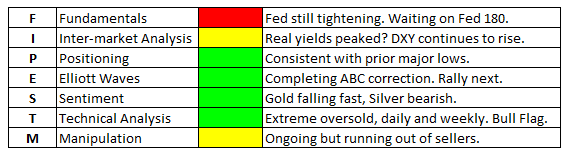
The beauty of this process is that it is time-tested, data-based, and uses multiple tools (rather than just one or two) to identify the lows. When they all point in the same direction, I’m all in. Unfortunately, the Fed’s tightening policy and the activities of the Bullion Banks continue to push prices lower and delay the inevitable rally to come. Once the Fed does pivot, the Banks will get out of the way for fear of being run over. A break back above 1785 and a series of higher lows and higher highs would also suffice. Until then, we just have to grin and bear this correction for a little longer.
Editor’s Note: The summary bullets for this article were chosen by Seeking Alpha editors.
Be the first to comment