


DiamondGalaxy/iStock via Getty Images
Undoubtedly one of the most well-known brands in the jewelry space is Signet Jewelers (NYSE:SIG). With a large retail footprint and a growing e-commerce operation, the firm is truly a major player in the market. Sadly, for years, financial performance for the business was in a state of deterioration. This was exacerbated by the COVID-19 pandemic. But fast forward to today and you will see that the picture for the business is showing strong signs of improving. Add on top of this the fact that shares of the enterprise look cheap at this point in time, and it could make for an attractive opportunity for long-term, value-oriented investors. Of course, this picture could change at any moment, especially given the volatility the enterprise has seen recently. That is why the next couple of days will be particularly important for shareholders. This is because management is due to report financial performance covering the first quarter of the company’s 2023 fiscal year before the market opens on June 9th. How the business fares will go a long way to determining what the future of the enterprise looks like. As such, investors should be wise to keep a watchful eye on what results do come out.
A big player undergoing major changes
As I mentioned already, Signet Jewelers is a major player in the jewelry market. Operationally speaking, the company focuses in large part on retailing diamond jewelry. Most of its sales are made through its physical stores. As of the end of its 2022 fiscal year, the company boasted 2,854 locations worldwide. Of these, only 348 were located in international markets. The remaining 2,506 retail outlets were spread across North America. 1,602 of these North American stores are located in malls, including mall-based kiosks under the Banter by Piercing Pagoda banner, while the remaining 904 locations are housed in more traditional retail settings.
Over the years, Signet Jewelers has developed many of its own brands and it has absorbed the brands of other players. For instance, the company currently owns Kay Jewelers, which operates as the largest specialty retail jewelry brand in the US. 38% of the company’s revenue came from that segment during its 2022 fiscal year. The company also owns Zales, the third-largest specialty retail jewelry brand in the country. Sales from it accounted for 22% of the firm’s revenue last year. Jared The Galleria of Jewelry, the fourth largest US specialty retail jewelry brand, is also owned by Signet Jewelers, accounting for 17% of its revenue. It also owns a variety of other brands such as Banter by Piercing Pagoda, JamesAllen.com, and Peoples Jewellers.
In November of 2021, Signet Jewelers also acquired Diamonds Direct after acquiring Rocksbox, a jewelry rental subscription business, just a few months earlier. The company’s international brands include H.Samuel and Ernest Jones, each of which made up only 3% of the company’s revenue in 2022. In terms of overall product lines, the company said that 47% of revenue came from the bridal category last year. This was followed by fashion at 46%. Watches made up just 6% of revenue despite accounting for an impressive 33% of international revenue. And all other products accounted for the remaining 1% of sales.
As you can probably tell by now, Signet Jewelers has undergone a significant amount of change in recent years. In its annual report, the company claimed that, in fiscal year 2022, it completed its three-year transformation plan called Path to Brilliance. This plan focused on a few key objectives, including an emphasis on ensuring that its largest operations are healthy, focusing on expanding access to both luxury and value products, growing the company’s service revenue to eventually hit $1 billion annually, and emphasizing the growth of its e-commerce business. On this last item, the company does seem to have performed exceptionally well. During its latest fiscal year, e-commerce revenue totaled $1.5 billion in all. That’s up from the $1.2 billion seen just one year earlier.
Author – SEC EDGAR Data
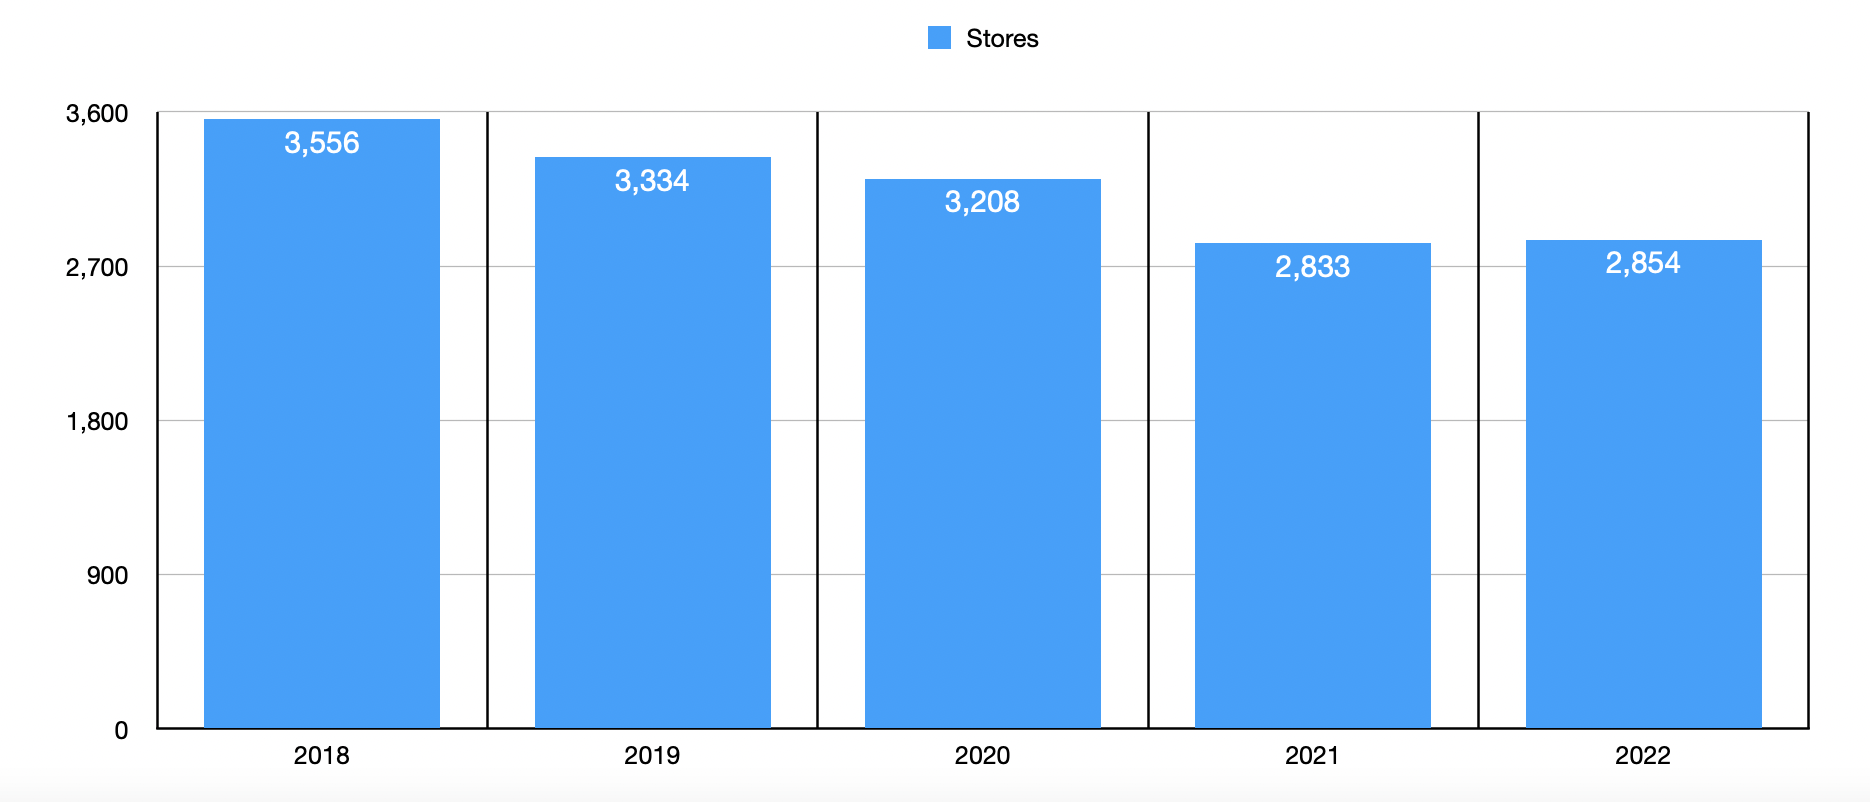
At first glance, it looks as though management is correct in saying that it has turned the ship around. Revenue fell each year from at least 2018 through 2021, with sales declining from $6.25 billion to $5.23 billion. Then, in 2022, revenue skyrocketed, coming in at $7.83 billion. According to management, this 49.7% rise in revenue was driven in large part by a 48.5% rise in comparable-store sales across the company’s system. Its digital operations certainly helped on this front, with total e-commerce revenue accounting for 19.3% of overall sales. Beyond this, we do have some additional data. For instance, in North America, the number of merchandise transactions the company experienced rose by 29.2%. For its international markets, the rise was even more impressive at 30.7%. On top of this, the average merchandise transaction value the company saw in North America also came in strong, totaling $448 compared to the $392 experienced just one year earlier. Unfortunately, that 14.3% improvement was offset by a 17.3% decline in the much smaller international segment. One big headwind the business had faced in recent years was a continued decline in the number of locations in operation. This number fell from 3,556 in 2018 to 2,833 in 2021. However, in 2022, due in large part to some acquisitions, the firm saw its location count inch up to 2,854.
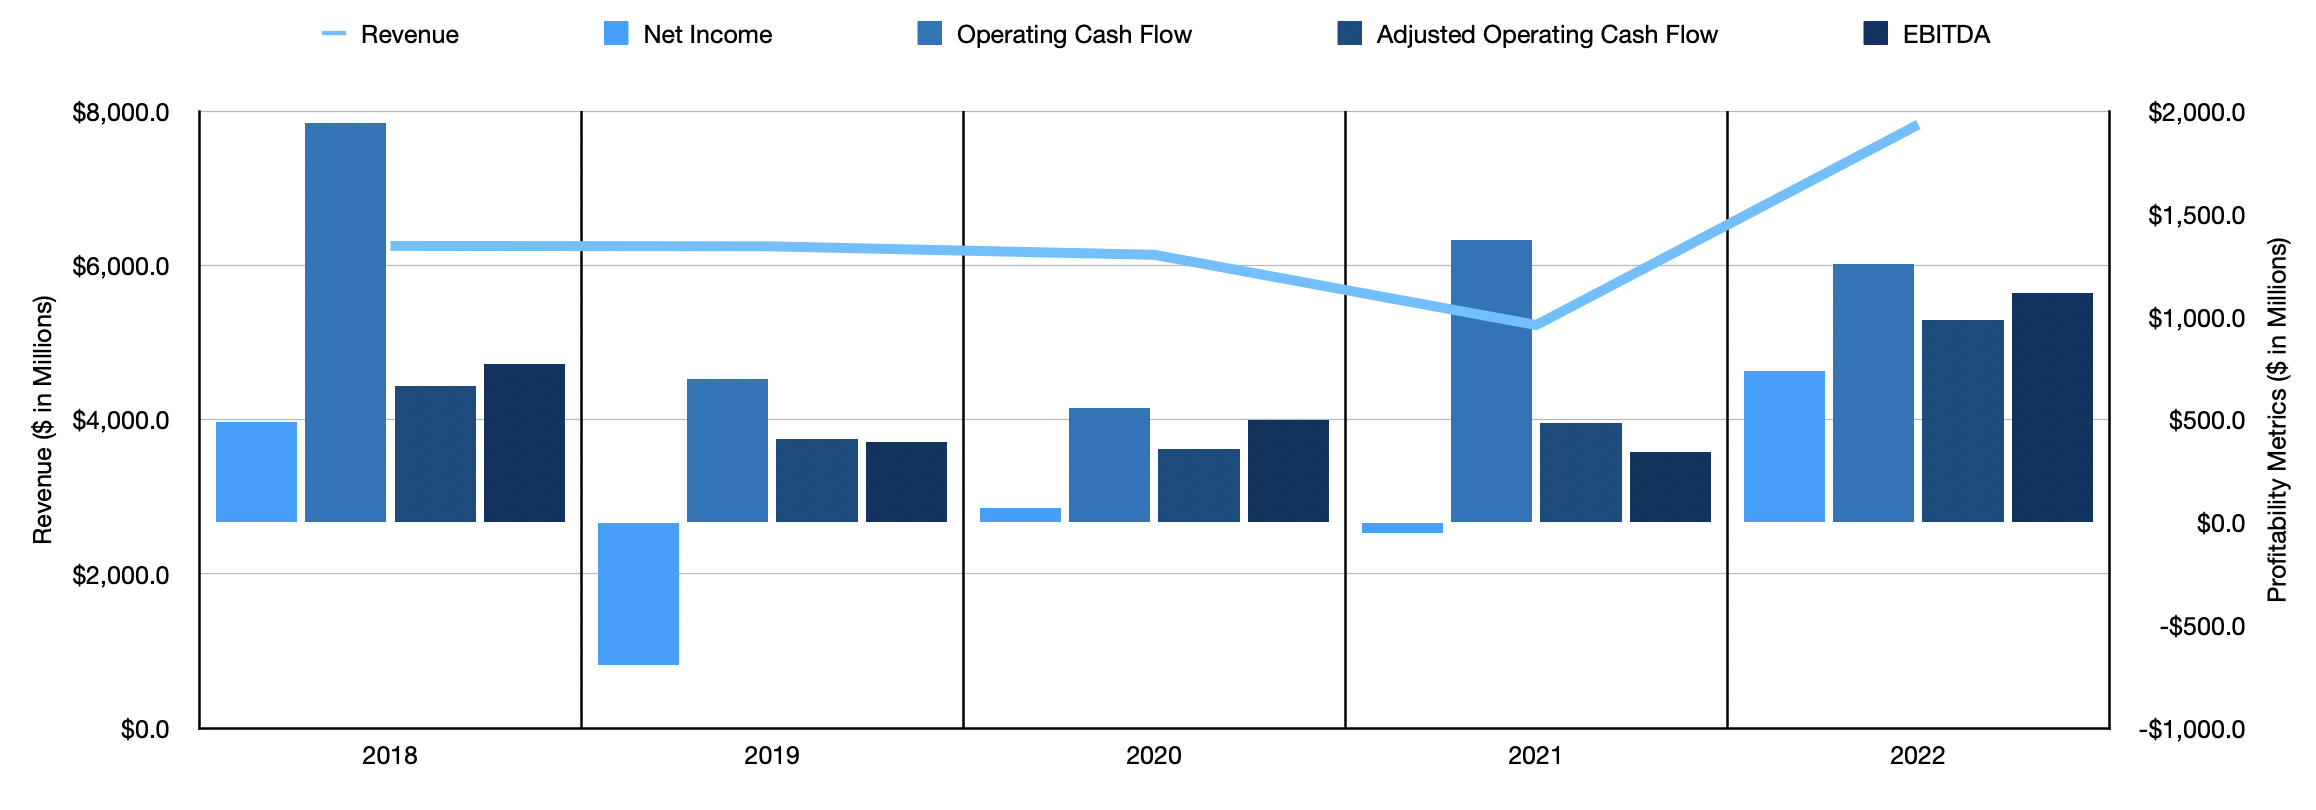
Author – SEC EDGAR Data
When it comes to profitability, the picture has been far more volatile. Net income has been all over the map in recent years, ranging from a low point of negative $690.3 million to a high point of $735.4 million. The trend for operating cash flow has been a bit better. After dropping from $1.94 billion in 2018 to $555.7 million in 2020, the metric increased to $1.37 billion in 2021 before dipping slightly to $1.26 billion last year. Even EBITDA has been quite lumpy, showing no real trend from year to year or over an extended time frame. But in 2022, the metric came in at $1.07 billion.
As a value-oriented investor, this kind of volatility makes me uncomfortable. I understand that the business has been undergoing some significant changes. But that just muddies the waters. That is why, in my opinion, what the company reports for the first quarter of its 2023 fiscal year will prove to be incredibly important. Currently, the company is expecting revenue of between $1.78 billion and $1.81 billion. Analysts currently anticipate revenue of $1.81 billion for the quarter. By comparison, revenue the same time last year was $1.69 billion. For the entire fiscal year as a whole, the company anticipates revenue of between $8.03 billion and $8.25 billion. At the midpoint, this would imply an increase of 4% year over year. Earnings per share for the entire year should be between $12.28 and $13.00. No guidance was given for quarterly earnings, but based on management expectations for operating income for the quarter, earnings per share should be around $2.42. That compares to the $2.23 generated the same time last year, but it would be down from the $2.47 that analysts anticipate.
Author – SEC EDGAR Data
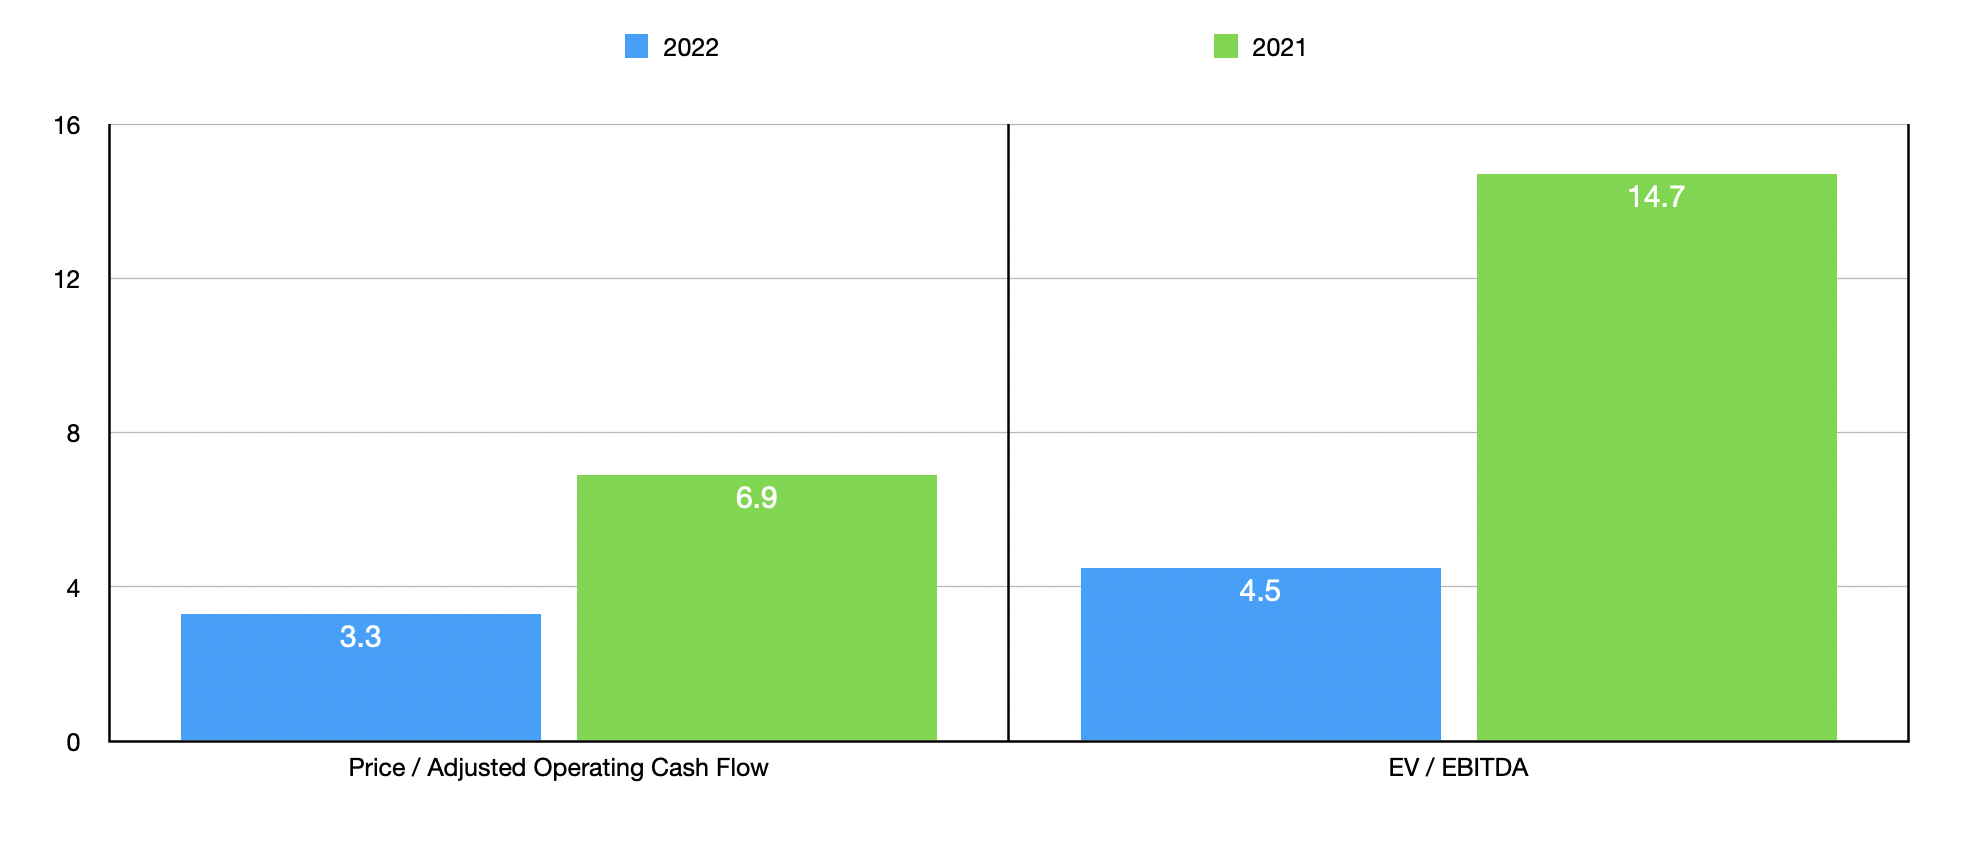
When it comes to valuing the company, I don’t feel comfortable using the price-to-earnings approach. I feel like the volatility the company continues to see on that front makes this an unreliable metric. However, if we price the company based on operating cash flow and on EBITDA, things make more sense. Using our 2022 figures, the price to operating cash flow multiple for the firm should be 3.3. This compares to the 6.9 reading that we get if we use 2021 data. The EV to EBITDA multiple for the company, meanwhile, should be 4.5. That compares to the 14.7 reading that we would get using our 2021 data. To put this in perspective, I decided to price the company against four similar firms. On a price to operating cash flow basis, these companies ranged from a low of 6.5 to a high of 12.9. Our 2021 approach to valuing the business would result in one of the four companies being cheaper, while the 2022 data would result in Signet Jewelers being the cheapest. Using the EV to EBITDA approach, the range would be from 3.7 to 10, with the 2021 data making our target the most expensive while the 2022 data would result in two of the four companies being cheaper.
| Company | Price / Operating Cash Flow | EV / EBITDA |
| Signet Jewelers | 3.3 | 4.5 |
| Pandora A/S (OTCPK:PANDY) | 9.1 | 3.9 |
| Movado Group (MOV) | 6.5 | 3.9 |
| Fossil Group (FOSL) | 10.7 | 3.7 |
| National Vision Holdings (EYE) | 12.9 | 10.0 |
Takeaway
The past few years have been very interesting for shareholders in Signet Jewelers. The company does seem to be doing better now than it has done in a very long time. However, these are uncertain times and it’s difficult to quantify how much of the increase in revenue and profitability we are seeing is temporary. I would generally shy away from a company with these traits because of the uncertainty. Having said that, I’m encouraged by the fact that shares don’t look unreasonably pricey on an absolute basis even if we assume financial results revert back to what we saw in 2021. Because of this, I see Signet Jewelers as a favorable risk to reward prospect and, as such, have decided to rate it a ‘buy’, a rating that I don’t expect will change unless we see something negative when the business reports earnings this week.
Be the first to comment