

AvigatorPhotographer
By Fiona Boal
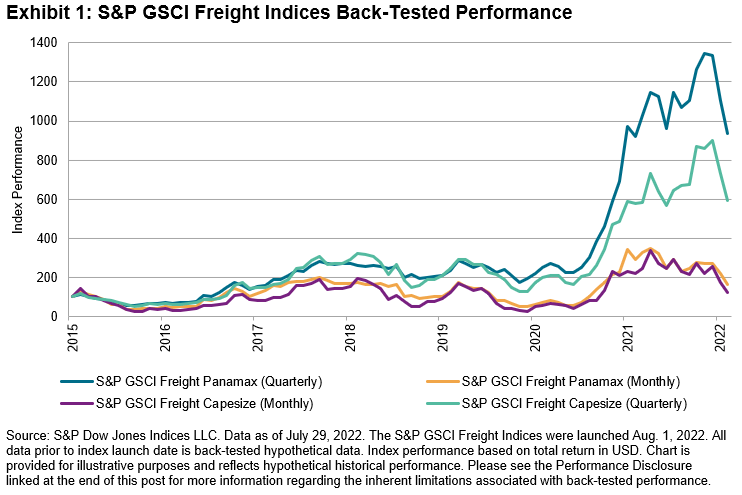
On Aug. 1, 2022, S&P Dow Jones Indices (S&P DJI) launched a series of S&P GSCI Freight Indices, the first of their kind in the market and an expansion of the single-commodity offering of indices based on the S&P GSCI. The S&P GSCI Freight Indices are designed to provide reliable and publicly available performance benchmarks for the largest dry bulk freight markets. The indices are based on the Baltic Exchange’s monthly and quarterly forward freight agreements (FFAs). The index series includes the following.
- S&P GSCI Freight Capesize (Monthly)
- S&P GSCI Freight Capesize (Quarterly)
- S&P GSCI Freight Panamax (Monthly)
- S&P GSCI Freight Panamax (Quarterly)
As the main shipping derivative instrument, FFAs track the average daily chartering cost (vessel income) for a standard-sized vessel that performs a voyage via one of the main shipping routes. FFAs are cash-settled futures contracts that are traded over the counter via voice brokers and are subsequently novated to exchanges such as SGX, ICE, CME, and EEX for clearing and ongoing margin management. These contracts have traditionally been used by shipowners and commodity trading houses for hedging their freight exposure.
The dry bulk market is the largest of the shipping sectors and has the deepest and most liquid FFA market. The sector is dominated by two vessel types, Capesize and Kamsarmax (referred to as Panamax for legacy purposes). FFA volumes in these vessel types explain essentially all of the underlying physical dry bulk market flows, so indices based on these contracts are a logical first foray into the dry bulk market for financial industry participants.
- Capesize: broadly the largest standard size of the dry bulk carriers. Vessels carry mainly iron ore and coal and are employed across a small number of routes, typically moving cargos from Australia and Brazil to China.
- Panamax: the second-largest standard size of the dry bulk carriers. Vessels carry coal, grains, and other agricultural products as well as iron ore, and minor bulks such as bauxite, alumina, copper, phosphate rock, and cement.
Exposure to freight rates varies by vessel type and trade route, although in most cases, freight represents a noticeable percentage of the final value of a commodity. For example, on average, freight accounts for 20% of the overall cost of iron ore exported from Brazil to China. As a major component of the cost of raw materials, it is important for financial market participants to have access to replicable and investable dry bulk freight indices.
Disruptions to global supply chains over the past few years have put the global freight market in the spotlight, highlighting its important link in the chain of the world economy and contribution to international trade. Freight rates are driven by the balance between demand for seaborne trade and supply of cargo capacity. The former is correlated to economic activity and industrial production and is also affected by prevailing demand conditions in specific commodity markets. The latter depends on the size of the global fleet, its utilization rates, and, as witnessed during the COVID-19 pandemic and more recently the Russia-Ukraine conflict, shocks caused by disruptions to the free movement of people and vessels.
As global market participants increasingly seek to diversify their investments and look for alternative vehicles to tap into the niche market segments, the S&P GSCI Freight Index Series could be a meaningful gauge of global economic activity, seaborne trade, and individual commodity and geographic market dynamics.
Disclosure: Copyright © 2022 S&P Dow Jones Indices LLC, a division of S&P Global. All rights reserved. This material is reproduced with the prior written consent of S&P DJI. For more information on S&P DJI please visit www.spdji.com. For full terms of use and disclosures please visit Terms of Use.
Editor’s Note: The summary bullets for this article were chosen by Seeking Alpha editors.
Be the first to comment