

Torsten Asmus
Since the COVID panic bottom in the spring of 2020, commodities have been the best-performing asset class, significantly outperforming stocks and bonds. Energy, driven by higher oil prices, has been the best-performing stock sector.
But as the global economy goes from boom to bust and central banks around the world tighten monetary policy to try to fight inflation caused by their prior easy monetary policies, commodities have now joined stocks, bonds and cryptocurrencies in a bear market downtrend.
If we define a “bear market” as one where prices fall at least 20%, then all major commodities are in a bear market. Here is how much key commodities have fallen so far from their 2022 highs:
- Commodities -24%
- Oil -32%
- Gasoline -43%
- Agriculture -20%
- Copper -32%
- Gold -20%
- Silver -30%
Commodities & Oil
The S&P GSCI Commodity Index is a broad-based commodity index that is 50%+ weighted in energy commodities. The chart below shows this index has fallen below its key 12-month moving average, as well as its upward trend line from the 2020 lows.
This likely signals a potential change in the trend from a bull market to a bear market. We previously discussed the key signals that identify bull and bear markets in this article. We have circled the cyclical commodities bear markets that occurred during the Tech Bust and Great Recession to show what can happen to commodity prices in a recession.
The second clip shows that commodities are still outperforming the S&P 500, which has been in a bear market this year. The third clip shows that long-term price momentum is turning negative, with the Monthly Percentage Price Oscillator (PPO) falling below its Signal line from a similarly high level as in 2008. The fourth clip shows it was recently very overbought on a long-term basis, per the Monthly Relative Strength Index (RSI), which is also eerily similar to 2008. All of this paints a rather bearish technical picture for commodities.
S&P GSCI Commodity Index (StockCharts.com)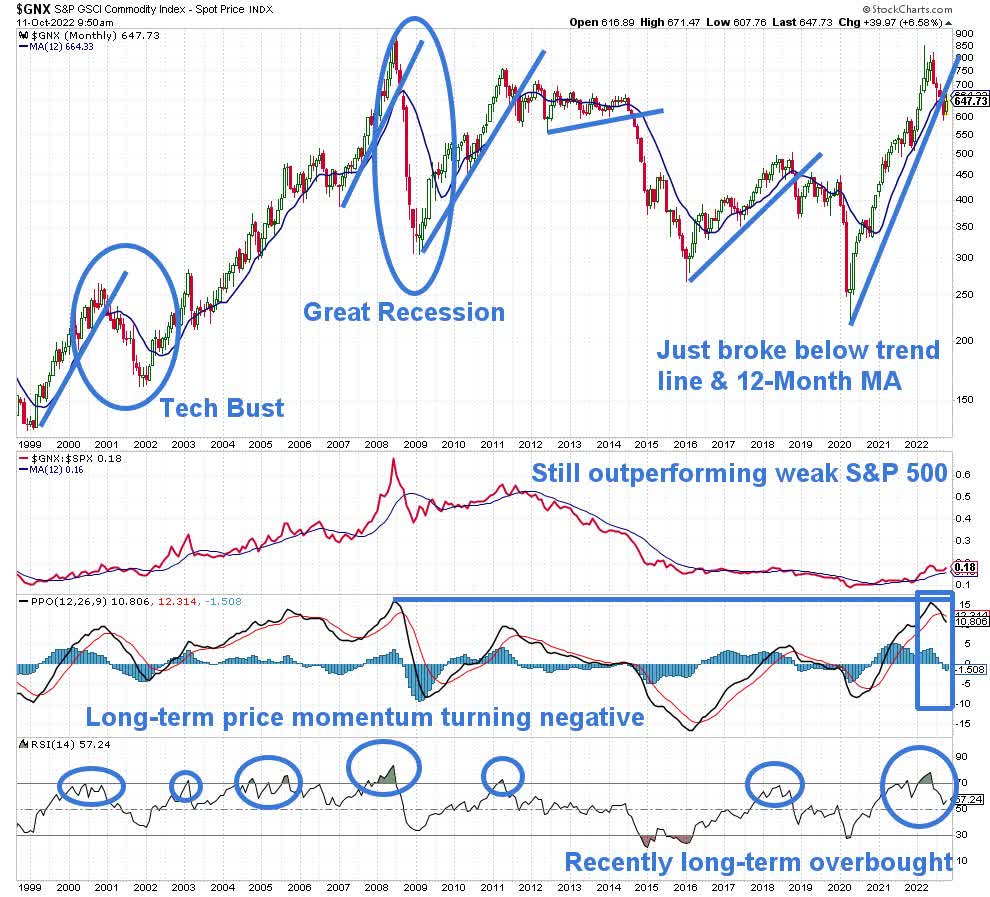
The chart below of oil shows very similar characteristics to the commodities index. Oil has also fallen below its 12-month moving average and upward trend line. It is also still outperforming the weak S&P 500, but long-term price momentum has also turned negative and it was also recently very overbought on a long-term basis.
Oil (StockCharts.com)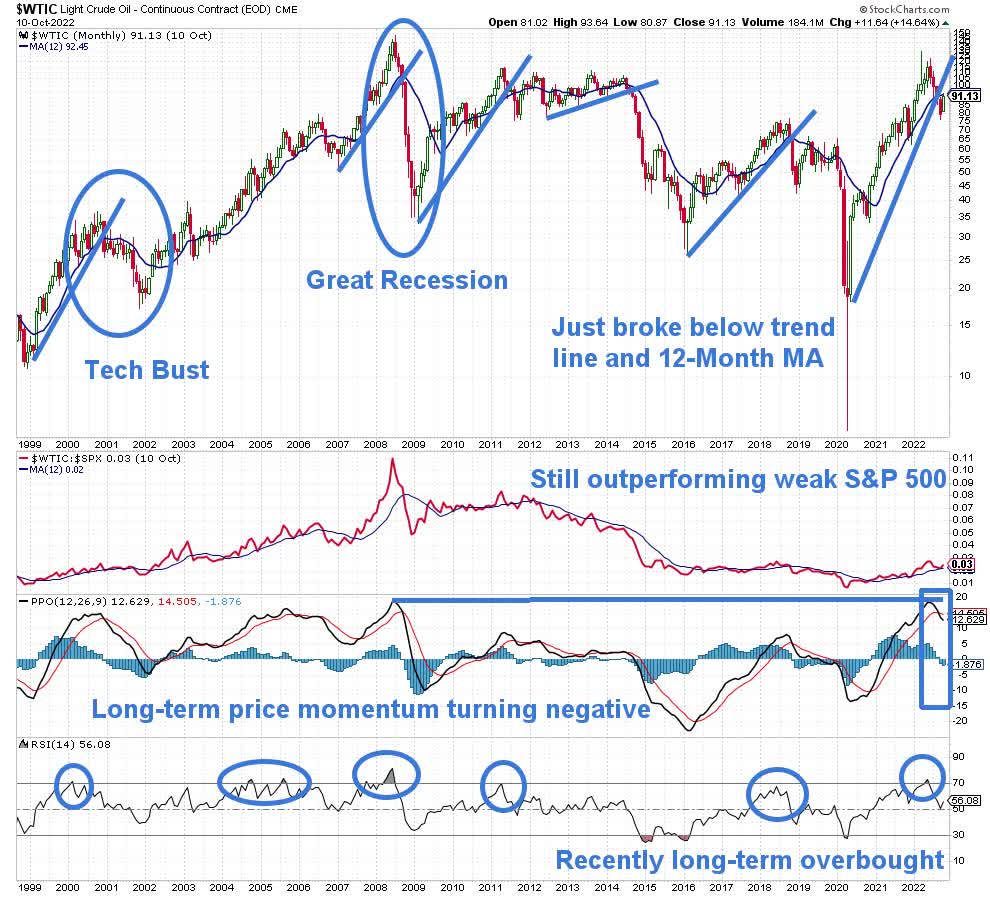
Commodities Can Fall Much Further
The main question now is: how much farther can commodities fall as the global recession takes hold and demand for commodities collapses?
During the Tech Bust of the early 2000s, the S&P GSCI Commodity Index fell 40% and oil fell 54% from October 2000 to November 2001. It was even worse during the Great Recession of 2008-2009, as the S&P GSCI Commodity Index fell 66% and oil fell 77% from July 2008 to February 2009.
A similar collapse or worse could happen now since this recession is likely to be worse than the Great Recession, as we discussed last year, partly because central banks are tightening, rather than easing, monetary policy into a recession.
On The Positive Side
While these bearish trends for commodities and oil help confirm the coming global recession and are bearish for commodity-related stocks and ETFs, the positive of a deepening commodities bear market is that it will help lower inflation, which will enable the Fed to eventually ease monetary policy. This will take time, but it is a positive development that occurs in every recession and enables the eventual economic recovery.
The fall in commodity prices is already easing pricing pressures for companies. The chart below shows the Global Price Pressures Index from S&P Global has fallen to its lowest level in two years and is now in line with its long-run average. The Global Supply Shortages Index has also fallen to a 20-month low. According to S&P Global, ”the latest price and supply indicators from S&P Global add to evidence that cost pressures and supplier shortages at manufacturers worldwide continued to ease in August amid signs of weaker output and demand.”
Commodity Price & Supply Pressures (S&P Global)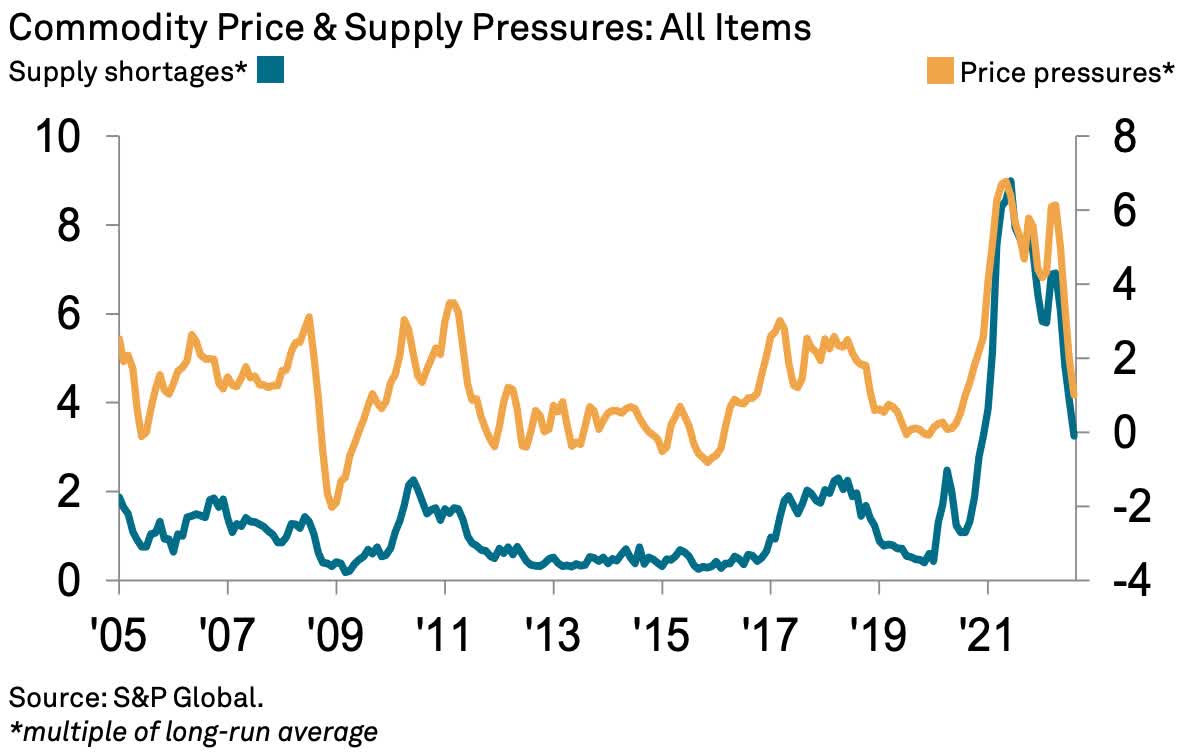
Falling oil prices are also helping lower inflation expectations, as typically happens in recessions, as shown below. The Fed watches inflation expectations closely when determining its monetary policies.
Oil Prices & 5-Year Breakeven Inflation Rate (FRED)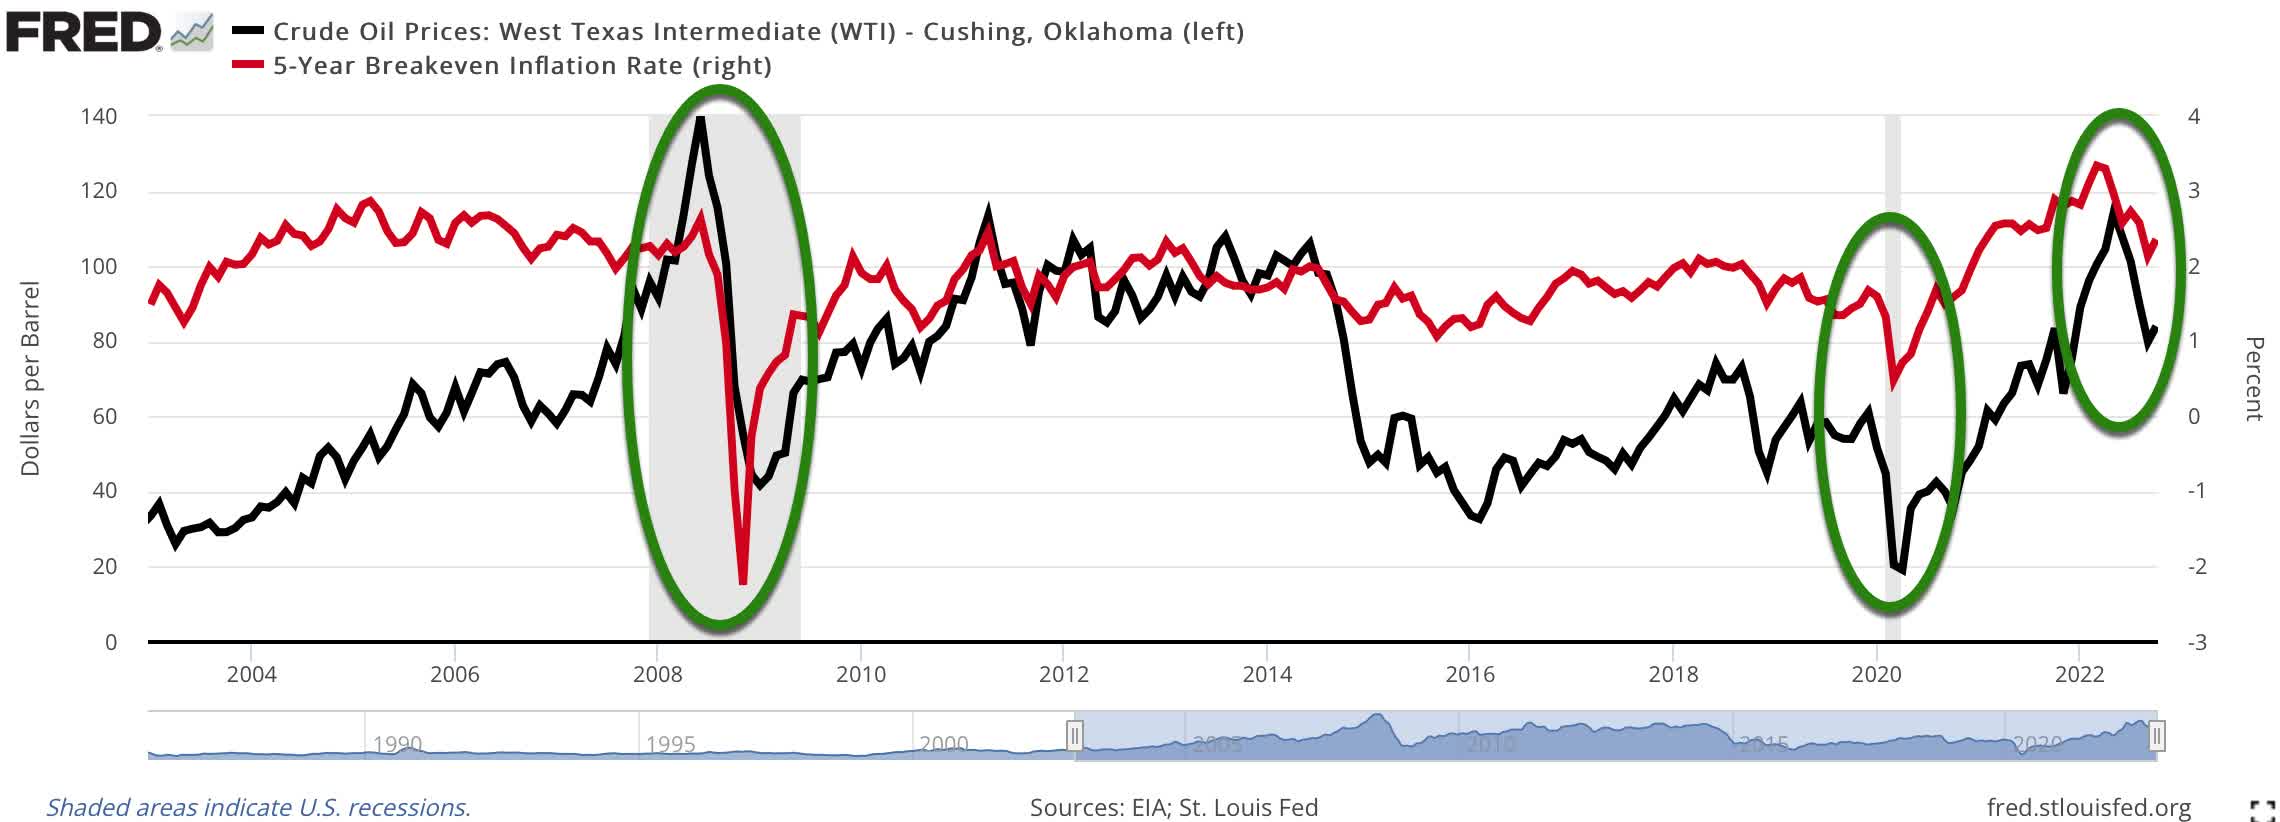
Implications For Investors
The cyclical bull market in commodities is likely over and a new cyclical commodities bear market has likely begun. Thus, investors should generally avoid commodity-related investments and seek ways to profit in this global bear market, such as with our suggestions here.
Be the first to comment