

Don Farrall/DigitalVision via Getty Images
Introduction
When last discussing Shell (NYSE:SHEL), my previous article expected to see monster cash returns coming along with the release of their impending second quarter of 2022 results. Whilst their dividends were left unchanged, thankfully they still announced a very large $6b share buyback program for the third quarter of 2022 along with a very solid set of results. Upon looking deeper into their results and the associated commentary from management, it seems that the best is still coming with $22b of hidden value lurking on the balance sheet, which boosts the future outlook of their moderate dividend yield of 4.54%.
Executive Summary & Ratings
Since many readers are likely short on time, the table below provides a very brief executive summary and ratings for the primary criteria that were assessed. This Google Document provides a list of all my equivalent ratings as well as more information regarding my rating system. The following section provides a detailed analysis for those readers who are wishing to dig deeper into their situation.
Author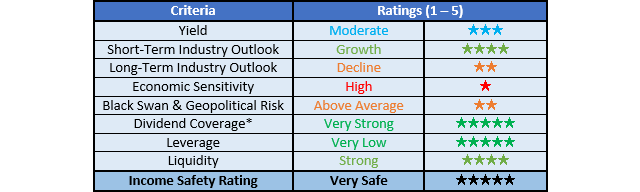
*Instead of simply assessing dividend coverage through earnings per share cash flow, I prefer to utilize free cash flow since it provides the toughest criteria and also best captures the true impact upon their financial position.
Detailed Analysis
Author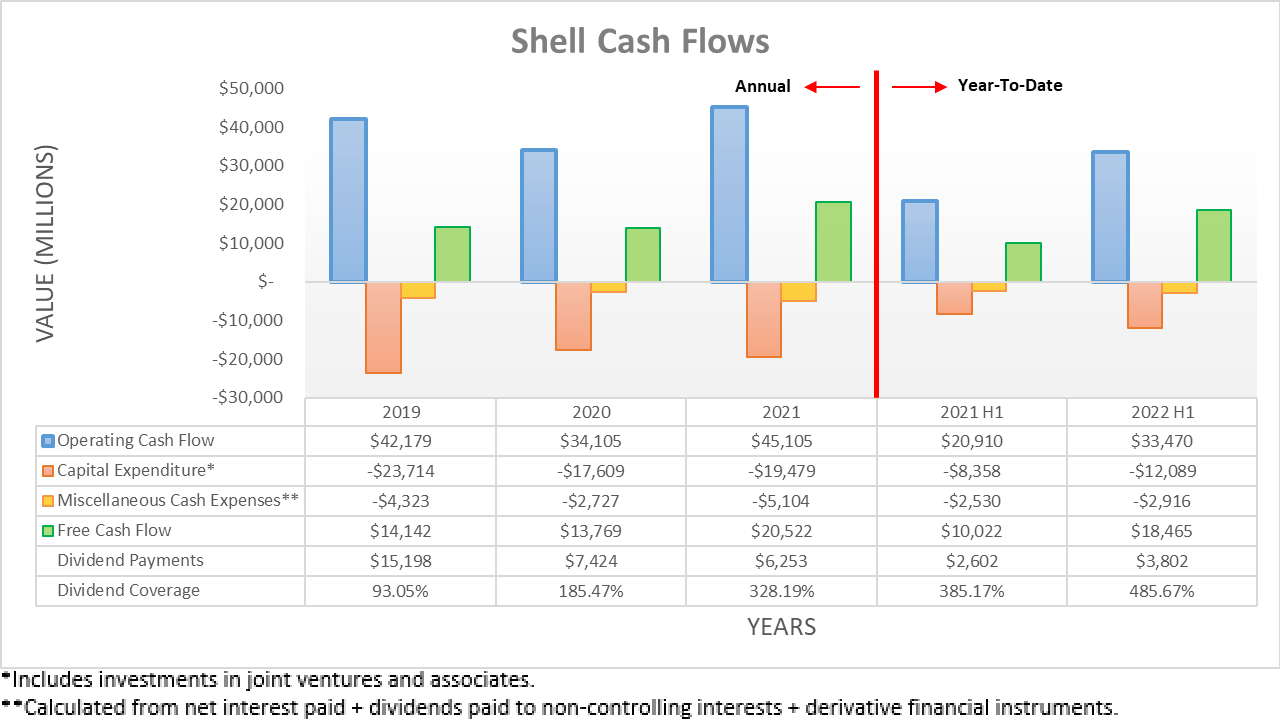
Thanks to the booming operating conditions during the first quarter of 2022 continuing during the second quarter, their operating cash flow climbed to a massive $33.47b for the first half with $18.655b being attributable to the second quarter. Even though this represents a strong increase over their previous result of $14.815b during the first quarter, it was still weighted down by a $4.243b working capital build during the second quarter. When combined with the first quarter, this sees 2022 already giving rise to a very large $11.667b working capital build during the first half.
When commodity prices increase strongly, such as during 2021 and the first half of 2022, it is not uncommon to see a working capital build as their current assets swell relatively higher versus their current liabilities due to the timing of payments. In theory, these should reverse when commodity prices stabilize or decrease with these working capital builds turning into draws that actually boost their surface-level operating cash flow.
Whilst working capital movements are common, the sheer size of their build in this situation requires particular consideration because their full-year results for 2021 already saw a comparable build of $10.366b, as per my earlier article that covered those results in detail. If this is aggregated with their recent working capital build from the first half of 2022, it equals a massive $22b of what is effectively hidden value waiting for shareholders. Very importantly, this is not simply leftover side effects of earlier years because 2019 and 2020 saw a build of $4.779b and a draw of $4.61b respectively, which are very similar in size and thus essentially net out against each other.
Even though $22b is obviously a massive sum of money, even in the eyes of the richest billionaires, if put into perspective, this amounts to slightly more than 11% of their current market capitalization of approximately $194b. It is impossible to estimate when they will see this massive cash infusion but with oil and associated refined product prices softening lately, I would not be surprised if this already started during the current quarter. Regardless if this eventuates very soon or perhaps later during 2023, it will still see a massive cash infusion to either be retained for deleveraging or more likely in my mind, sent to their shareholders given the already very healthy state of their financial position, as subsequently discussed.
Ultimately, only time will tell when and how this hidden value is deployed but thankfully they still have ample scope to fund their massive shareholder returns thanks to their amazing free cash flow generation. Despite this $11.667b working capital build, they still generated $18.465b of free cash flow during the first half of 2022 with the second quarter responsible for a massive $9.737b portion by itself. This saw management announce monster cash returns for the third quarter, as my previous article expected, which sees $6b for share buybacks on top of their current quarterly dividends. Whilst I was hoping these would see additional dividend growth or special dividends, at least they made it clear that these share buybacks should result in dividend growth per share in the future, as per the commentary from management included below.
“With the buybacks that we are doing, the actual dividend quantum is actually declining.”
“So we are building — every time we do a significant buyback, we are building a significant capacity for dividend per share increase. So the buybacks eventually will crystallize in terms of value in the DPS increase.”
-Shell Q2 2022 Conference Call.
After their meager 4% dividend increase earlier in 2022 following the first quarter and nothing following the second quarter, it was positive to see management clearly stating that share buybacks make room for dividend growth. Since they easily generate north of $8b of free cash flow per quarter during these booming operating conditions even with the hindrance of their massive working capital builds, they should have no problems funding $6b of share buybacks along with their dividend payments, which were $1.852b during the second quarter of 2022.
Unless oil and gas prices crash far below their current levels, which would be unexpected given the global energy shortage, it seems reasonable to expect comparable share buybacks again during the fourth quarter and first quarter of 2023 in the lead-up to their routine yearly dividend increase. Their $6b of share buybacks for the third quarter of 2022 stands to remove circa 3% of their shares at their current market capitalization of approximately $194b. If continued as expected, they would remove circa 10% of their shares following the first quarter of 2023, unless their share price rallies significantly higher. Since they already lowered their outstanding share count by 2.59% from 7,550,963,867 to 7,355,041,629 during the second quarter of 2022, it brings the estimated yearly total to circa 12.50% between the end of the first quarter of 2022 and the end of the first quarter of 2023.
Following their commentary that share buybacks lead to dividend growth, their shareholders should expect a solid 12%+ dividend increase following the first quarter of 2023 when they normally increase their dividends even if their $22b of hidden value remains elusive. If this massive cash infusion promptly flows through to their cash flow statement and the pockets of shareholders, this could easily climb to north of 20%.
Author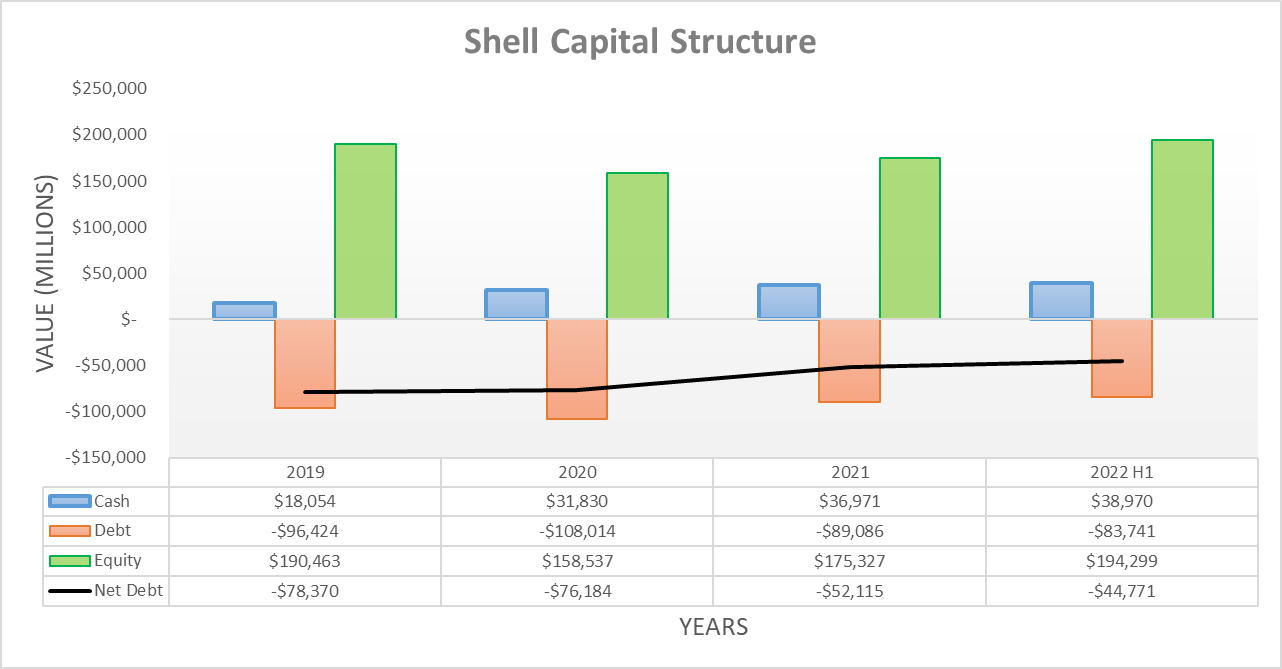
Despite returning $5.541b of share buybacks on top of $1.851b of dividend payments during the second quarter of 2022, they still managed to push their net debt down to $44.77b versus its level of $47.688b when conducting the previous analysis following the first quarter. This is now down $7.344b versus the end of 2021 and whilst already very impressive, it is amazing to consider that if not for their massive working capital builds, their net debt would have actually been dramatically lower. In fact, if their massive $22b working capital build reverses, it would eliminate around half of their net debt if retained, which highlights the immense potential of this cash infusion. Meanwhile, if adding their leases and debt-related derivatives into the mix as practiced by management, their net debt is only immaterially higher at $46.357b with their gearing ratio finally falling beneath 20% with a result of 19.30% now within the bottom half of their targeted range of 15% to 25%.
Author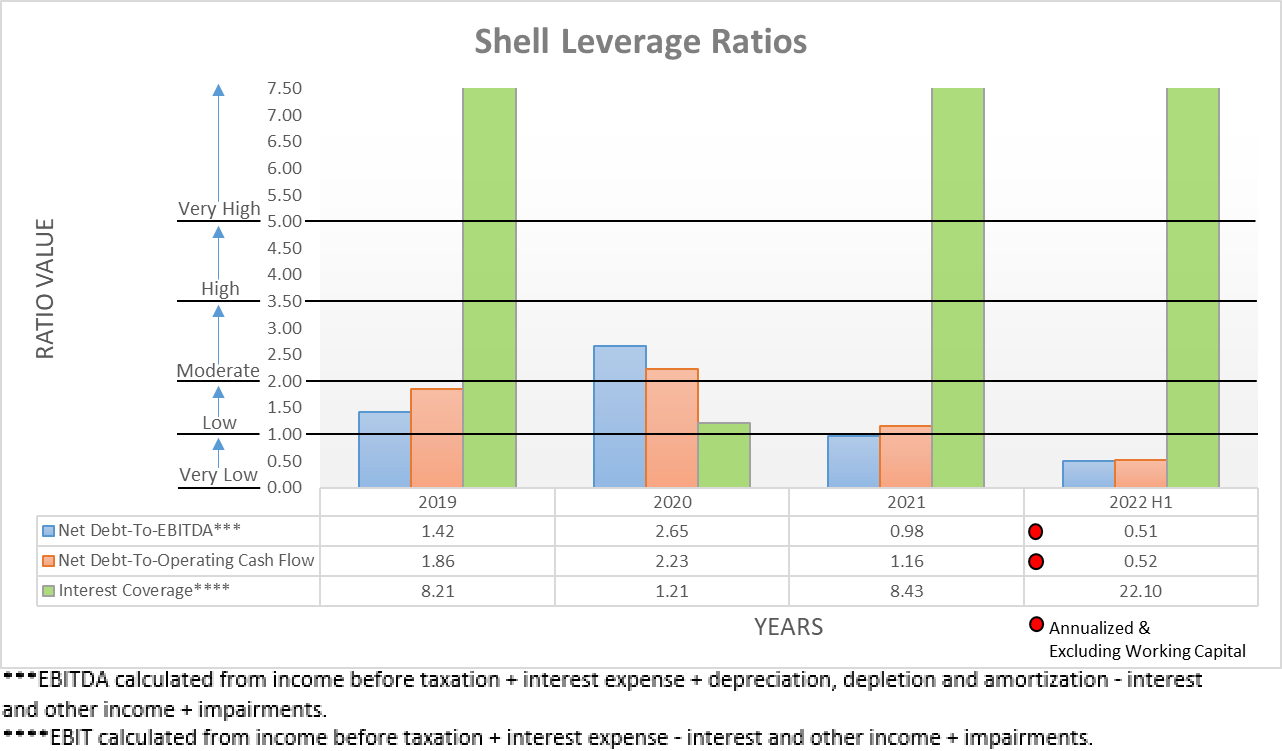
It was not necessarily required but nevertheless, their already very low leverage dropped even lower during the second quarter of 2022 on the back of their booming financial performance and lower net debt. This now sees their net debt-to-EBITDA and net debt-to-operating cash flow down to 0.51 and 0.52 respectively, which are modestly lower than when conducting the previous analysis following the first quarter that saw both results at 0.64. Whilst it remains uncertain where management will direct the cash infusion when their massive working capital build reverses into a draw, their leverage ratios should stay below the threshold of 1.00 for the very low territory unless there is an unexpected severe downturn, which significantly raises the prospects that it will be directed towards shareholder returns.
Author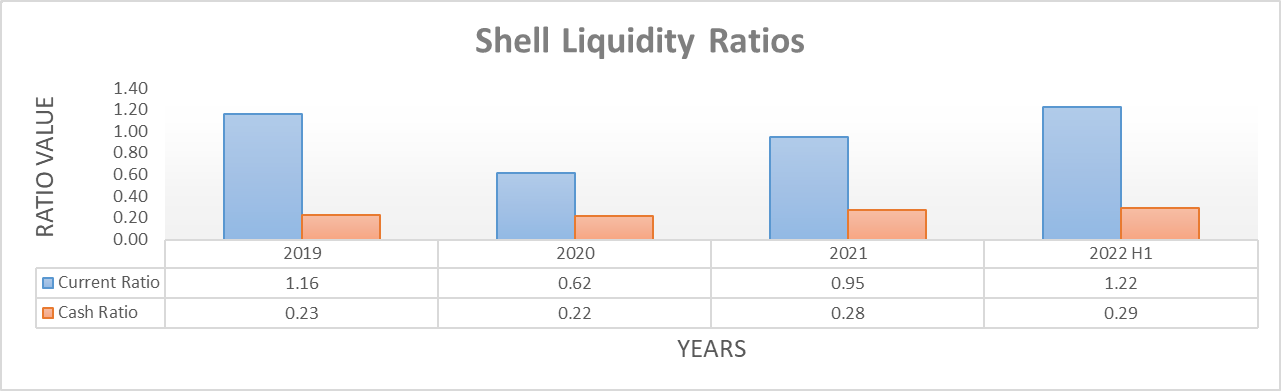
Thanks to their amazing free cash flow during the first half of 2022, their already strong liquidity easily continued with their current ratio increasing slightly to 1.22 versus its result of 1.14 when conducting the previous analysis following the first quarter, whilst their cash ratio once again landed at the same 0.29. This should continue going forwards, especially as a massive company, they should never have any issues sourcing liquidity as required to refinance debt maturities and other general purposes, even if central banks further tighten monetary policy.
Conclusion
Even though I was a little disappointed to see no additional dividend growth or special dividends, I was otherwise pleased with their financial performance and upon digging under surface, I was very pleased to find $22b of hidden value sitting idle on their balance sheet from their massive working capital builds. When combined with the supportive commentary from management that share buybacks will lead to dividend growth with my estimates placing the potential at between circa 10% to 20% by early 2023, I believe that maintaining my strong buy rating is appropriate.
Notes: Unless specified otherwise, all figures in this article were taken from Shell’s Quarterly Reports, all calculated figures were performed by the author.
Be the first to comment