Feverpitched
Camping World Holdings (NYSE:CWH) is America’s largest retailer of recreational vehicles (“RVs”) and related products and services. They operate in two reportable segments, Good Sam Services and Plans (“GSSP”) and RV and Outdoor Retail.
In total, the company did about +$6.9B in revenues for the full year ended December 31, 2021. And through the first nine months of this year, sales are up to +$5.7B and about +$7.1B over the last twelve months (“LTM”). While GSSP is a reportable segment, they represent less than 3% of total consolidated revenues.
Over the last two years, the company has benefitted from increased interest in the RV lifestyle among the general population. Greater flexibility in working arrangements has also enabled many to use their RVs for dual purposes during their travels. Favorable demand drivers in the years ahead are further tailwinds for the company.
At present, shares are down about 25% YTD and are currently trading at 5.6x forward earnings, with a dividend yield in excess of 9%. For income investors, the high yielding payout is reason itself for at least an addition to the watchlist. In addition to the dividend, however, the stock also presents attractive upside potential of at least 15%. Though recent earnings results were mixed, the outlook still remains favorable enough for the company to capture the upside embedded in its share price.
Total Unit Sales Just Under Record Totals From Last Year
For the quarter ended September 30, 2022, CWH reported total top line revenues of +$1.9B. While this was down 3.2% YOY, it still beat expectations by +$100M. Driving the YOY decline was weakness in sales of new vehicles, which were down 6% on a unit basis on average selling prices per vehicle that were up 2.7%.
Q3FY22 Form 10-Q – Comparative Revenue Disaggregation By Segment
This was partially offset by a 1.2% YOY increase in used vehicle sales, led by volume growth of 6.1%. Given the increased cost of new vehicles, one should expect to see greater demand for their pre-owned lot. An additional factor driving used volume growth, however, was a 4.6% decrease in average selling prices per vehicle, perhaps due to higher inventory levels. Over the LTM, for example, it took about 6 more days to sell inventory as compared to the twelve months ended December 31, 2021.
Q3FY22 Form 10-Q – Summary Of New/Used Vehicle Sales During The Period
Overall, CWH sold a total of 32K units during the quarter, with a 55% and 45% split between new and used vehicles, respectively. This level of volume is just under the record sales they did last year. And in fact, used volumes did set a record during the quarter.
Used Sales Provides An Extended Growth Opportunity
At its current run rate, the company is expected to do about +2.0B in used sales. This would be a notable achievement considering some of the headwinds being experienced on the new lot. As a goal, management is striving to achieve +$3.0B annually in used sales. At the current momentum, this certainly is a possibility.
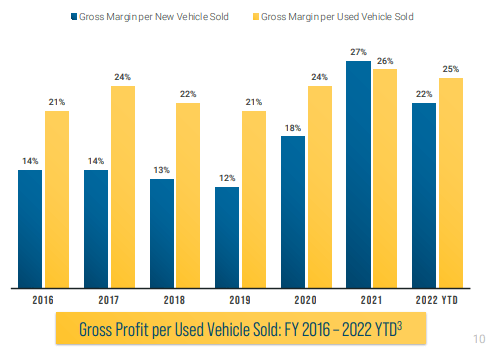
Achieving that rate of sales would also likely bring up the sales mix to a 50/50 ratio, which should be favorable to earnings, as it is currently generating higher gross margins. In the current period, for example, margins on used sales were 24.2% versus 19.1% on new. This is a significant flip from last year, where new vehicle sales were generating margins of 29.1% versus margins on used of 27.5%.
September 2022 Investor Presentation – Historical Gross Margins On Used Vehicle Sales
In addition to higher margins, increased used vehicle sales would also benefit their other business units that are focused on parts and service. While that hasn’t trickled through yet, considering product and service revenues were down nearly 12% on a same-store basis during the quarter, it is likely to materialize in forthcoming periods.
A Return To More Normal Operating Performance Is Expected
Looking ahead, management does expect their business to return to historical seasonal patterns. As it relates to the fourth quarter, that would result in an expected decline in total revenues of about one third, with EBITDA margins in the low to mid-single-digit range.
Management is also standing by their previous projections of same-stores being down about 15-18%, despite their continued outperformance in that regard. Some of this is simply managing expectations that have arisen from previous growth rates obtained in 2020 and 2021. It is also a genuine belief that the business will experience a normal seasonal fourth quarter compression.
A 9% Yielding Dividend Payout That Appears Safe
CWH currently pays a quarterly dividend of $0.625/share, which represents an annualized yield of over 9% at current pricing. This is a highly attractive payout, especially for income-focused investors. But is it safe?
The payout has increased substantially over the past two years, riding on the company’s fortuitous revenue growth. Growth, however, is exhibiting signs of slowing. At the same time, overall margins are getting squeezed on rising costs.
Still, the company is generating positive cash from operations and has been every year since 2018. Increased inventory purchases are driving down working capital, but the company has not experienced any excess buildup of unsold units, as evidenced by their lack of promotional activity.
Furthermore, their consistent turnover ratio, albeit slightly higher, of 2.9x over the LTM indicates the company is adequately managing their inventory. This is important since their inventory balance accounts for over 80% of their total current assets and 50% of their total asset balance. As such, any significant setback in turning inventory would likely create a near-medium term liquidity event.
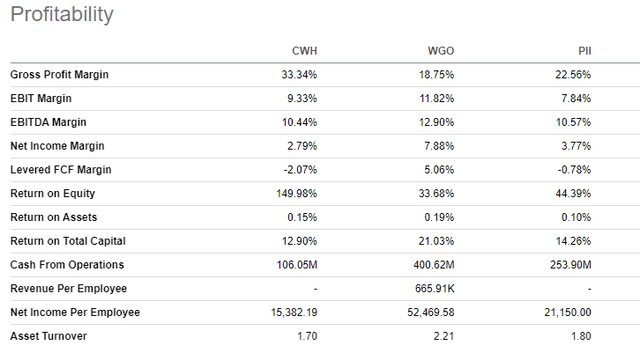
Compared to several of their peers in the discretionary recreational sector, such as Polaris (PII) and Winnebago (WGO), CWH does have a more levered balance sheet with weaker overall margins. CWH’s LTM net debt to EBTIDA, for example was 3.7x versus 2.2x and 0.9x for PII and WGO, respectively. Additionally, LTM net income margins of 2.79% are well below that reported by PII and WGO.
Seeking Alpha – Profitability Metrics Of CWH Compared To Peers
These weaknesses, however, are offset by strong gross profit margins. While margins are down about 240bps from December 31, 2021, they are still high by historical standards. At the end of 2019, for example, margins were at 27.2%.
Margin preservation that enables continued earnings growth and continued positive cash flows should provide the necessary support to the current dividend payout. In the current period, diluted EPS came in at $0.97/share. The current period payout ratio would thus be about 64%. On a LTM basis, it would be about 54%. So, while the ratio has increased, it still remains well-covered. For a 9% yielding payout, it does appear safe at present. Significant deterioration in their outlook can challenge this, but management, nevertheless, appears committed in maintaining the dividend for the foreseeable future.
Camping World Holdings Can Take The Portfolio To New Heights
CWH is America’s largest RV retailer with sales and service locations in 42 states. Its size and brand recognition among the growing community of RV users are two competitive strengths that have allowed them to capitalize on significant demand growth over the past two years.
Presently, there are 11M households in the U.S. that own an RV. This is up over 60% from ownership levels in the early 2000s. Furthermore, according to a study conducted by Go RVing, 9.6M households intend to buy an RV within the next five years. Even more, 84% of Millennials and Gen Zers plan to buy another RV in the next five years, with 78% preferring to buy a new model. With 22% of current owners between 18-34 years old, this presents an extended runway for growth
From a usage standpoint, current owners are using their RVs for a median 20 days per year. But more recent buyers have stated that they intend on using their vehicles for about 25 days, due in part to greater flexibility in working arrangements that permit employees to work in locations of their choosing.
Greater usage and the rising popularity of the lifestyle among younger generations is a favorable growth driver to not only CWH’s future sales of RVs but to their revenues generated in their products and services division, which should increase along with greater usage, particularly on older models.
Moving forward, used sales figure to be a greater mix of total unit sales, given higher average selling prices on new models. Based on their most recently reported figures, buying a used model was 23% cheaper than opting for a new model. This is compared to last year, where it was only 17% cheaper.
The current period numbers reflected this greater price differential. While new sales were down during the period, record unit sales of their used models helped blunt the weakness. Additionally, margins are currently higher on used vehicles, at 24.2%. Moreover, this will also feed into their GSSP segment, as margins there are currently 62.5%. This should support earnings in later periods.
The outperformance in used sales was one notable highlight in an otherwise mixed quarter that included significant declines in net income and adjusted EBITDA on rising expenses. An expected return to more historical seasonal patterns is also likely to add pressure in the near-medium term. The company, however, still has a positive long-term outlook with favorable demand drivers. And shares are currently trading at a reasonable multiple of 5.8x forward EPS. This is down from upper-single digit multiples commanded in prior years.
Using a 5-YR discounted cash flow model with a CAPM-derived cost of equity of 16% based on its 5-YR beta of 2.6, an estimated expected risk premium of 5.5%, and a projected compound revenue growth rate of 8%, an implied share price of $35 is derived. This would indicate upside potential of over 15%, excluding the high yielding dividend payout. For most investors, this would be more than enough to cover current hurdle rates.


Be the first to comment