

Sundry Photography/iStock Editorial via Getty Images
Price Action Thesis
We are following up with a detailed price action analysis on ServiceNow (NYSE:NOW) stock after our previous article in April. There have been several noteworthy developments in its price action that we think investors should consider.
Notably, a bear trap (significant rejection of selling momentum) formed in May, but the price action was resolved by another bull trap (significant rejection of buying momentum) in June. NOW is also firmly embedded in a bearish bias, and its medium-term trend has started to move into a downtrend. Therefore, we accord higher precedence to its bull trap in June and urge caution.
Notwithstanding, we expect a firm re-test of its near-term support ($405), which coincides with its critical 200-week moving average support. If NOW were to lose that support level, we could see a steeper down move since its recovery momentum was rejected in June. Therefore, we urge investors to be patient and wait for the re-test first.
Also, our valuation model indicates that adding at the current levels could disappoint investors expecting to repeat NOW’s 5Y total return CAGR outperformance against the market. Therefore, we suggest the level investors should consider adding to help achieve a market-perform hurdle rate.
As such, we reiterate our Hold rating on NOW stock.
NOW – June’s Bull Trap Rejected Further Buying Upside
NOW price chart (TradingView)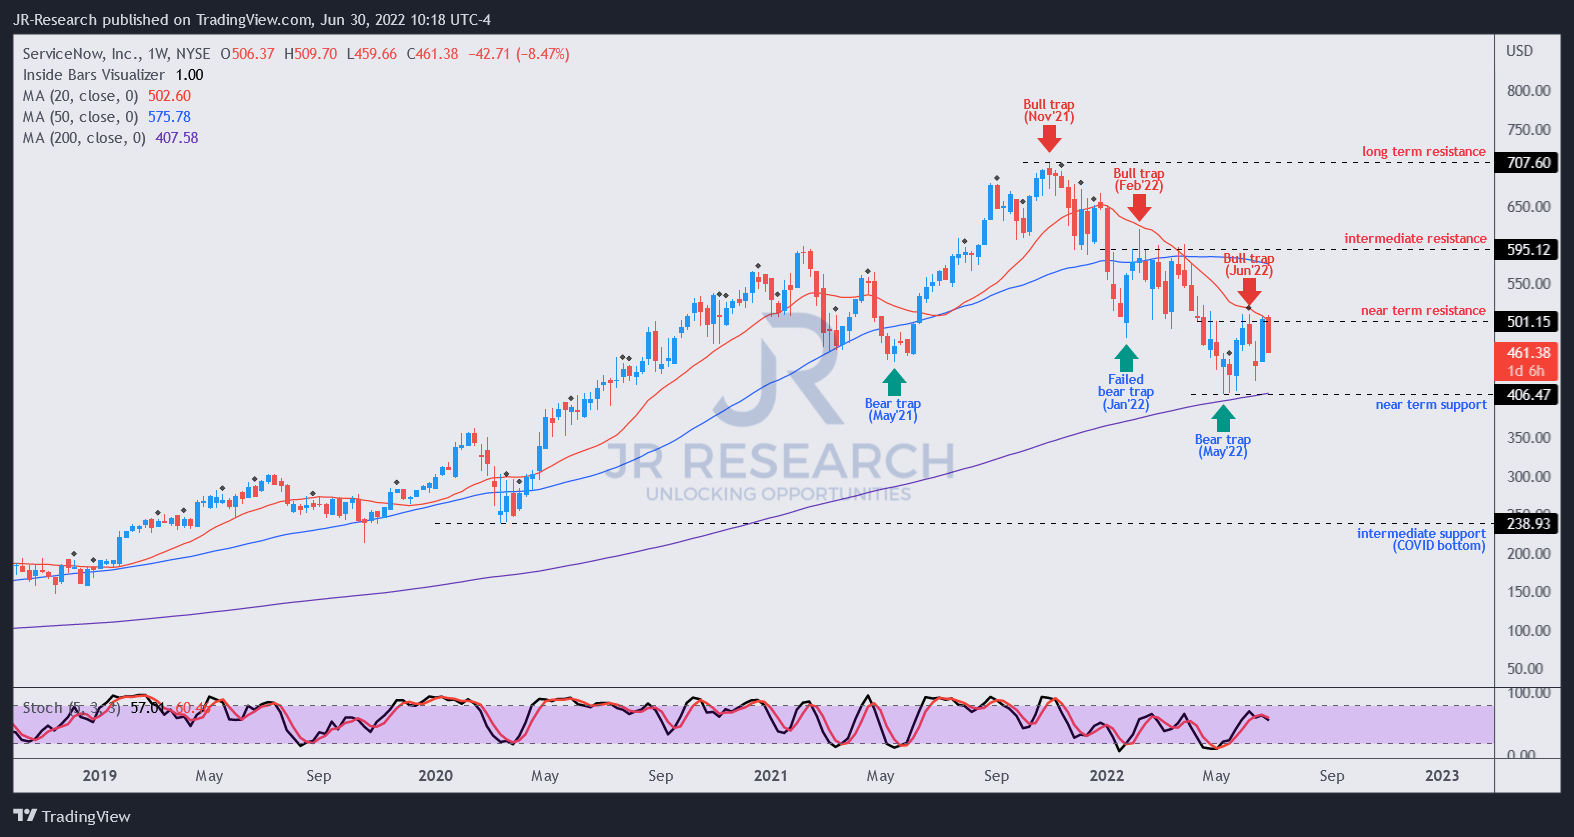
A closer inspection of NOW’s weekly chart helps unveil significant clues to its price action. Notably, NOW has moved firmly into a bearish flow, as the series of bull traps have rejected its attempt to retake its bullish bias.
May’s bear trap was instrumental in helping form its near-term support ($405). However, it was quickly resolved by another lower-high bull trap in June that created its near-term resistance ($500).
Consequently, a series of lower-high bull traps is not constructive for NOW’s price action, as it corroborated the market’s intentions to continue its bearish bias. Furthermore, if NOW cannot retake its near-term resistance, it could soon move into a strong downtrend, potentially leading to steeper declines ahead.
We observed that NOW formed its May bear trap close to its 200-week moving average support (purple line), likely its “last line of defense” for its uptrend. As such, we urge investors to avoid pulling the trigger and first watch for the potential re-test of its near-term support.
ServiceNow’s Growth Is Insufficient To Justify Its Valuation
ServiceNow revenue change % and adjusted EBIT change % consensus estimates (S&P Cap IQ)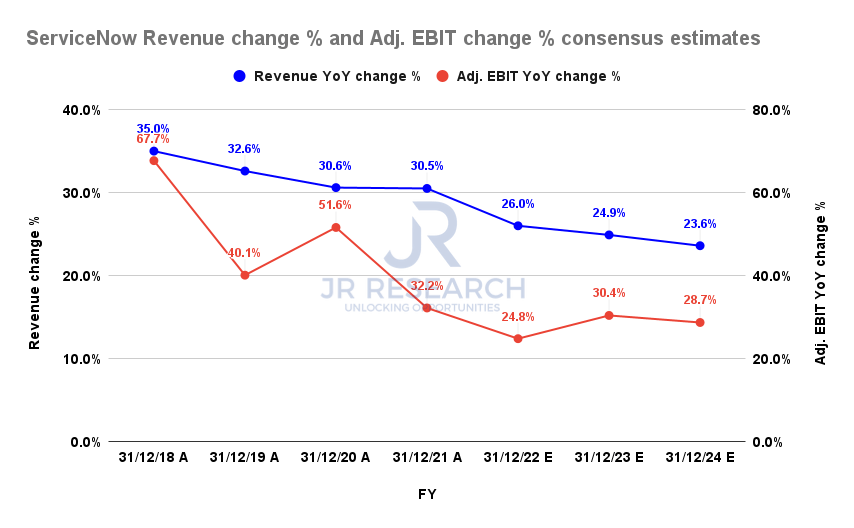
ServiceNow has delivered rapid revenue growth over the past five years, posting a 5Y revenue CAGR of 33.5%, well above many of its leading software peers.
However, investors are urged to look forward as the company’s growth rates are expected to moderate. For instance, the consensus estimates indicate that ServiceNow’s revenue growth is projected to moderate to 26% in FY22 before falling to 23.6% in FY24. Notably, its adjusted EBIT growth is expected to slow down from its pre-COVID metrics.
ServiceNow FCF margins % and adjusted EBIT margins % consensus estimates (S&P Cap IQ)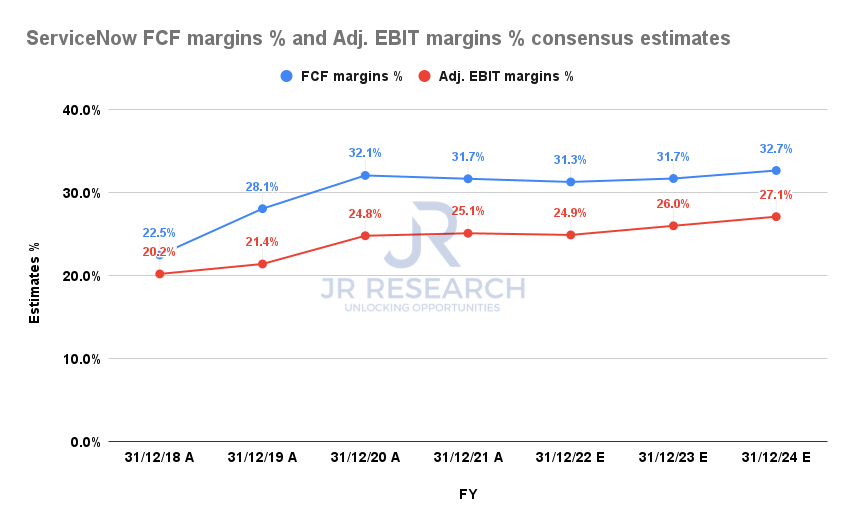
Notwithstanding, ServiceNow has a very high free cash flow (FCF) generative business model. As a result, it has helped the company deliver robust FCF margins over the years.
However, the operating leverage gains are also estimated to slow down, as seen above. We believe it’s consistent with markedly slowing topline growth. Investors should not expect ServiceNow to “squeeze” even more operating efficiencies while managing a moderation in revenue growth. Therefore, we believe the consensus estimates are appropriate.
Also, given ServiceNow’s aggressive growth metrics, it could be susceptible to a reduction in corporate IT spending if the macro environment deteriorates further. As such, we believe that it could impact its growth.
| Stock |
NOW |
| Current market cap | $92.29B |
| Hurdle rate (CAGR) | 10% |
| Projection through | CQ4’26 |
| Required FCF yield in CQ4’26 | 5.5% |
| Assumed TTM FCF margin in CQ4’26 | 32% |
| Implied TTM revenue by CQ4’26 | $24.36B |
NOW reverse cash flow valuation model. Data source: S&P Cap IQ, author
NOW last traded at an FCF yield of 2.47%, higher than its 5Y mean of 2.16%. But, note that ServiceNow delivered rapid growth in revenue and profitability over the past five years. Therefore, with slowing growth rates, we posit that the market will likely ask for markedly higher yields through FY24.
We applied a market-underperform hurdle rate of 10%. It’s a significant downgrade from NOW’s 5Y total return CAGR of 35.19%. Therefore, we believe raising its FCF yield to at least 5.5% is appropriate.
As a result, our model suggests that ServiceNow needs to post a TTM revenue of $24.36B by CQ4’26. However, the revised consensus estimates indicate it could deliver revenue of $11.47B in FY24. Therefore, we are not convinced that ServiceNow could meet our revenue target at its current valuation.
Hence, we urge investors to consider waiting for a deeper retracement to help them potentially achieve a market-perform hurdle rate of 15%. Accordingly, we revised our entry level to $310 (found in the gap between its near-term and intermediate support). We kept the other parameters unchanged. Accordingly, we require ServiceNow to post a TTM revenue of $16.39B by CQ4’26, which we think is achievable.
Is NOW Stock A Buy, Sell, Or Hold?
We reiterate our Hold rating on NOW.
Our price action analysis suggests caution is warranted, as NOW was rejected at its near-term resistance again. Coupled with its bearish flow and a potential downtrend development, its price action for dip buying is not constructive.
Our valuation model indicates that investors will likely underperform the market if they add at the current levels. Instead, they should consider layering in at below $310 to help them attain a market-perform hurdle rate of 15%.
Be the first to comment