

Ultima_Gaina
Introduction
August 26th and September 13th marked the start of the 4th strongest negative signal for 2022, and conditions continue highly negative through today. This article builds on prior signal event articles with more explanations on how to benefit from one of the most popular features of the Value & Momentum Breakouts marketplace service. As more data points are collected, more insights are gained.
This article serves to answer key questions about the current negative signal and prepare readers for the potential of more downside risk in the short term.
Examining The Charts And Signals Of The Current Decline
Validating factors from the November 17th topping signal has shown a new market breakdown as the Fed continues to hike interest rates and increase Quantitative Tightening. This critical factor is discussed in more detail in my QT articles comparing 2022 with the detailed patterns of 2018:
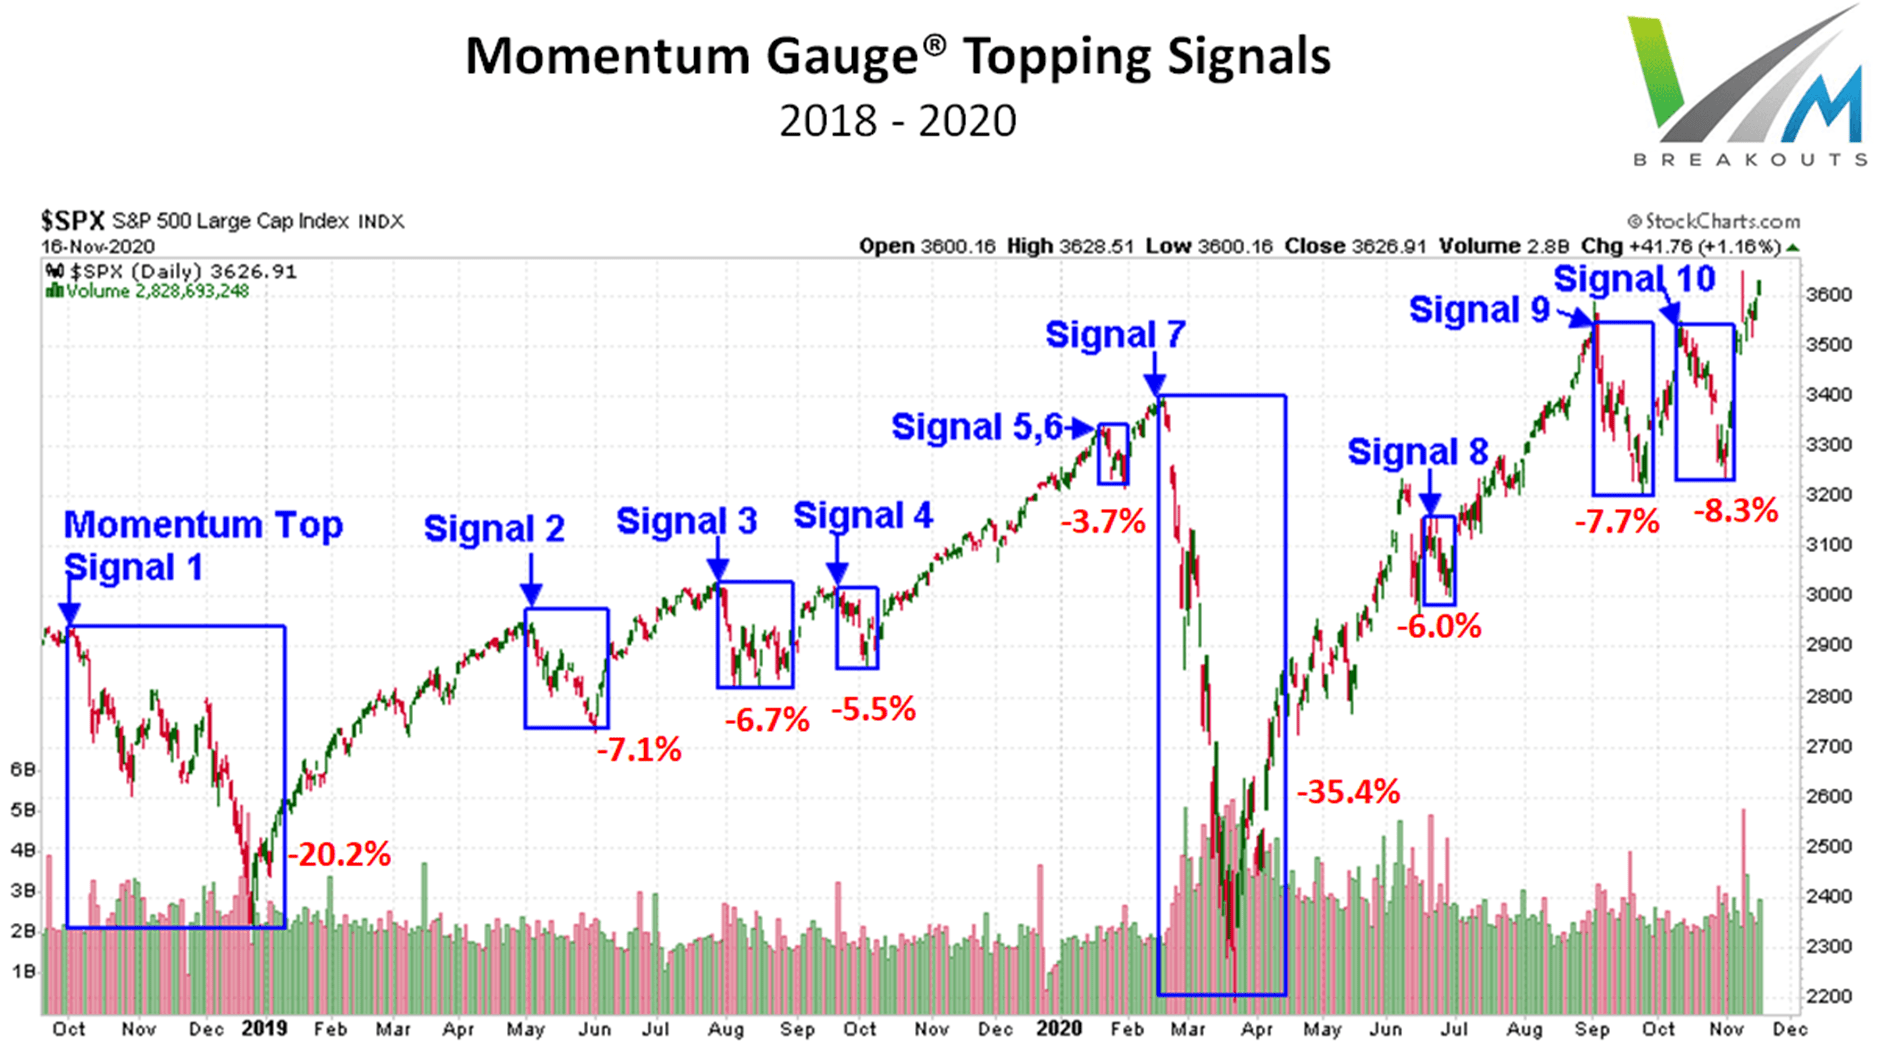
Prior signals on the S&P 500 index fund (SPY) from 2021 are illustrated below, and the market has been in strong negative technical channels this year since near the January 13th negative signal. Now that we have shifted into a QT market, the daily volatility has become much larger than the prior QE bullish markets. These charts closely resemble the high volatility charts of 2018, the last time the Fed started reducing their balance sheet and tightening market liquidity.
FinViz.com VMBreakouts.com 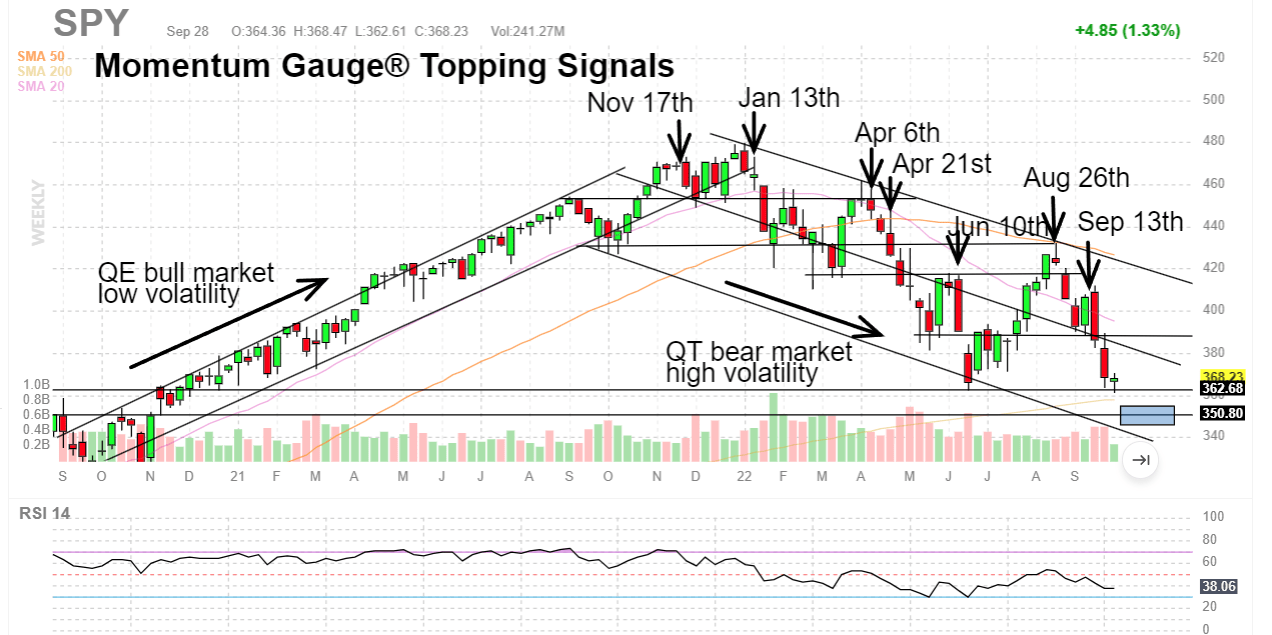
Chart back from January 2022 as the Negative Momentum Gauge signal anticipated the first major breakdown for the year on January 13th. Detailed gauge charts below with the most current values.
FinViz.com VMBreakouts.com 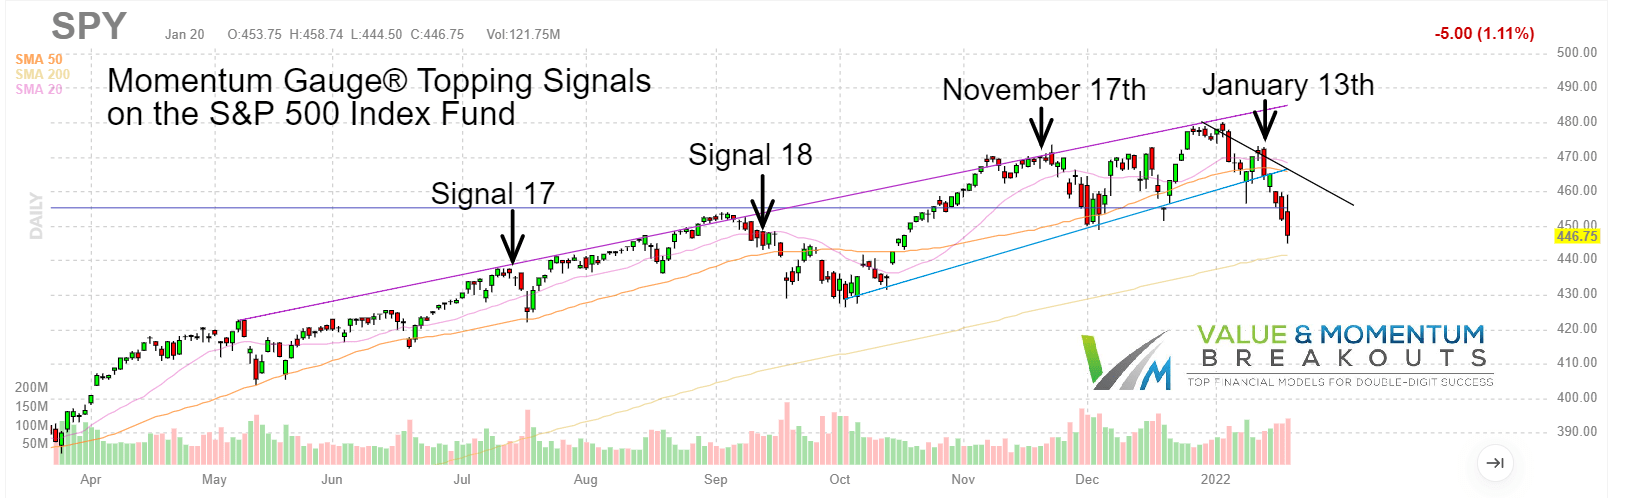
Reviewing the September Momentum Gauge signals
1. The Daily Momentum Gauges turned negative on Sep 13th to the current lows at peak values and we are now looking for confirmation of another bear rally in the negative channel from November.
app.VMBreakouts.com 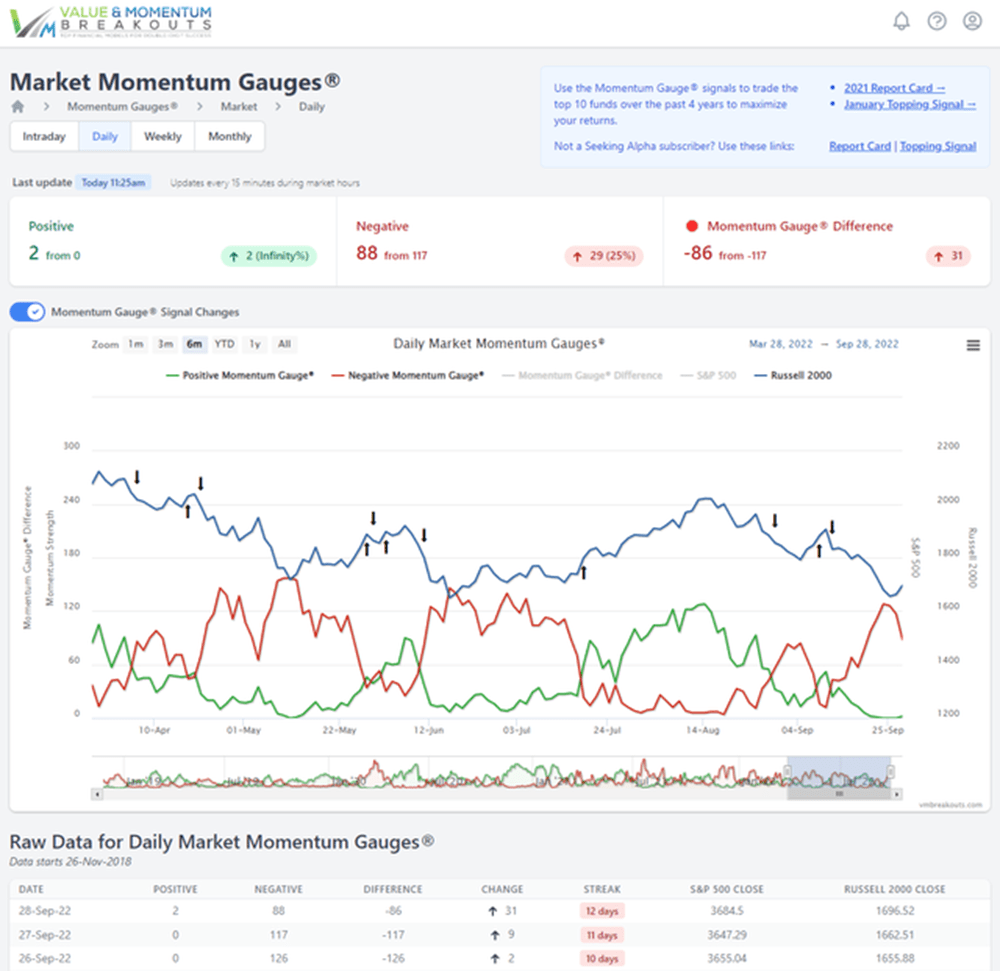
2. The Weekly Momentum Gauges have been negative 34 of the last 45 weeks since the November signal. The peak negative values in each of the declines has ranged from 148 to 187 not including the Covid-19 correction when the weekly negative momentum reached 229. Currently, the positive values are the lowest since May when we experienced a bear bounce before moving lower again to June lows.
app.VMBreakouts.com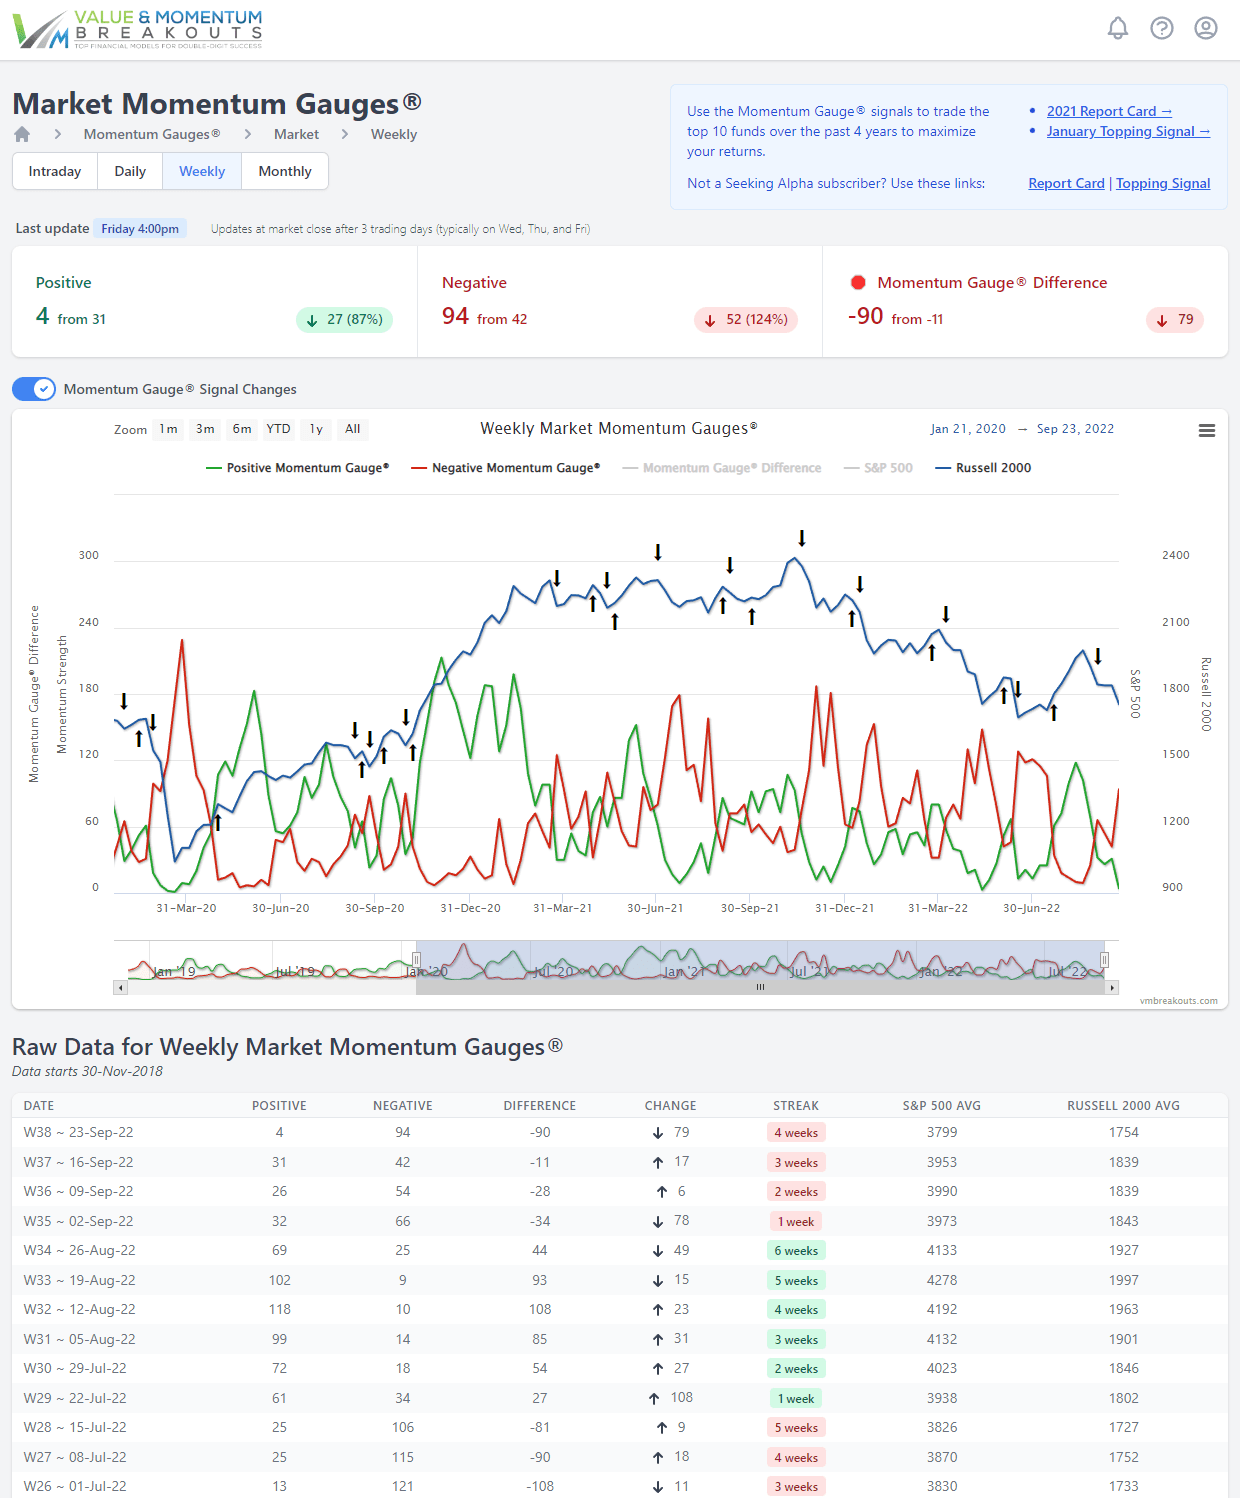
3. The Monthly Market Momentum Gauges have been negative 10 of the past 11 months since November, and the values are rising again through September. I expect this to continue for as long as the Federal Reserve continues with the most aggressive Quantitative Tightening program in U.S. History per the articles linked above.
app.VMBreakouts.com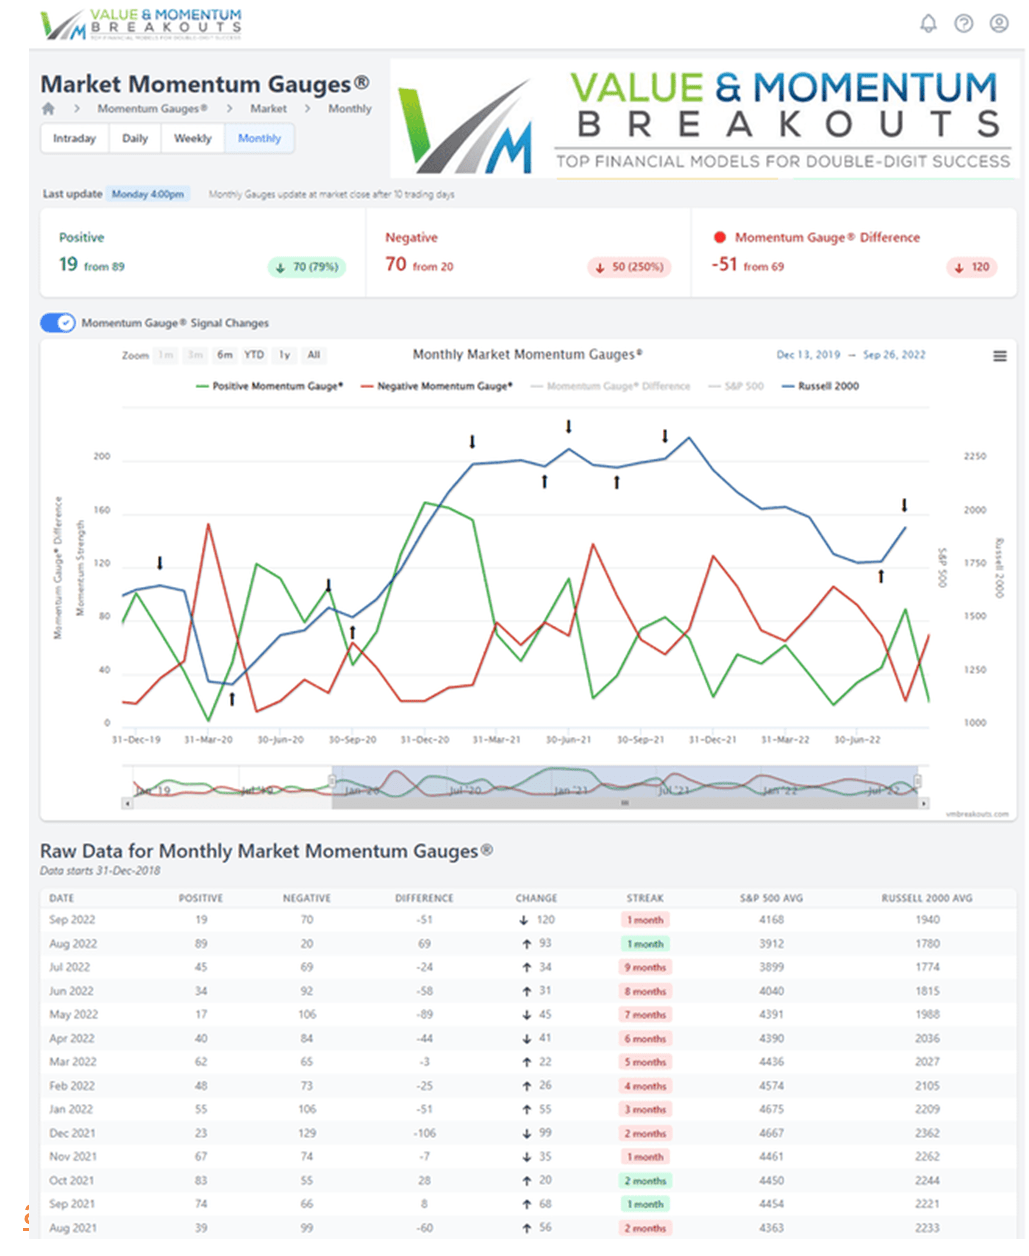
4. Additional confirmation from the S&P 500 Momentum Gauges confirmed a negative market signal also on Sep 13th. Of particular significance is how low the positive momentum values have become, even registering a zero value on September 23rd for the first time since June 16th and the first time since the COVID Correction.
app.VMBreakouts.com 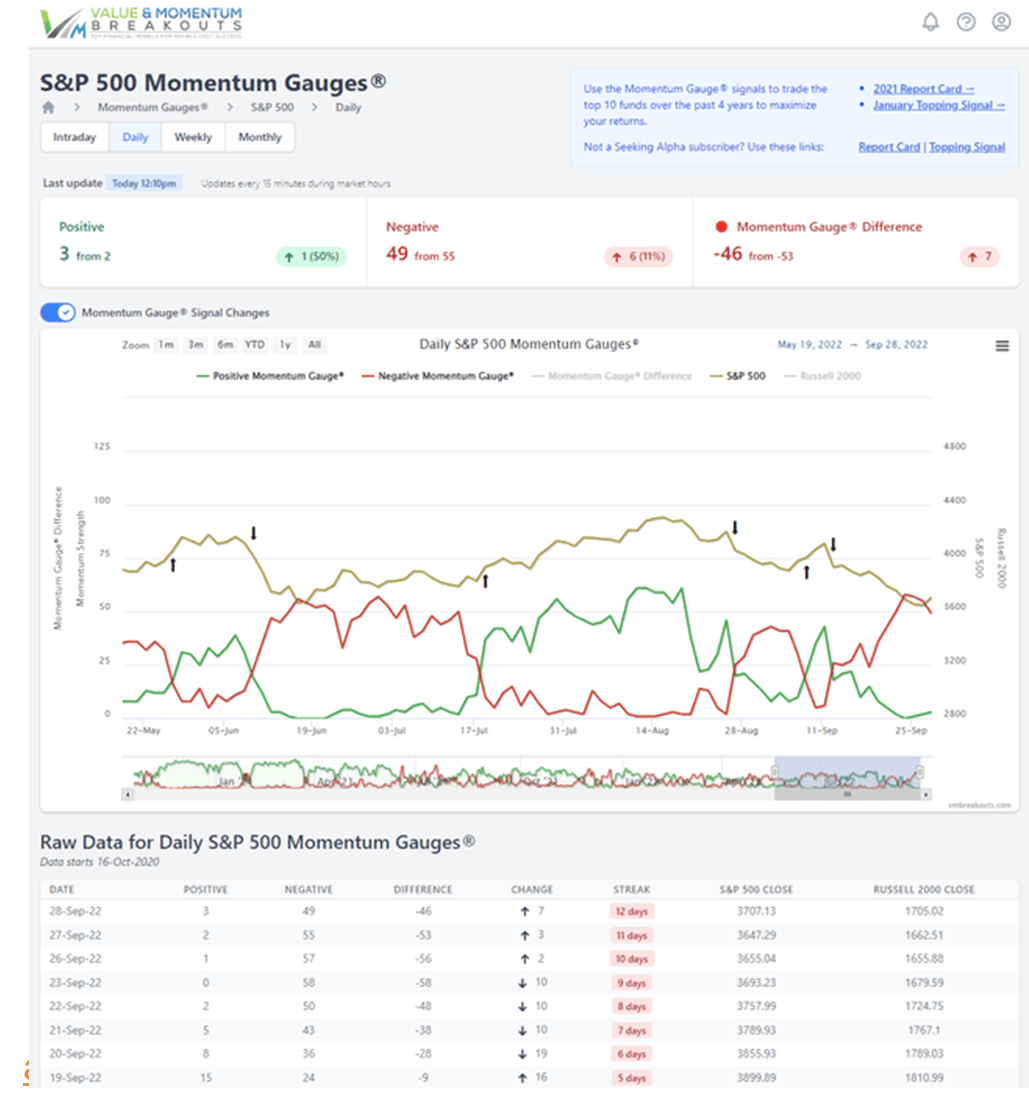
5. The Sector Momentum Gauges measuring 11 sector conditions have all been negative descending down to maximum lows for many sectors. Technology has been negative the longest from August. Typically these max low levels do not last more than a few days for short term bounces.
VMBreakouts.com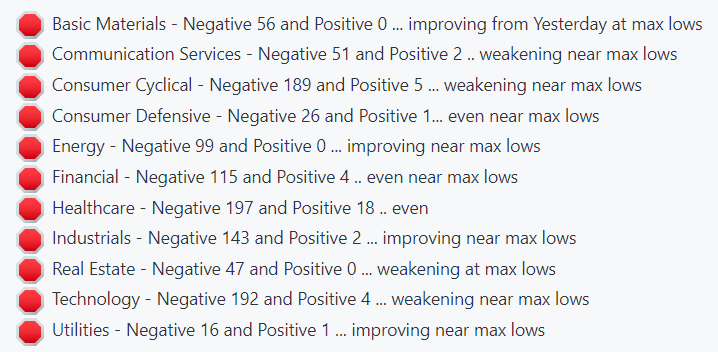
Current Results Of The September Signal
1. The actively traded Premium Portfolio moved to cash again on September 13th, avoiding significant declines in the portfolio while outperforming the S&P 500 by +12.16% to date. The signals can be applied to other long term portfolios for downside protection.
2. ETF Bull/Bear combination signal changed to bear funds on Sep 13th and the last major negative signal was June 10th with the following bear fund returns from the signal.
VMBreakouts.com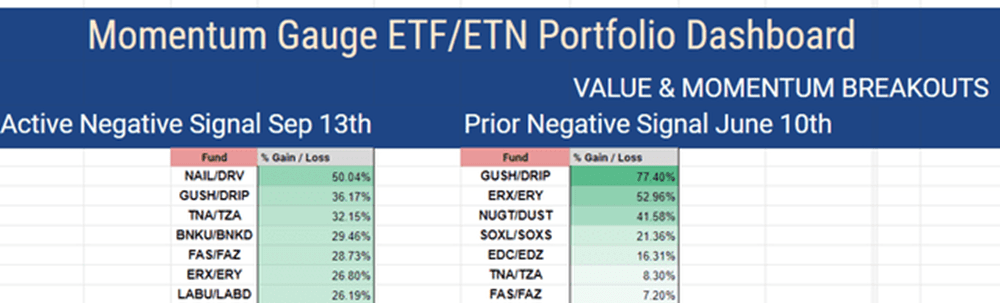
3. The active ETF Portfolio current holdings up +22.94% YTD beating the S&P 500 by +46.42% YTD. Currently riding the bounce as we look for more confirmation that another short term bottom is underway with another leg lower to go as the market tests new lows through 2022.
VMBreakouts.com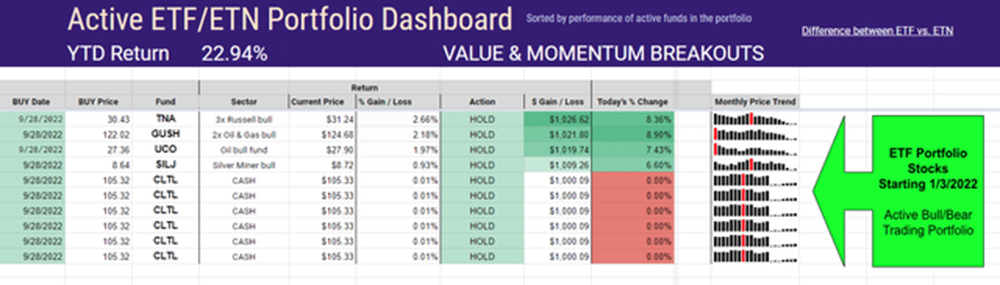
Review Of Current Market Indicators
I always recommend using validating indicators to support the Momentum Gauge signals and better understand the magnitude of the signals. Sometimes indicators are only driven by certain sectors and not a broad or stronger signal that is important to know. These are some additional charts that benefit our analysis of the market signals and guide where the major indices are likely headed.
I continue to maintain a 350/share SPY target back into the positive channel from 2009 and the start of the massive Quantitative Easing programs shown below in this June chart:
FinViz.com VMBreakouts.com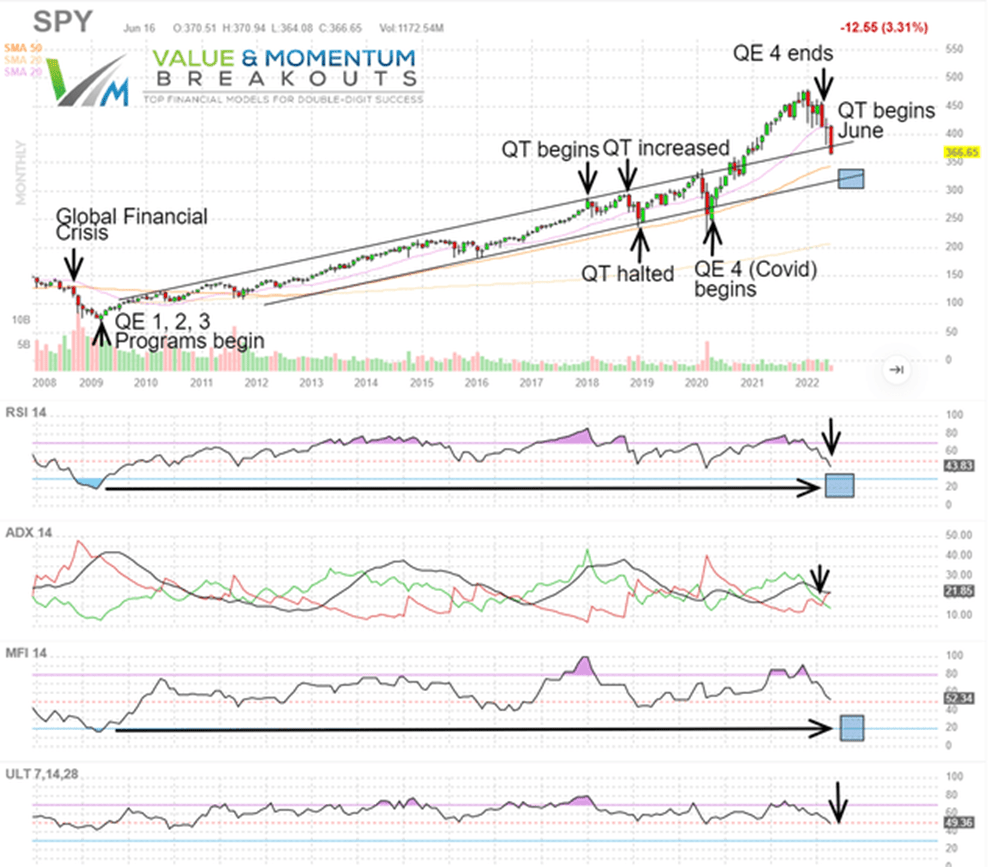
Nasdaq 100 index fund (QQQ) in the negative channel from August and September signals testing new 2022 lows around 270/share.
FinViz.com VMBreakouts.com 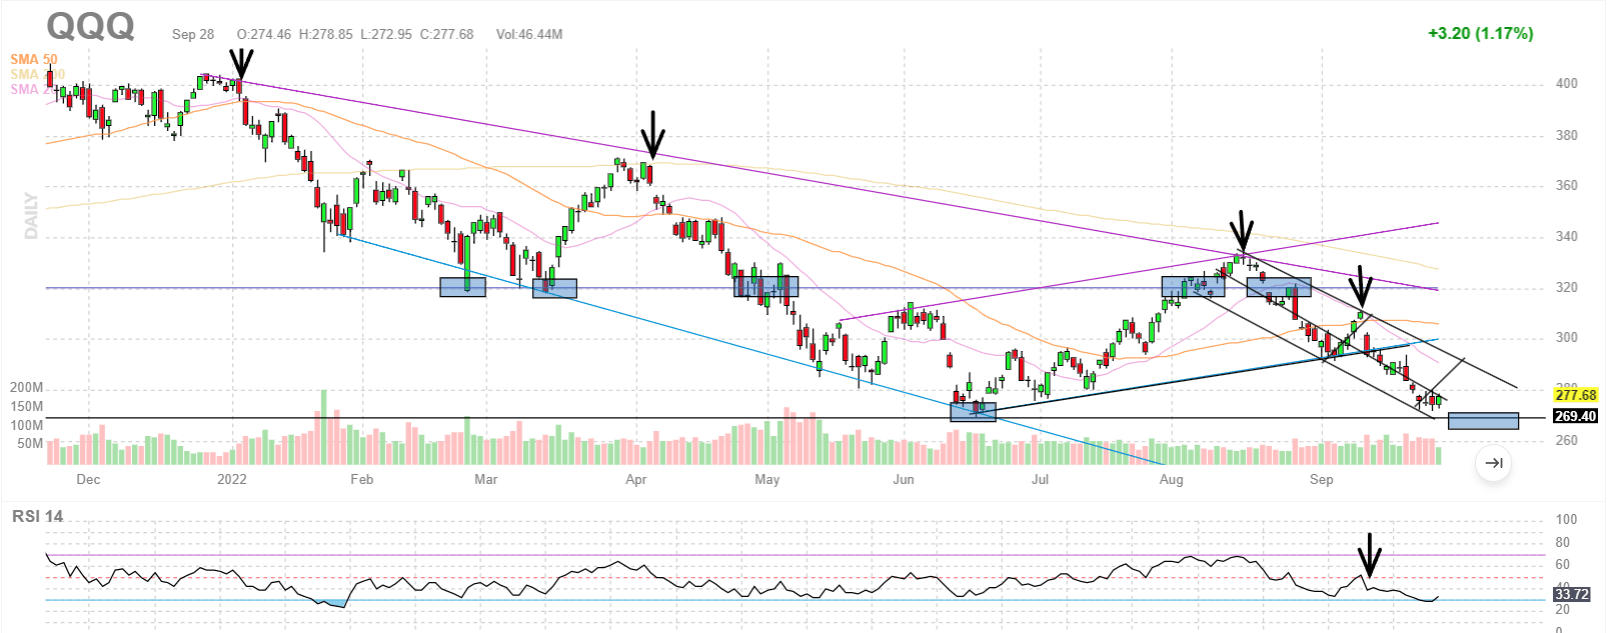
ProShares UltraPro Short QQQ (SQQQ) with very strong similarities to the April breakout and Momentum Gauge signal in bullish stair steps toward prior highs around 62/share and 67/share.
FinViz.com VMBreakouts.com 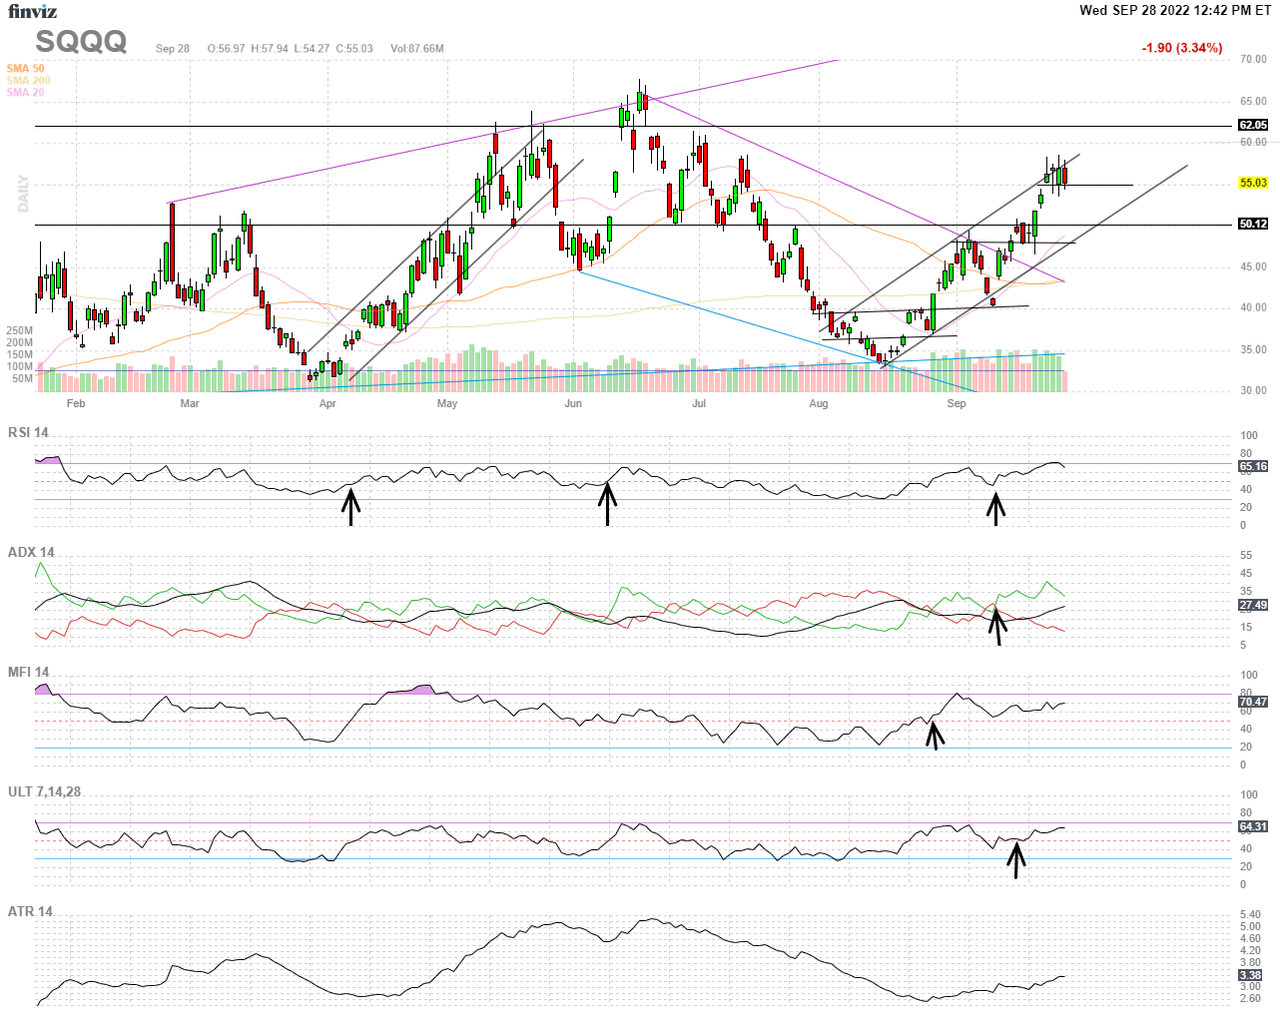
Direxion Daily Utilities Bull 3X Shares (UTSL) with remarkably strong correlation with the Momentum Gauges. Heading in breakdown conditions toward June lows with more room to go.
FinViz.com VMBreakouts.com 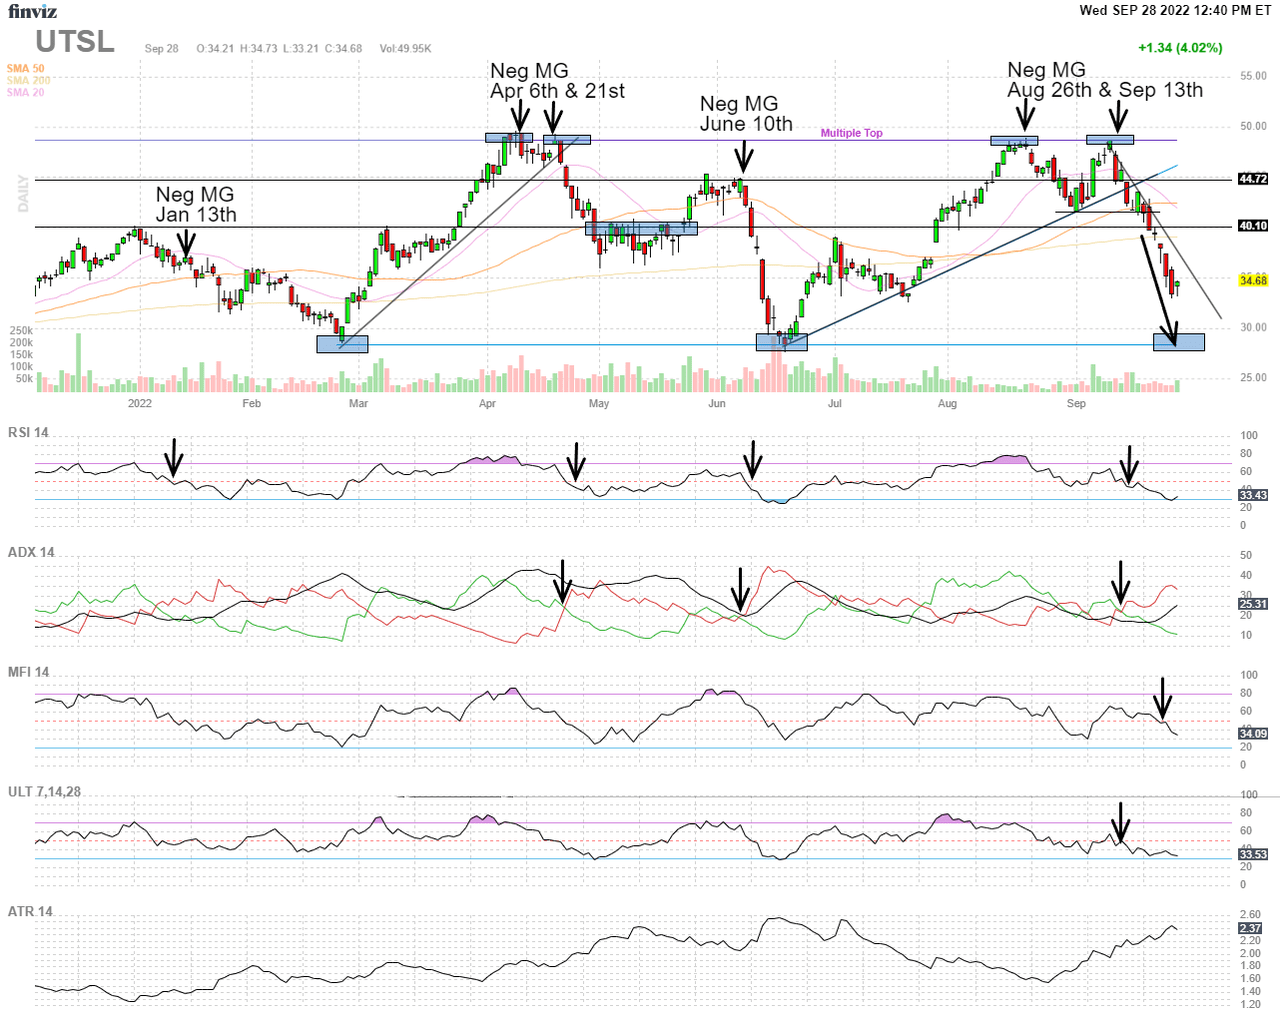
Direxion Daily 20+ Year Treasury Bear 3X Shares (TMV) breakout for 2022 has been very bearish for equity markets. As yields go higher money is leaving the markets to obtain higher yields from treasuries that are now above 4% compared to average dividend yields of the S&P 500 around 1.6%. This is a very strong validating indicator.
FinViz.com VMBreakouts.com 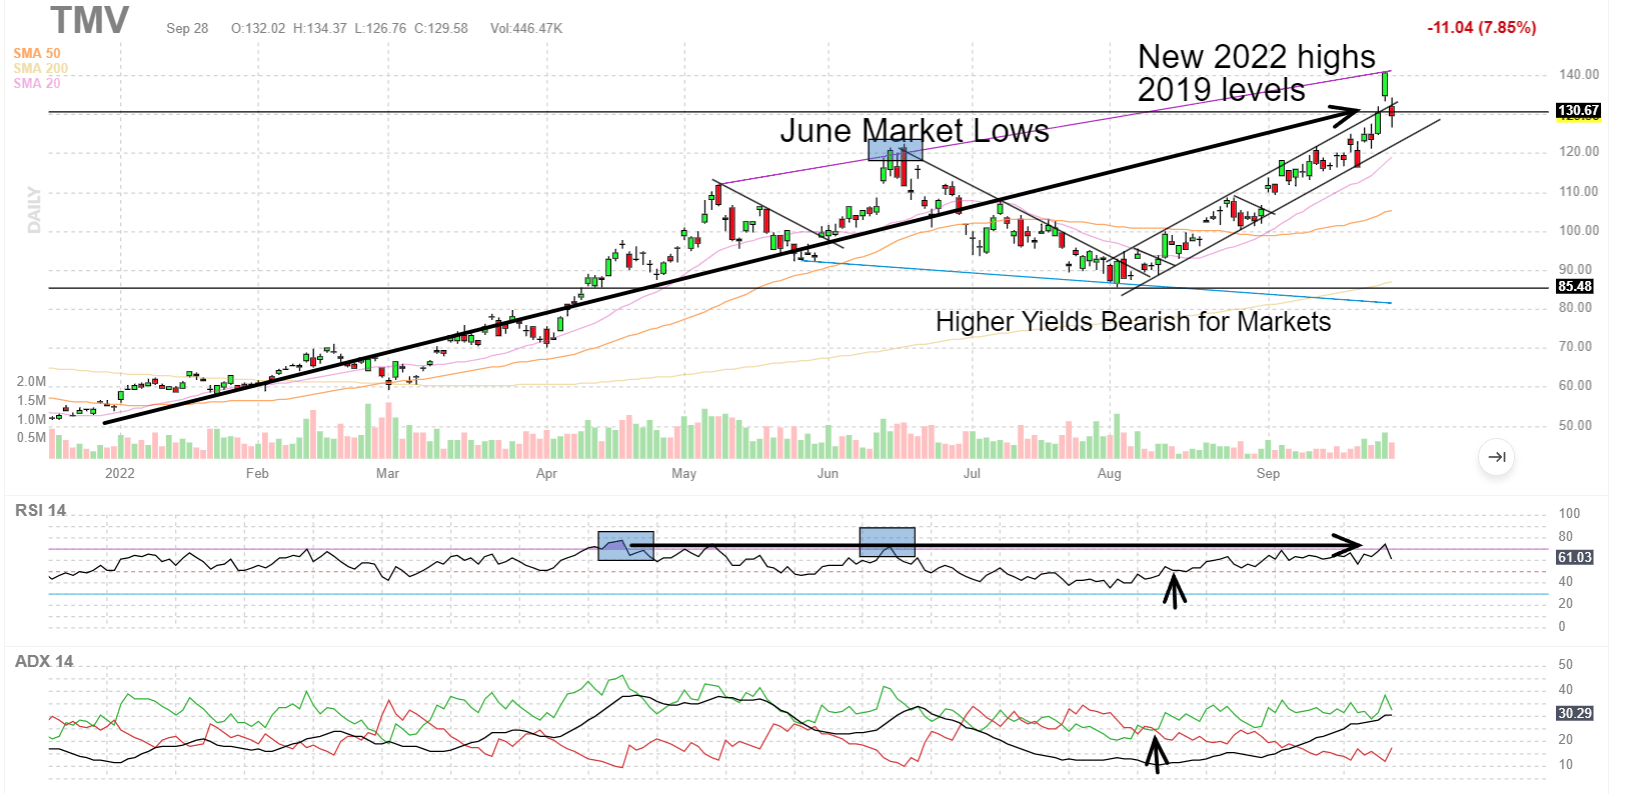
Invesco DB US Dollar Index Bullish Fund (UUP) in breakout conditions for 2022 contributing to bearish market conditions. Currently the dollar index fund is showing another peaking pattern for a short term bounce with another short rally (arrow down) for basic materials and dollar sensitive sectors.
FinViz.com VMBreakouts.com 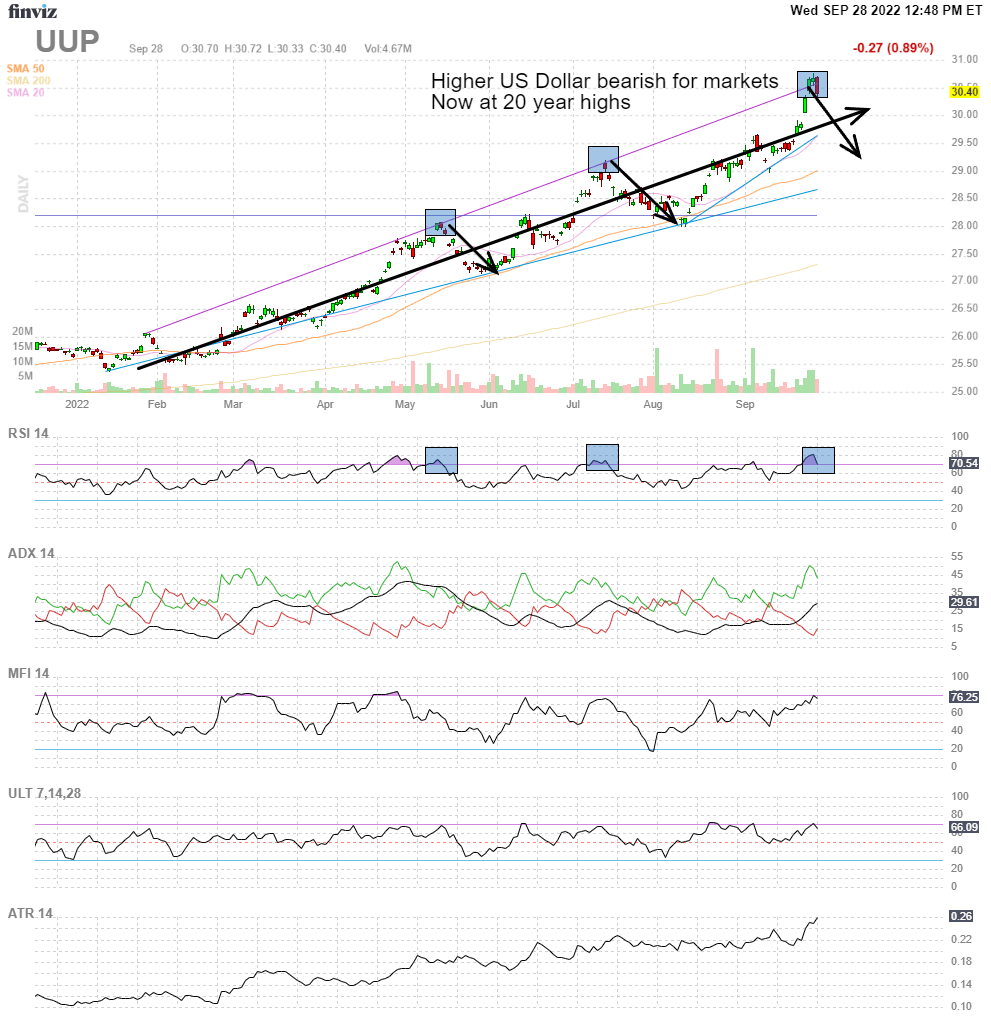
Apple Inc. (AAPL) is showing very strong similarities to the April negative Momentum Gauge breakdown. Also the technical indicators further validate continued weakness toward prior June lows. We will likely see the same high volatility bull traps on the way down to prior lows.
FinViz.com VMBreakouts.com 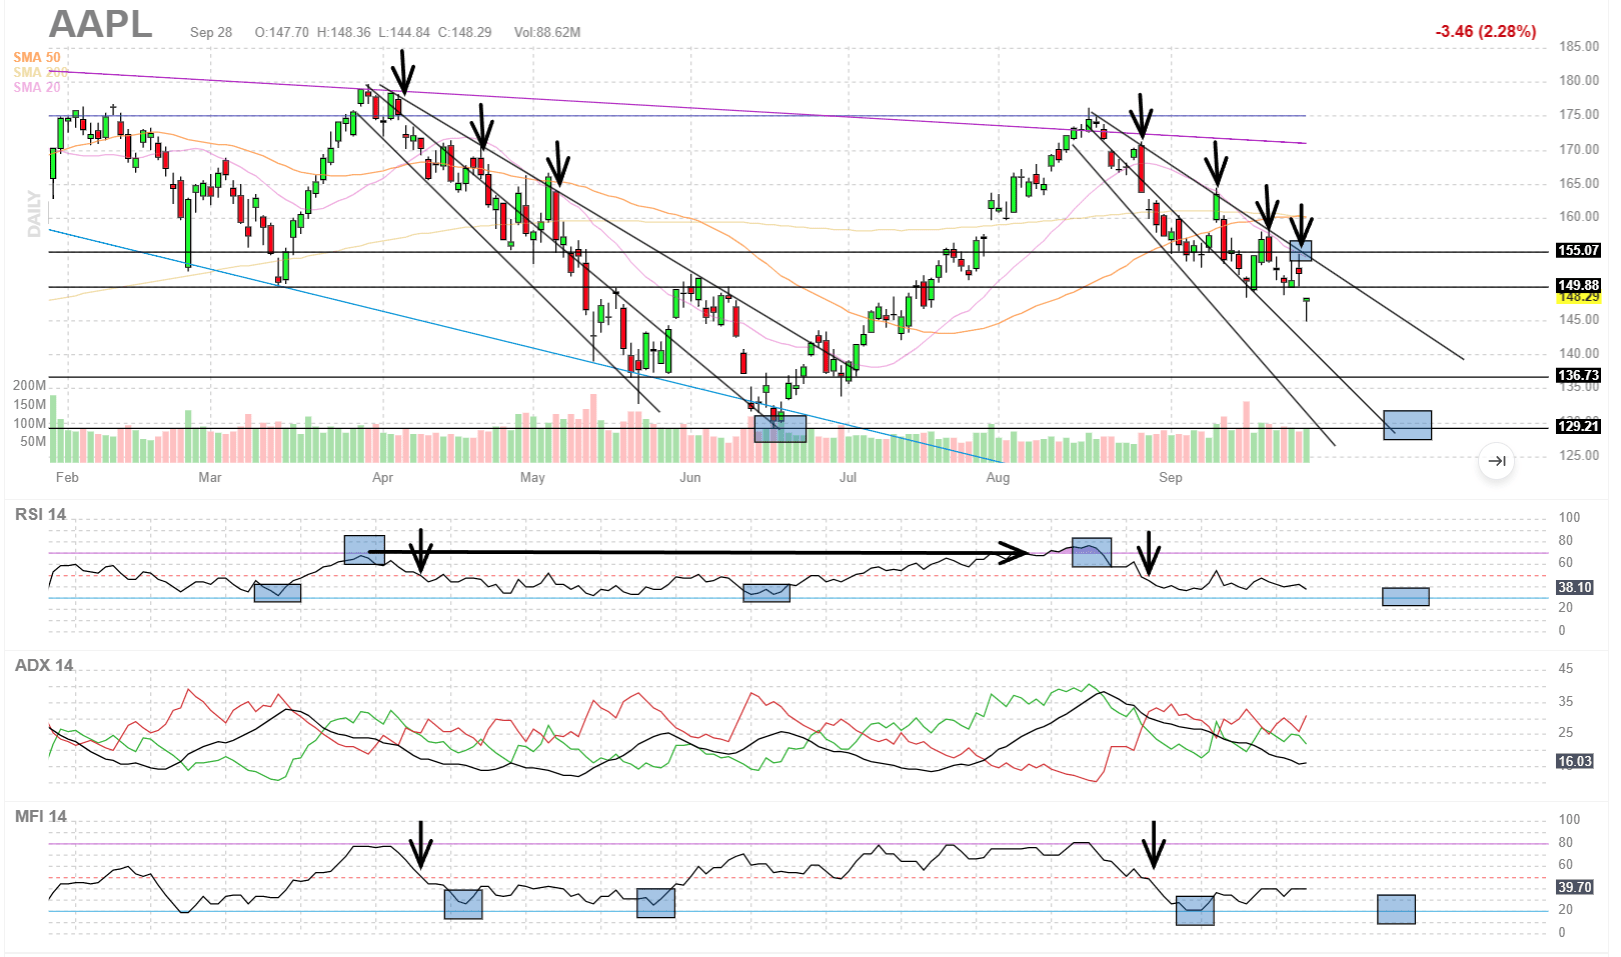
The Prior Negative Signals In Advance Of Major Downturns
Back on November 17th, the negative signal marked the 19th major negative Momentum Gauge® signal since publication of the model began in 2018. As the charts and indicators illustrate below, this current January signal is far more negative than the start of the November signal and the largest negative signal of the short 2022 trading year. In fact, the declines after the signal have seen the worst start to January trading since 2009.
VMBreakouts.com VMBreakouts.com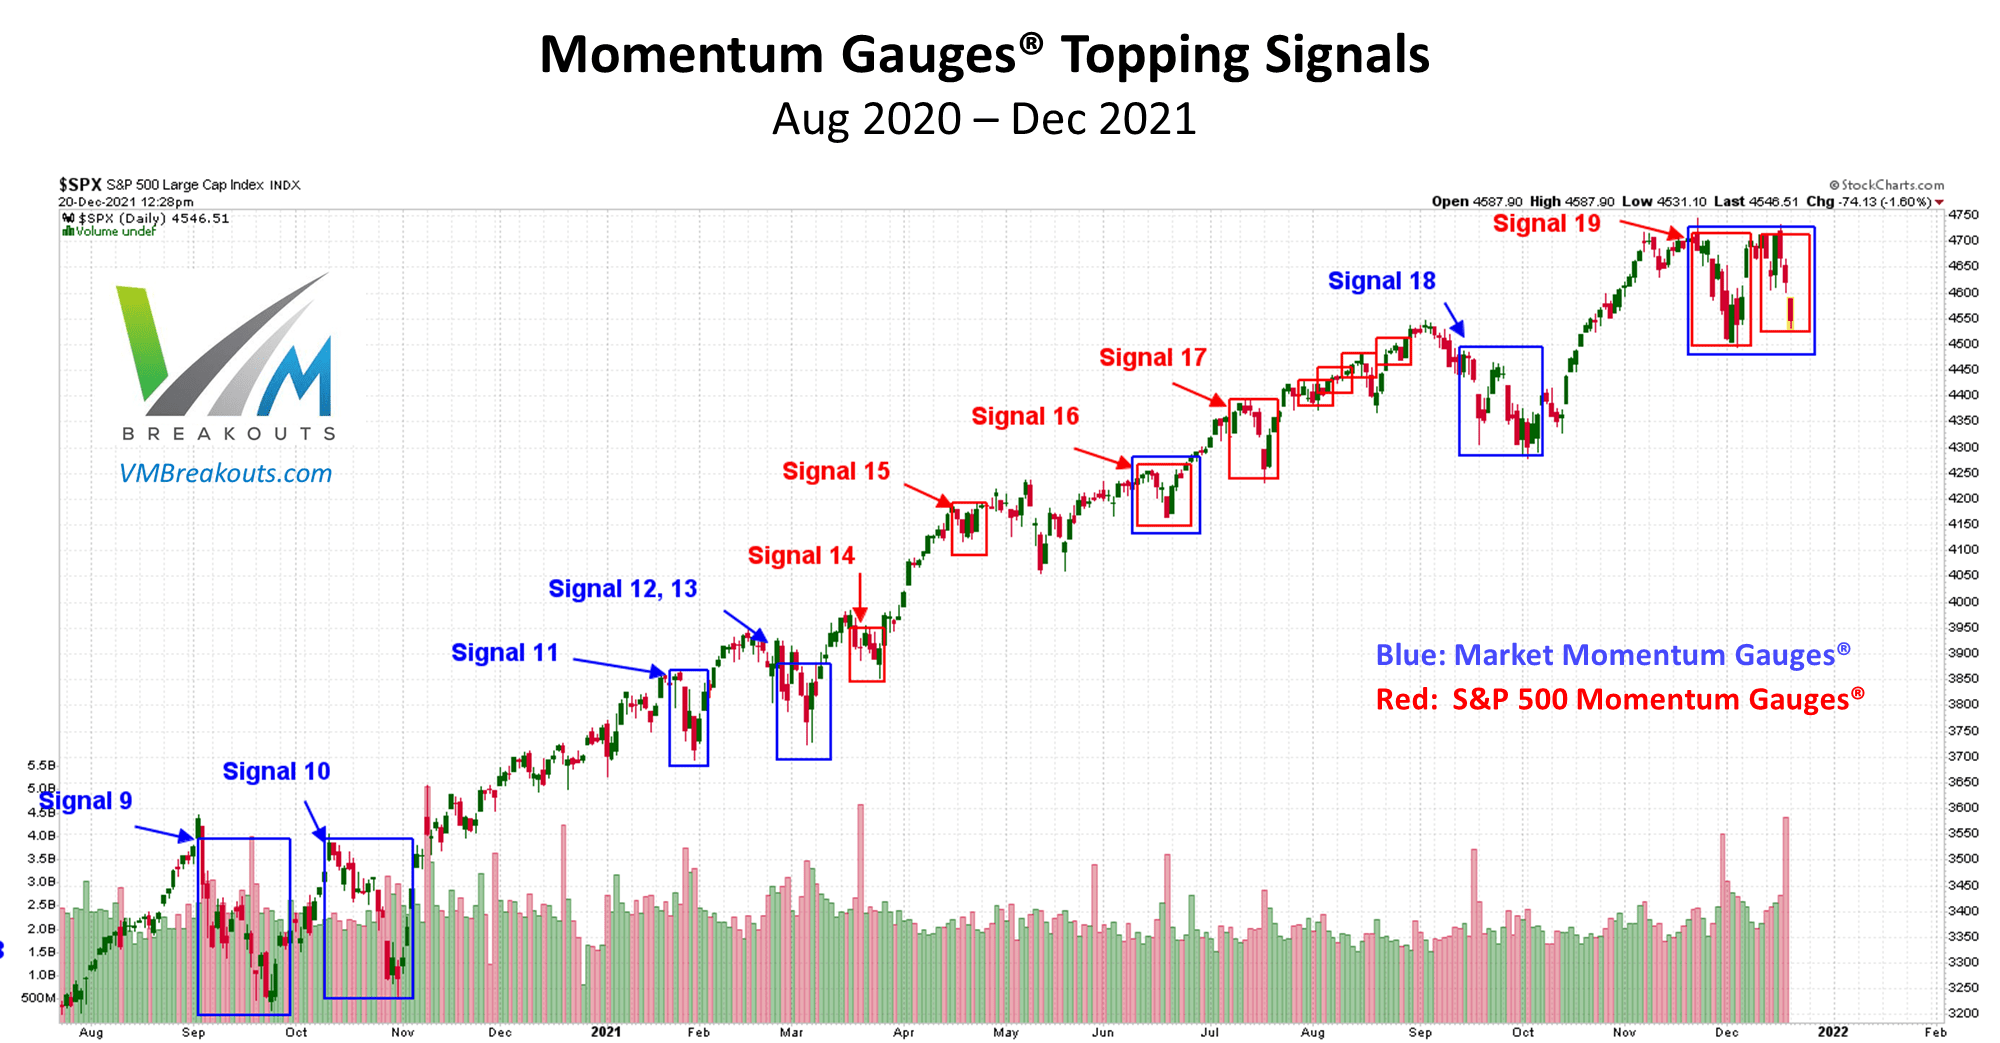
Review Of Prior Signals
- Signal 22 (September 13th, 2022) Momentum Gauge Topping Signal: 3rd Negative Signal In 2022
- Signal 20 (January 13th, 2022) Momentum Gauge Topping Signal: The First Negative Signal In 2022
-
Signal 19 (November 17th, 2021) Momentum Gauge Topping Signal: The Second Largest 2021 Negative Signal To Date
- Signal 16 (June 17th, 2021) Momentum Gauge Topping Signal June 17: The Largest Negative Signal In 2021
- Signal 11 (January 29, 2021): First Negative Momentum Gauge® Signal For 2021: Reviewing The Signals | Seeking Alpha Marketplace
- Signal 9-10 (September 13, 2020): An Election Year Correction Signal And Only The 3rd Negative Weekly MG Signal In 2020
- Signal 8 (June 24, 2020): Evaluating The 8th Market Correction Signal On June 24th That Has Preceded Every Recent Decline
- Signal 7 (March 23, 2020): Revisiting The Signals That Forecasted Every Recent Decline, In Search Of Early Recovery Indicators
- Signals 4-6 (Jan 28, 2020) : Revisiting The Signals That Forecasted Every Major Downturn Since “Volmageddon”: What’s Next
- Signals 1-3 (Aug 8, 2019): These 3 Measures Forecasted Every Major Downturn Since QT Started: What’s Next
Conclusion
The Momentum Gauges® are part of an active research project that has delivered highly profitable results to many readers of my published financial articles. I continue to enhance the model as we gather more data over many more months and years. The current market conditions with increasing rate hikes and the start of the Fed quantitative tightening program may contribute to weaker than average performance for 2022. Historically, from 1950, the six-month period between May and October averages the worst for the S&P 500 of any six-month period. The current Fed tightening conditions and approach of a potential recession may further increase the market risks this year.
LPL research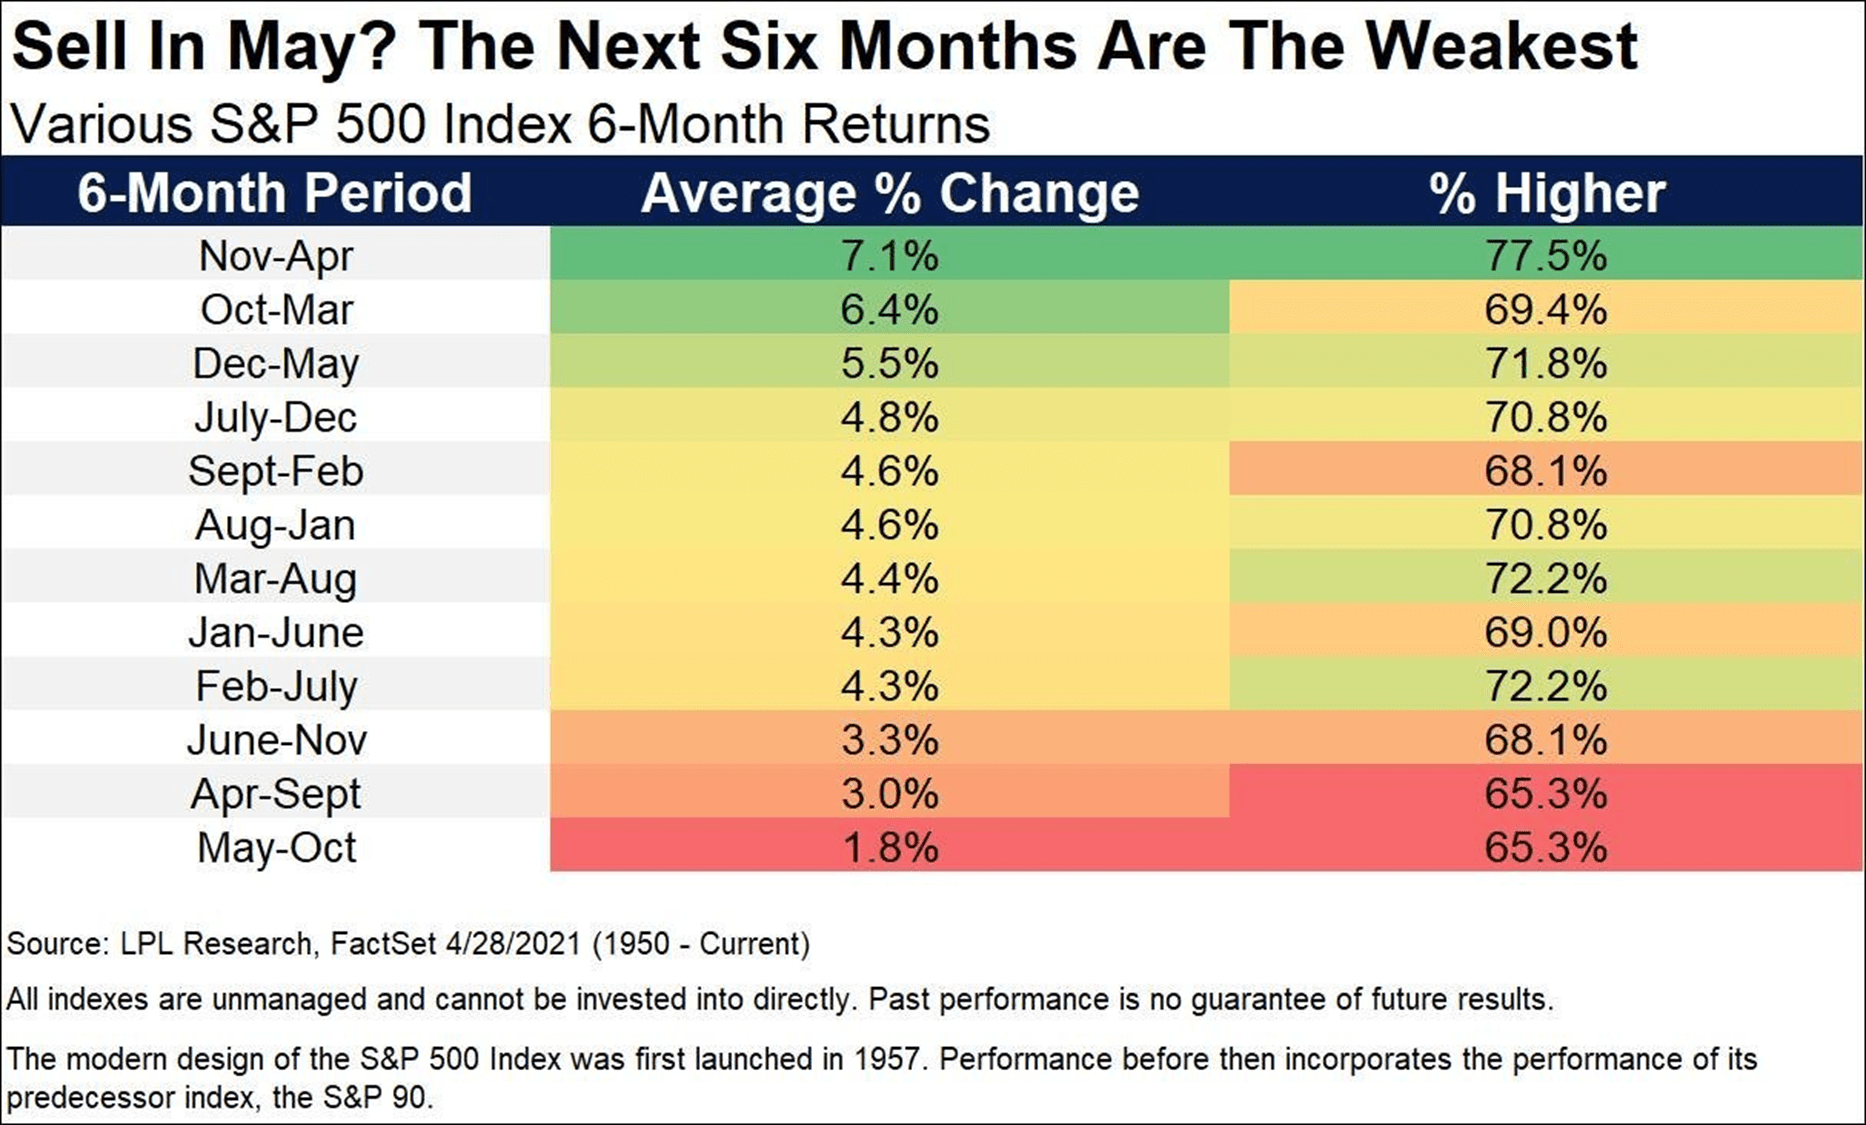
I hope this analysis provides you with additional market insight that benefits your trading in the year ahead.
All the very best to you!
JD Henning, PhD, MBA, CFE, CAMS
Be the first to comment